. 2021 Dec 28;118(52):e2112095118.
doi: 10.1073/pnas.2112095118.

Neuronal ROS-induced glial lipid droplet formation is altered by loss of Alzheimer's disease-associated genes

Affiliations

Neuronal ROS-induced glial lipid droplet formation is altered by loss of Alzheimer's disease-associated genes

Matthew J Moulton et al. Proc Natl Acad Sci U S A. .

Abstract

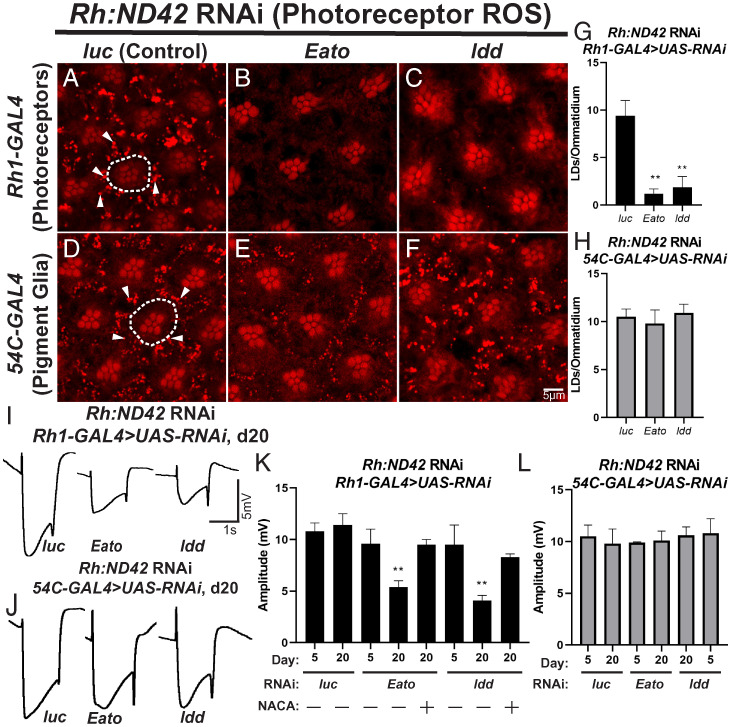
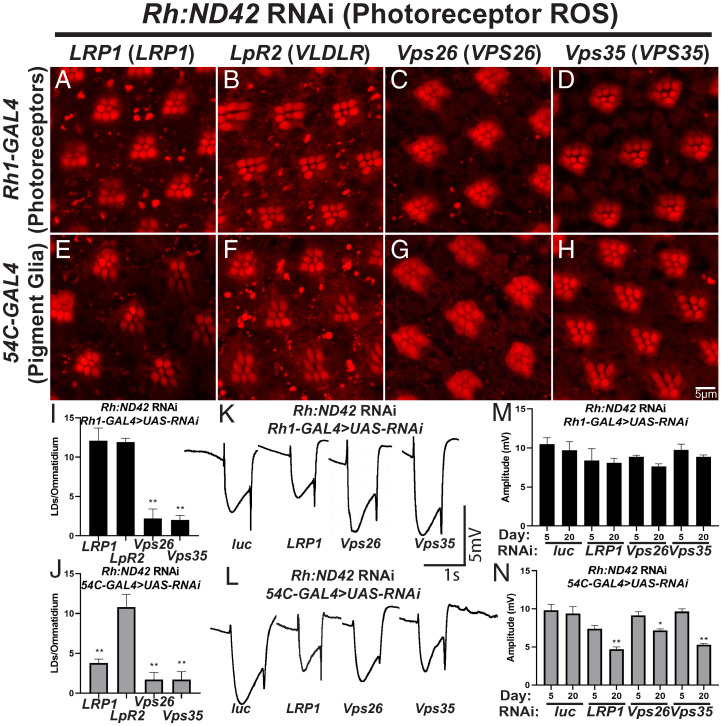
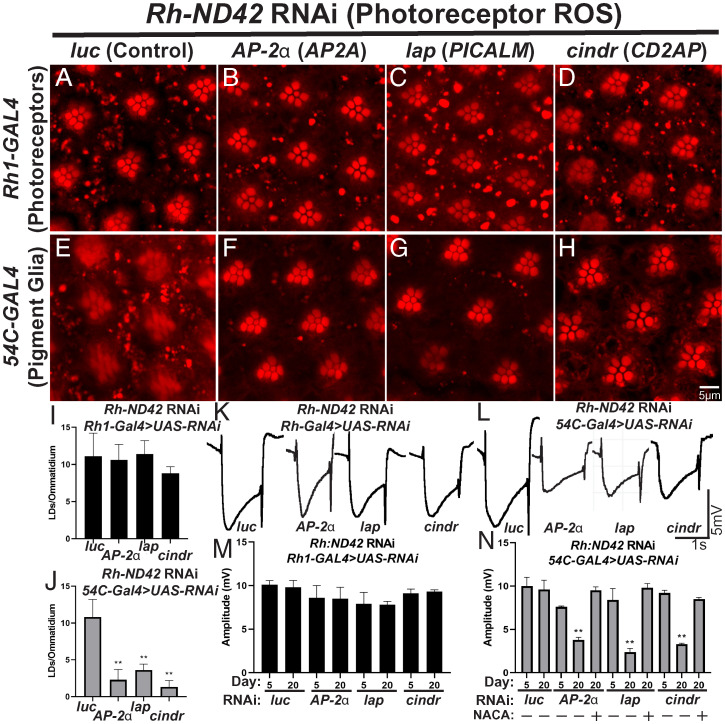
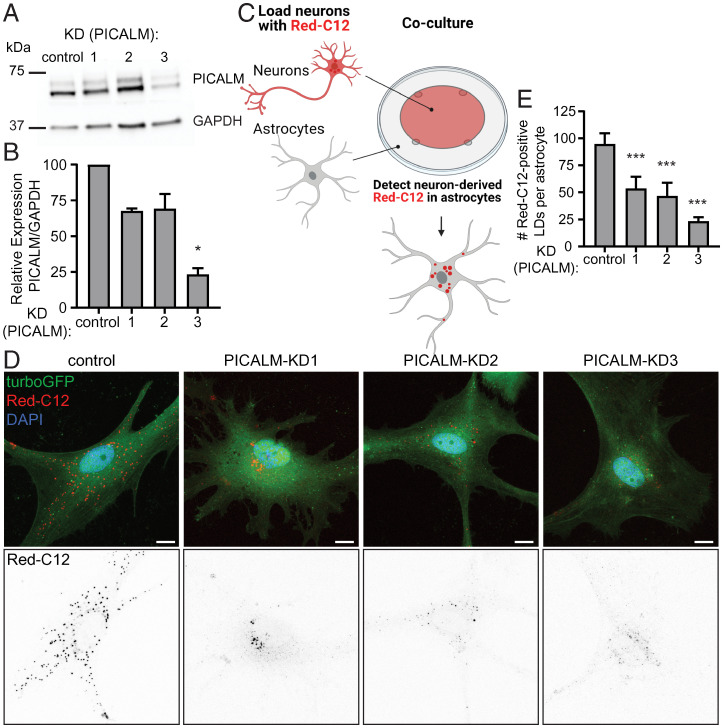
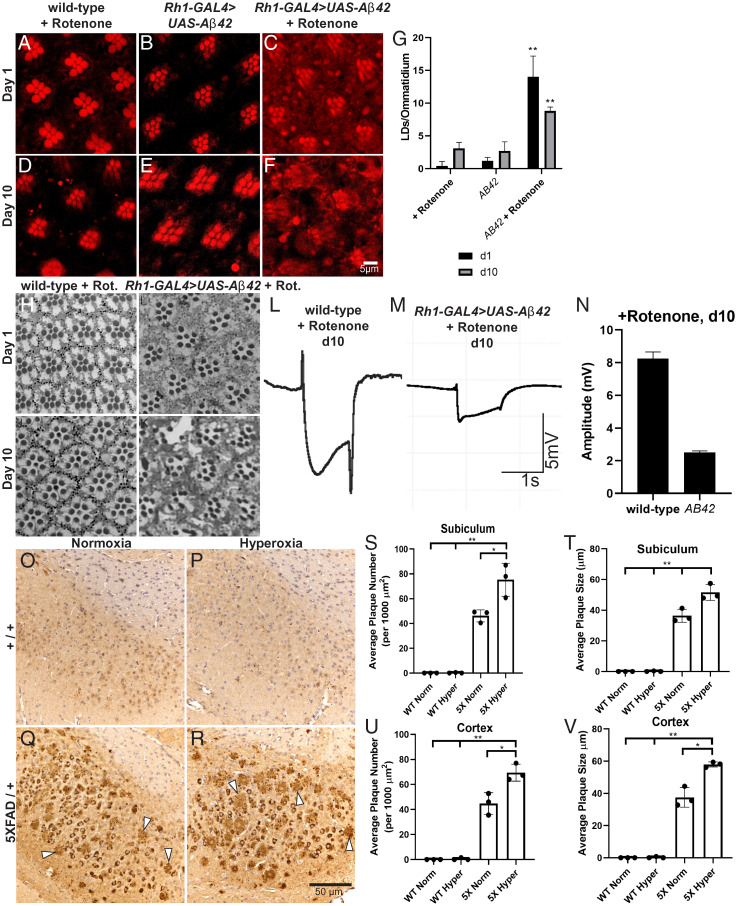
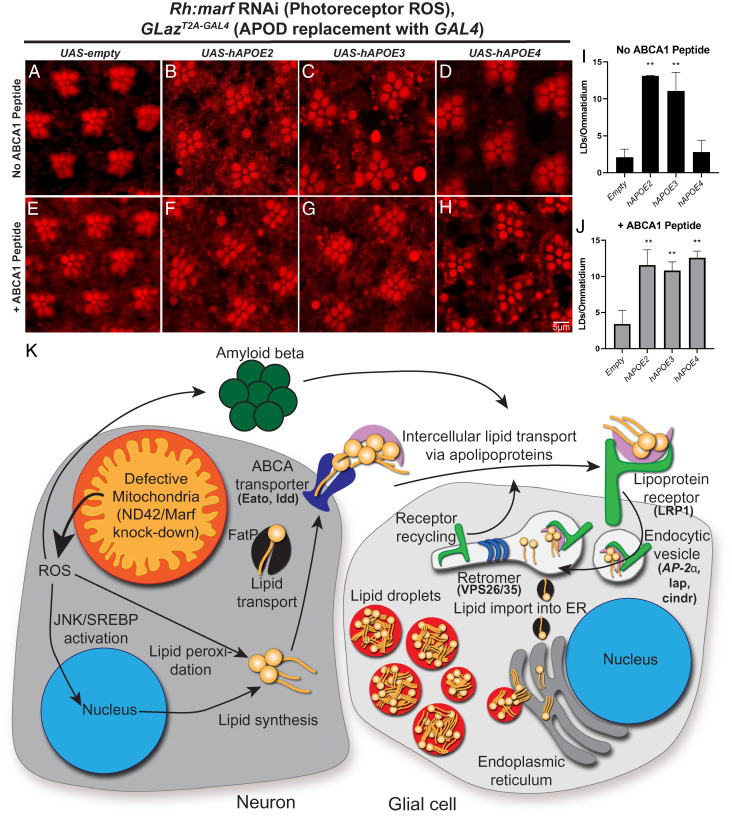
A growing list of Alzheimer's disease (AD) genetic risk factors is being identified, but the contribution of each variant to disease mechanism remains largely unknown. We have previously shown that elevated levels of reactive oxygen species (ROS) induces lipid synthesis in neurons leading to the sequestration of peroxidated lipids in glial lipid droplets (LD), delaying neurotoxicity. This neuron-to-glia lipid transport is APOD/E-dependent. To identify proteins that modulate these neuroprotective effects, we tested the role of AD risk genes in ROS-induced LD formation and demonstrate that several genes impact neuroprotective LD formation, including homologs of human ABCA1, ABCA7, VLDLR, VPS26, VPS35, AP2A, PICALM, and CD2AP Our data also show that ROS enhances Aβ42 phenotypes in flies and mice. Finally, a peptide agonist of ABCA1 restores glial LD formation in a humanized APOE4 fly model, highlighting a potentially therapeutic avenue to prevent ROS-induced neurotoxicity. This study places many AD genetic risk factors in a ROS-induced neuron-to-glia lipid transfer pathway with a critical role in protecting against neurotoxicity.

Keywords: Alzheimer’s disease; Drosophila; GWAS; lipid droplet; peroxidated lipid transfer.


Conflict of interest statement

Competing interest statement: J.O.J. is the President and CEO of Artery Therapeutics, Inc. and part owner of a patent of the peptide used in this work (Patent WO2014144708A1).

Figures

Fig. 1.
Fig. 1.
Two ABCA transporters (homologs of human ABCA1 and ABCA7) are required in neurons for glial LD formation. (A–H) LD analysis in fly retina. To induce ROS specifically in photoreceptor neurons, an RNAi against ND42, a mitochondrial complex I subunit, is expressed under the control of the ninaE (Rh) driver. Animals are reared at 29 °C under 12-h light/dark conditions for 24 h after eclosion, prior to isolation of retinas. ROS in photoreceptors induces glial LD formation in control animals (A and D). The photoreceptor rhabdomeres stain positive with Nile red but photoreceptors (dashed lines) do not accumulate LDs. In contrast, pigment glia accumulate LD (arrowheads). Knockdown of Eato and ldd in neurons (B and C), but not in glia (E and F), suppress LD formation, quantified in (G and H, photoreceptor knockdown: black bars, pigment glia knockdown: gray bars), demonstrating a critical role for these genes in neurons for LD formation. Mean ± SEM, one-way ANOVA with Tukey’s post hoc test **P < 0.01 compared to control, n ≥ 10 animals per genotype. (I–L) To assess the functional consequences of LD loss, we performed ERGs at day 5 and day 20. Animals were housed at 29 °C under 12-h light/dark conditions, n ≥ 10 animals per genotype. Representative ERG traces from animals with genotypes indicated (I–J). ERG amplitude quantification (K and L, photoreceptor knockdown: black bars, pigment glia knockdown: gray bars) show that neuronal knockdown of Eato and ldd lead to a severe reduction of ERG amplitude over time, indicative of progressive neurodegeneration, that is rescued by the addition of the antioxidant NACA. Glial knockdown of either Eato or ldd does not affect ERG amplitude. Mean ± SEM, one-way ANOVA with Tukey’s post hoc test *P < 0.05 and **P < 0.01 compared to control, n ≥ 10 animals per genotype.
Fig. 2.
Fig. 2.
The APOE receptor, LRP1, and retromer components Vps26 and Vps35 are required for LD formation. (A–J) LD analysis in fly retina. ROS is induced in neurons and RNAi directed against the apolipoprotein receptors (LRP1 and LpR2) or genes critical for retromer function (Vps26 and Vps35) are expressed in neurons (Rh1-GAL4, A–D) and pigment glia (54C-Gal4, E–H). Animals were reared at 29 °C under 12-h light/dark conditions for 24 h prior to isolation of retinas. LRP1 is required in glia (E) but not in neurons (A) to form LD, whereas LpR2 is not required in either cell (B and F). In contrast, the retromer proteins are required in both neurons and glia to form LD (C and D, G and H). Average LD number per ommatidium is quantified (I and J, photoreceptor knockdown: black bars, pigment glia knockdown: gray bars). Mean ± SEM, one-way ANOVA with Tukey’s post hoc test **P < 0.01 compared to control, n ≥ 10 animals for each genotype. (K–N) ERG assays were performed to assess neurodegeneration. Representative traces from animals of genotypes indicated (K and L). Quantification of ERG amplitude (M and N, photoreceptor knockdown: black bars, pigment glia knockdown: gray bars). Glial knockdown of LRP1, VPS26, or VPS35 inhibits LD formation and is associated with an age-dependent neurodegeneration, consistent with a neuroprotective role of glial LD. In contrast, despite LD formation defects when VPS26 or VPS35 were knocked down in neurons, no neurodegeneration or mild neurodegeneration occurs suggesting ROS production or its effects are abrogated. Mean ± SEM, One-way ANOVA with Tukey’s post hoc test *P < 0.05 and **P < 0.01 compared to control, n ≥ 10 animals for each genotype.
Fig. 3.
Fig. 3.
AD-associated GWAS genes are required in glia for LD formation upon neuronal ROS induction. (A–J) LD analysis in fly retina. ROS is induced in neurons and RNAi directed against homologs of 5 GWAS genes in photoreceptor neurons (A–D) or glia (E–H). Animals are housed at 29 °C under 12-h light/dark conditions for 24 h prior to isolation of retinas. Expression of RNAi against any genes tested in neurons do not affect the formation of LD in glia significantly (A–D). In contrast, RNAi targeting AP-2a, lap, and cindr in glia reduced LD formation significantly (E–H) as quantified (I, J, photoreceptor knockdown: black bars, pigment glia knockdown: gray bars). Mean ± SEM, one-way ANOVA with Tukey’s post hoc test *P < 0.05 and **P < 0.01 compared to control, n ≥ 10 animals for each genotype. (K–N) ERG assays were performed, as above, to assess neurodegeneration. Animals are housed at 29 °C under 12-h light/dark conditions, n ≥ 10 animals per genotype. Representative traces (K and L) and amplitude quantification (M and N, photoreceptor knockdown: black bars, pigment glia knockdown: gray bars) demonstrate that neuronal knockdown of these genes does not affect ERG amplitude. In contrast, glial knockdown of these genes led to a reduction in LD formation (AP-2a, lap, and cindr) also led to a significant reduction of ERG amplitude in aged animals, showing an age-progressive neurodegeneration, which is rescued by the addition of the antioxidant NACA. Mean ± SEM, one-way ANOVA with Tukey’s post hoc test **P < 0.01 compared to control, n ≥ 10 animals for each genotype.
Fig. 4.
Fig. 4.
Lipid transfer between neurons and astrocytes is blunted by knockdown of PICALM. (A) Astrocytes were transduced with lentivirus expressing nontargeting shRNA (control), or three independent PICALM targeting shRNAs (KD1-3). Cell lysates were analyzed by Western blot for PICALM levels and GAPDH as a loading control. (B) Levels of PICALM from transduced astrocytes were quantified and normalized to GAPDH control. Mean ± SEM, Kruskal–Wallis test with Dunn’s posttest *P < 0.05 compared to control, n = 3 from three independent experiments. (C) Schematic of Red-C12 transfer assay. (D) Representative maximum-intensity projections of confocal images of transduced astrocytes following the assay. TurboGFP reporter expression marks transduced cells. (Scale bars, 10 µm.) (E) Quantification of Red-C12+ LDs in astrocytes. Mean ± SEM, one-way ANOVA with Dunnett’s posttest ***P < 0.001 compared to control, n = 6 cells from three independent experiments each.
Fig. 5.
Fig. 5.
Elevated ROS and the presence of Aβ42 synergize to induce neurodegeneration in flies and mice. (A–G) LD analysis in fly retina. Animals are housed at 29 °C under 12-h light/dark conditions with food changed daily; representative images of ≥10 animals per genotype. Wild-type flies exposed to 25 µM rotenone food for (A) 1 d or (D) 10 d posteclosion were compared with Aβ42-expressing flies at (B) 1 d posteclosion or (E) 10 d posteclosion and with Aβ42-expressing flies exposed to 25 µM rotenone food for (C) 1 d posteclosion and (F) 10 d posteclosion. Note the absence of LD formation with either treatment but the obvious increase in diffuse Nile red staining and the demise of PR by day 10 showing that ROS and Aβ42 synergize to cause the demise of neurons as quantified (G, day 1: black bars, day 10: gray bars). Mean ± SEM, one-way ANOVA with Tukey’s post hoc test **P < 0.01 compared to control, n ≥ 10 animals for each genotype. (H–K) Retinal sections stained with Toluidine blue were obtained from wild-type and Aβ42-expressing flies fed rotenone for 10 d and imaged at 20× magnification. Neurodegeneration is apparent in d10 Aβ42 flies fed rotenone (K). (L–N) Neurodegeneration is also evident by decreased ERG amplitude compared to wild-type, rotenone-fed flies. (O–V) Aβ42 immunohistochemical analysis of 4-mo-old mouse brain sections from wild-type mice reared in normoxic (O) or hyperoxic (P) conditions compared to 5XFAD mice reared in normoxic (Q) or hyperoxic (R) conditions for 3 mo prior to being killed. Arrowheads indicate amyloid plaques, n = 3 animals per genotype and treatment condition. Quantification of average plaque number (S and U) and plaque size (T and V) in the brain regions indicated from mice in (O–R). Plaque size and number is elevated in Aβ-expressing mice exposed to hyperoxia. Mean ± SEM, one-way ANOVA with Tukey’s post hoc test *P < 0.05 and **P < 0.01 compared to control, n = 3 animals for each genotype.
Fig. 6.
Fig. 6.
An ABCA1 agonist peptide rescues LD formation in the presence of APOE4. (A–J) LD analysis in fly retina. ROS was induced in photoreceptor neurons, as previously reported (17, 40), using an RNAi against marf, the fly ortholog of mitofusin, under the control of ninaE (Rh). Animals are reared at 29 °C under 12-h light/dark conditions for 24 h prior to isolation of retinas; representative images of ≥10 animals per genotype. We utilized a previously characterized allele of Glial Lazarillo (GLaz-T2A:GAL4). LD formation is inhibited in GLaz-T2A-GAL4/+ flies but can be restored by expressing human APOE2 or APOE3, but not APOE4. An ABCA1 agonist peptide was genetically encoded in the fly and expressed in the human APOE variant flies to assess LD formation. Expression of the peptide does not affect LD formation in the presence of APOE2 or APOE3, but fully restores LD formation in the APOE4 expressing flies (E–H) and quantified (I and J, no peptide: black bars, + peptide: gray bars) showing that LD formation is strongly enhanced by the peptide. Mean ± SEM, one-way ANOVA with Tukey’s post hoc test **P < 0.01 compared to control, n = 10 to 15 animals for each genotype. (K) Model of LD accumulation and players identified in this study. We propose a model in which genetic (loss of ABCA, endocytic, or retromer genes) together with ROS sensitize neurons to the presence of amyloid accumulation to induce neurodegeneration. It is likely that this synergy between multiple insults exacerbates neuronal loss in disease. We demonstrated that lipid transfer between neurons and glia requires neuronal ABCA transporters, a glial apolipoprotein receptor, and the retromer, which is required for LRP1 recycling. We propose that endocytosis of lipid particles are processed through lysosomes upon endocytosis. Lysosomes degrade Aβ42 while the lipids are shuttled to the endoplasmic reticulum (ER) to form LD. Hence, this transport of peroxidated lipids and Aβ42 provides a dual protective effect.

References

    1. Masdeu J. C., Neuroimaging of diseases causing dementia. Neurol. Clin. 38, 65–94 (2020). - PubMed
    1. Bloom G. S., Amyloid-β and tau: The trigger and bullet in Alzheimer disease pathogenesis. JAMA Neurol. 71, 505–508 (2014). - PubMed
    1. Yiannopoulou K. G., Anastasiou A. I., Zachariou V., Pelidou S. H., Reasons for failed trials of disease-modifying treatments for Alzheimer disease and their contribution in recent research. Biomedicines 7, 97 (2019). - PMC - PubMed
    1. De Strooper B., Karran E., The cellular phase of Alzheimer’s disease. Cell 164, 603–615 (2016). - PubMed
    1. Kunkle B. W., et al. ; Alzheimer Disease Genetics Consortium (ADGC); European Alzheimer’s Disease Initiative (EADI); Cohorts for Heart and Aging Research in Genomic Epidemiology Consortium (CHARGE); Genetic and Environmental Risk in AD/Defining Genetic, Polygenic and Environmental Risk for Alzheimer’s Disease Consortium (GERAD/PERADES), Genetic meta-analysis of diagnosed Alzheimer’s disease identifies new risk loci and implicates Aβ, tau, immunity and lipid processing. Nat. Genet. 51, 414–430 (2019). - PMC - PubMed

Publication types

Substances

LinkOut - more resources