. 2022 Jan;19(1):81-89.
doi: 10.1038/s41592-021-01328-8. Epub 2021 Dec 23.

Rapid, efficient and activation-neutral gene editing of polyclonal primary human resting CD4+ T cells allows complex functional analyses

Affiliations

Rapid, efficient and activation-neutral gene editing of polyclonal primary human resting CD4+ T cells allows complex functional analyses

Manuel Albanese et al. Nat Methods. 2022 Jan.

Abstract

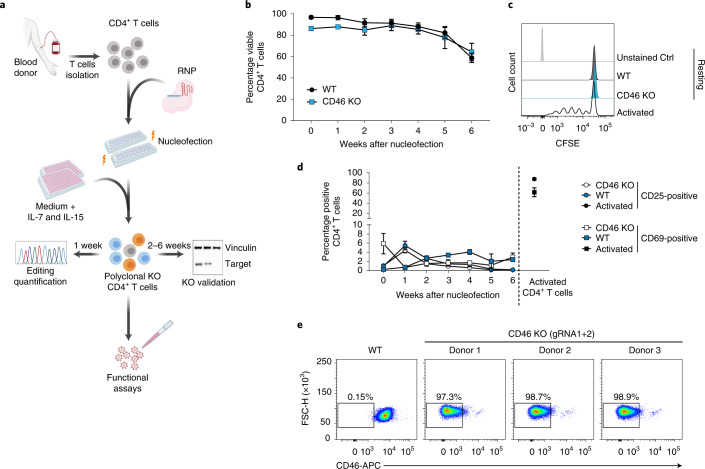
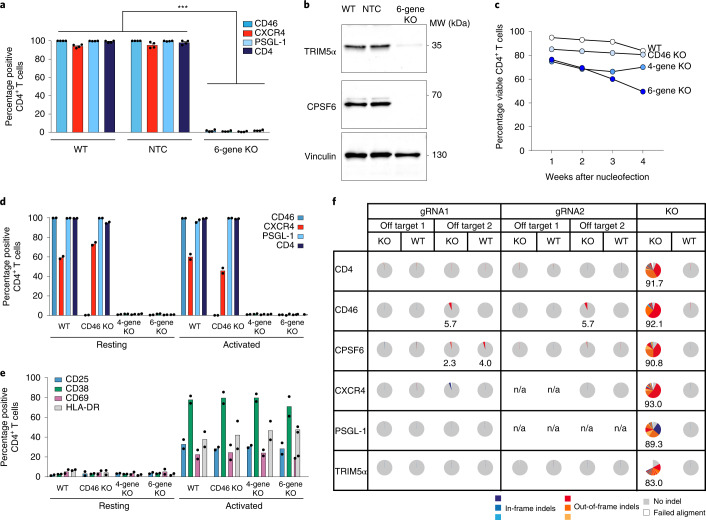
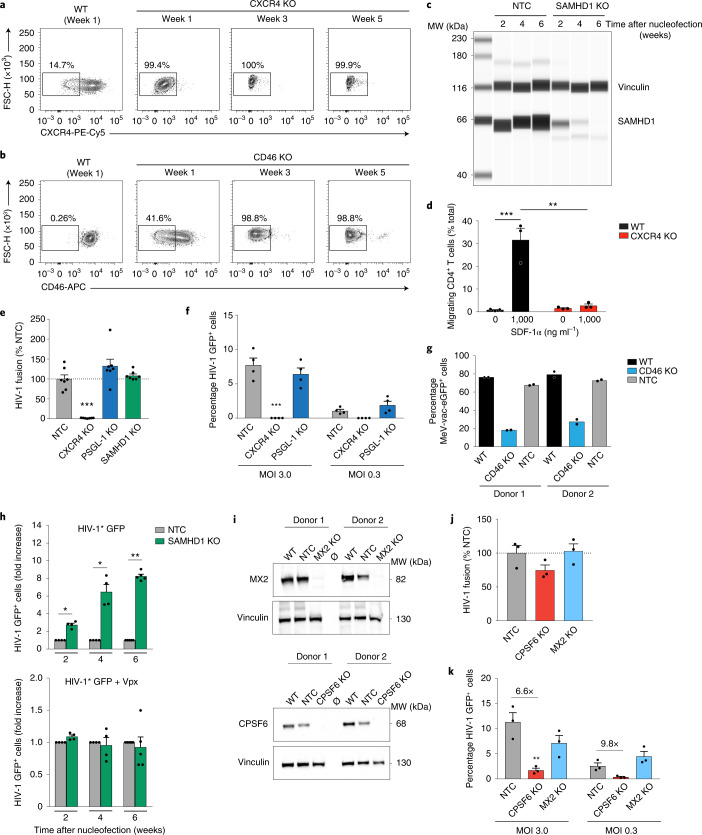
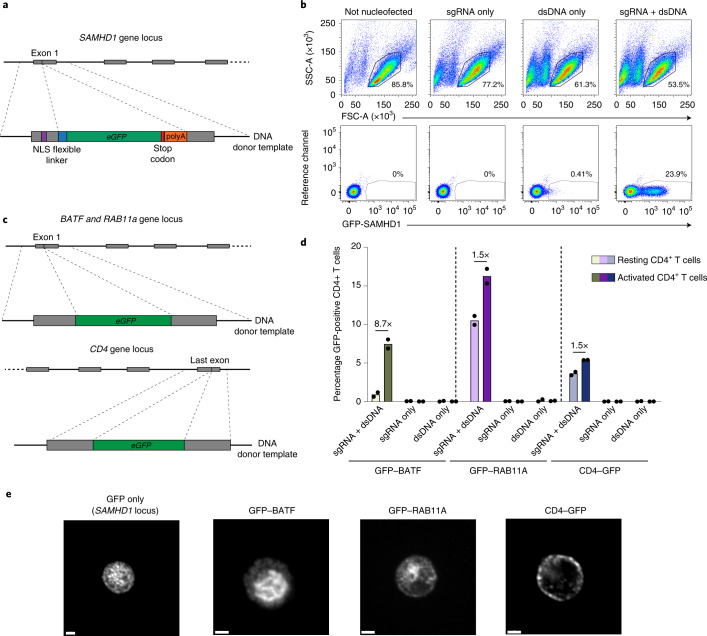
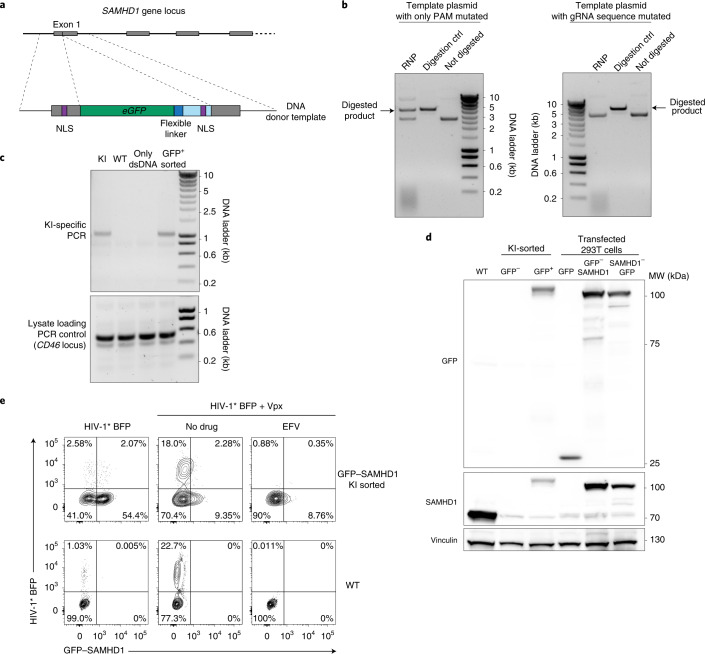
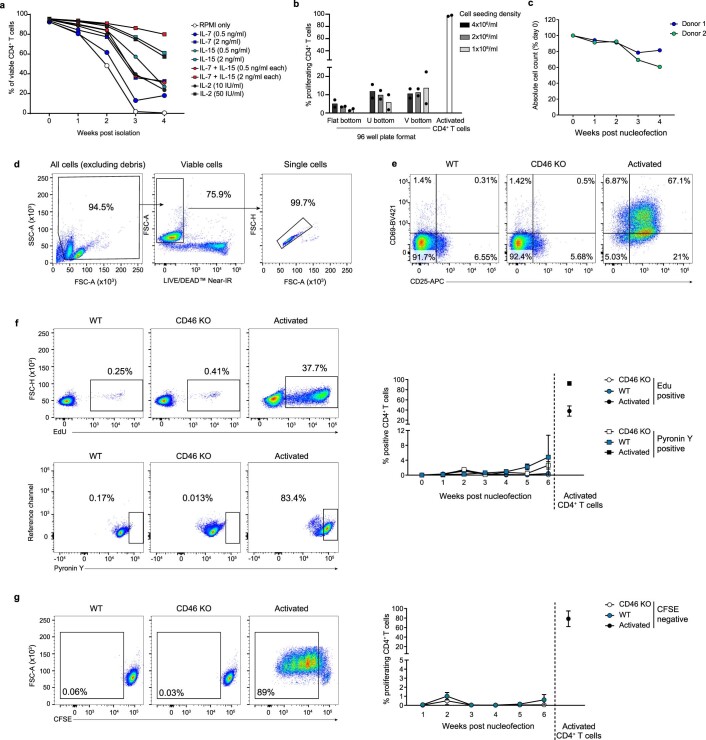
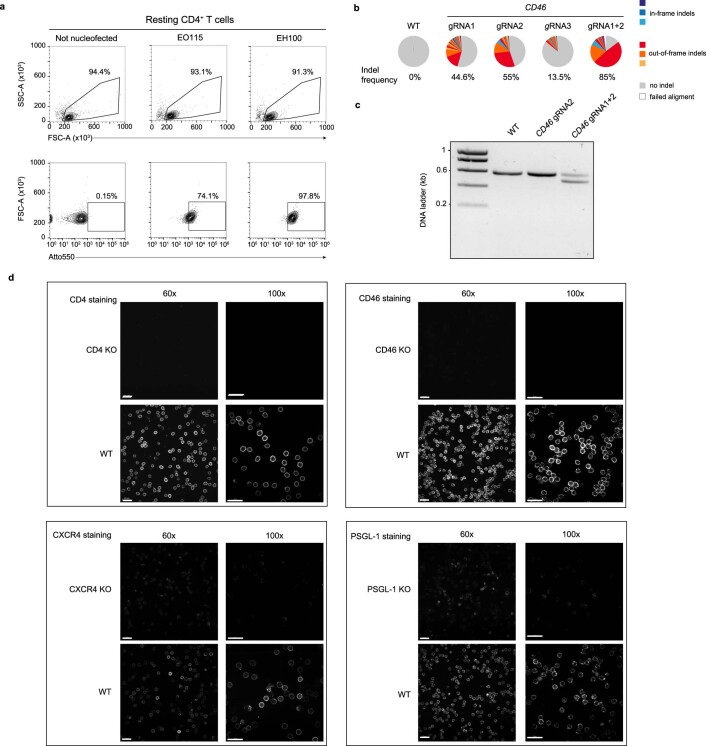
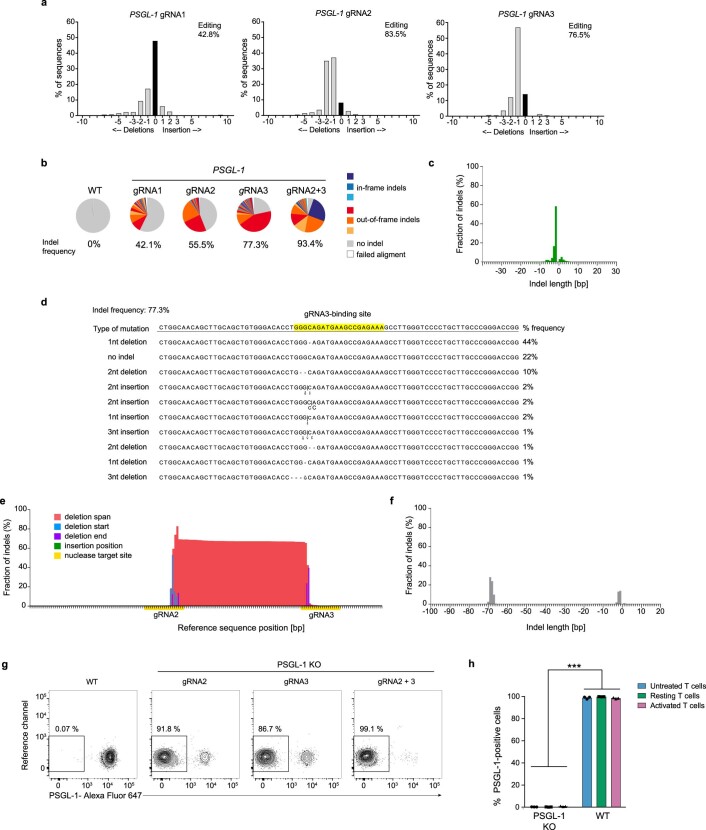
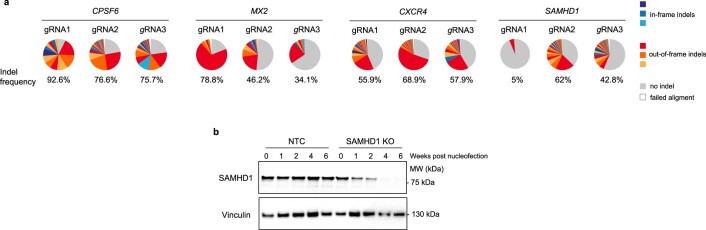
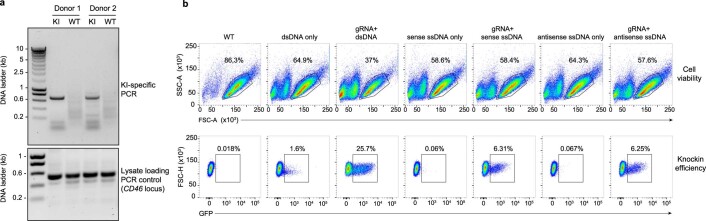
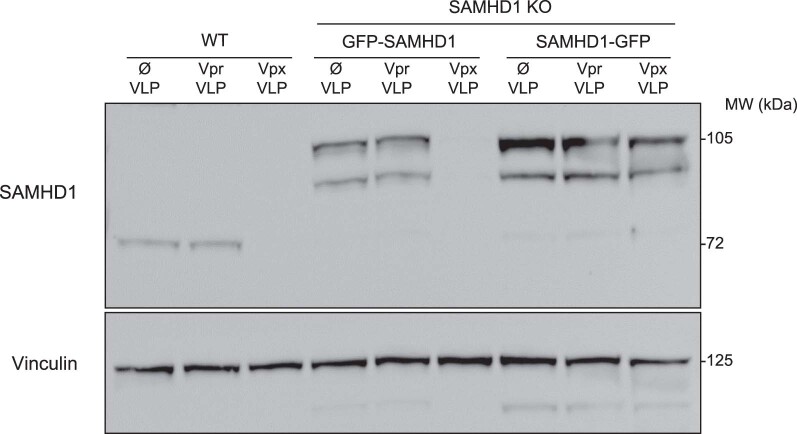
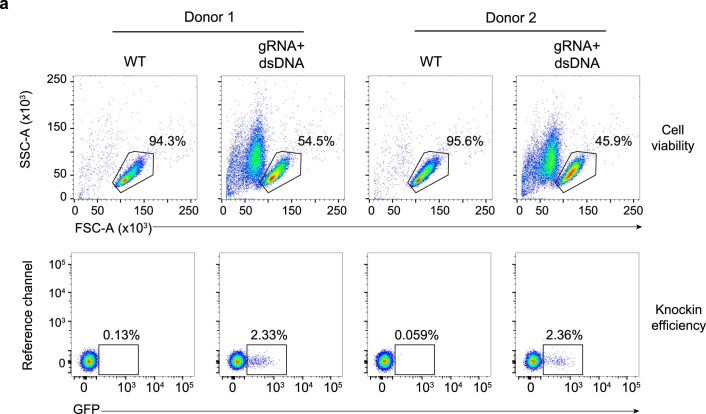
CD4+ T cells are central mediators of adaptive and innate immune responses and constitute a major reservoir for human immunodeficiency virus (HIV) in vivo. Detailed investigations of resting human CD4+ T cells have been precluded by the absence of efficient approaches for genetic manipulation limiting our understanding of HIV replication and restricting efforts to find a cure. Here we report a method for rapid, efficient, activation-neutral gene editing of resting, polyclonal human CD4+ T cells using optimized cell cultivation and nucleofection conditions of Cas9-guide RNA ribonucleoprotein complexes. Up to six genes, including HIV dependency and restriction factors, were knocked out individually or simultaneously and functionally characterized. Moreover, we demonstrate the knock in of double-stranded DNA donor templates into different endogenous loci, enabling the study of the physiological interplay of cellular and viral components at single-cell resolution. Together, this technique allows improved molecular and functional characterizations of HIV biology and general immune functions in resting CD4+ T cells.


Conflict of interest statement

The authors declare no competing interests.

Figures

Fig. 1
Fig. 1. Highly efficient KO generation in primary human resting CD4+ T cells.
a, Schematic overview of the pipeline to establish polyclonal KOs in human resting CD4+ T cells. b, Viability of CD46 KO or untreated WT resting CD4+ T cells kept in culture for up to 6 weeks. Cell viability was assessed at the indicated time points by flow cytometry. Mean ± s.e.m. are shown (n = 3). c, T-cell proliferation assay. CFSE-labeled CD46 KO and WT CD4+ T cells analyzed by flow cytometry 1 week after nucleofection. Anti-CD3/CD28 antibody-activated CD4+ T cells (activated) served as positive control (Ctrl). One representative experiment is shown (n = 3). d, WT and CD46 KO resting CD4+ T cells were analyzed by flow cytometry for expression of T-cell activation markers CD25 and CD69. Mean ± s.e.m. are shown (n = 3). e, Resting CD4+ T cells (WT or CD46 KO) were analyzed for cell surface expression of CD46 2 weeks after nucleofection. Shown are dot plots of flow cytometric analyses for cells from three individual donors and WT cells from one of these donors. Fig. 1a created with BioRender.com. Source data
Fig. 2
Fig. 2. Polyclonal KO of up to six genes in primary human resting CD4+ T cells.
a, Simultaneous, polyclonal six-gene KO following a single RNP nucleofection. Expression of surface receptors was quantified by flow cytometry after 2 weeks. Mean ± s.e.m. are shown (n = 4). Statistics indicate significance by two-way analysis of variance (ANOVA). P values were corrected for multiple comparison (Tukey). ***P ≤ 0.001. b, Immunoblot analysis of cell lysates from the experiment shown in a 25 d after nucleofection. All targets were validated on the same membrane by re-probing. One representative experiment is shown (n = 2). c, Viability of cells with CD46-single KO, four-gene KO (CD46, CD4, CXCR4 and PSGL-1) or six-gene KO (as in a) were analyzed. WT cells served as control. Means are shown (n = 2). d,e, Resting cells were nucleofected, cultivated for 2 weeks and then either activated or not for one additional week before analyzing expression of the indicated surface receptors (d) and T-cell activation markers CD25, CD69, CD38 and HLA-DR (e) by flow cytometry. Means are shown (n = 2). f, Off-target analysis in resting CD4+ T cells following six-gene KO (as in a). Specific primers were designed to target the top two off-target coding loci predicted for each gRNA used (Extended Data Table 1). One week after nucleofection, cells were collected and lysed. A PCR specific for each off-target site was performed and analyzed by Illumina MiSeq. WT cells from the same donors served as control. Results from one out of two donors are shown. Percentages of indel frequencies are shown if >0.5%. NA, not available. Source data
Fig. 3
Fig. 3. Phenotypic characterization of various single-gene KOs in polyclonal, resting CD4+ T cells.
a,b, FACS density plots of surface-exposed CXCR4 (a) or CD46 (b) from one experiment at three time points (n = 3). c, WES immunoblot for SAMHD1 in cultivated KO or NTC cells. Vinculin was the loading control. One representative experiment is shown (n = 4). d, SDF-1α (CXCL12)-driven chemotaxis of cells 1 week after nucleofection. Mean ± s.e.m. are shown (n = 3). Statistics indicate significance by two-way ANOVA. P values were corrected for multiple comparison (Tukey) (***P = 0.0007; **P = 0.0010). e, The frequency of cells (NTC or indicated KOs) positive for cleaved CCF2 substrate after challenge with HIV-1 carrying BlaM-Vpr, indicative of HIV-1 fusion, was determined by flow cytometry. Mean ± s.e.m. are shown (n = 7). Statistics indicate significance by one-way ANOVA. P values were corrected for multiple comparisons (Dunnet) (***P = 0.0002). f, Cells with the indicated KOs were challenged 2 weeks after nucleofection with HIV-1 GFP at two MOIs and analyzed 3 d later. Mean ± s.e.m. are shown (n = 4). Statistics indicate significance by two-way ANOVA. P values were corrected for multiple comparisons (Tukey) (***P = ≤ 0.001). g, Cells were challenged 2 weeks after nucleofection with measles reporter virus MeV-vac-eGFP and analyzed for reporter expression by flow cytometry 1 d later. Means of technical duplicates are shown (n = 2). h, At the indicated weeks after nucleofection, SAMHD1 KO cells or NTC control cells were challenged with HIV-1* GFP either without Vpx (top) or carrying Vpx (+Vpx, bottom) and analyzed 3 d later by flow cytometry. Infection values for the NTC control were set to 1. Mean ± s.e.m. are shown (n = 5). Statistics indicate significance by two-tailed Mann–Whitney U-test. (2 weeks, *P = 0.0286; 4 weeks, *P = 0.0286; 6 weeks, **P = 0.0079). i, Immunoblots for MX2 (top) or CPSF6 (bottom) in cell lysates 4 weeks after nucleofection. Vinculin was the loading control. Two representative donors are shown (n = 4). Ø, empty lane. j,k, HIV-1 fusion (j) and HIV-1 GFP infection (k) in cells with the indicated KOs 4 weeks after nucleofection (as in e and f, respectively). Mean ± s.e.m. are shown (n = 3). Statistics indicate significance by two-way ANOVA. P values were corrected for multiple comparison (Dunnet) (**P = 0.0054). Source data
Fig. 4
Fig. 4. CRISPR-Cas9-mediated knock in of eGFP into different loci in resting CD4+ T cells.
a, KI-targeting strategy to introduce eGFP into the SAMHD1 locus. b, Cell viability and GFP expression after KI of the dsDNA cassette shown in a. Cells nucleofected with sgRNA2 only or with dsDNA only served as references. One representative experiment is shown (n = 3). c, KI-targeting strategy to introduce GFP to the N terminus of either BATF or RAB11A, or to the C terminus of CD4, in principle as reported for activated T cells. d, GFP expression after KI of constructs from c analyzed by flow cytometry (sgRNA + dsDNA). Nucleofection of sgRNA only or dsDNA only served as references. CD4+ T cells were kept either resting or activated 3 d after nucleofection. Means of two independent donors are shown. e, Activated KI CD4+ T cells shown in d were fixed and stained with an antibody against GFP and analyzed by confocal microscopy. Representative micrographs from one experiment are shown (n = 3). Scale bars, 2 µm. Source data
Fig. 5
Fig. 5. GFP-SAMHD1 endogenously expressed in resting CD4+ T cells is functional in the context of HIV-1 infection and degraded by particle-packaged Vpx.
a, KI-targeting strategy to introduce a N-terminal GFP fusion into the endogenous SAMHD1 locus. The dsDNA template from a was introduced into a plasmid and digested using the SAMHD1-gRNA2-containing RNP. b, Digestion of the dsDNA template with either PAM sequence mutated only (left) or the sequence complementary to SAMHD1-gRNA2 mutated completely, including the PAM sequence (right). No digestion or BstBI digestion (digestion ctrl) served as references. One experiment is shown (n = 2). c, GFP-positive KI resting CD4+ T cells were sorted by flow cytometry and lysed and a PCR specific for the eGFP integration into the SAMHD1 locus was performed. Untreated WT cells and cells nucleofected with dsDNA template only served as references. A PCR specific for the CD46 locus was used as loading control (bottom). One experiment is shown (n = 2). d, Sorted cells from c, either positive or negative for GFP, were immunoblotted for both SAMHD1 and GFP. WT cells served as reference; vinculin was the loading control. The 293T cells transfected with expression plasmids encoding either GFP, GFP–SAMHD1 or SAMHD1–GFP served as references. One representative experiment is shown (n = 2). e, Cells were challenged with equivalent infectious units of HIV-1* BFP virions with (+Vpx) or without the lentiviral SAMHD1 antagonist Vpx and analyzed by flow cytometry on day 3. Reverse transcriptase inhibitor EFV served as a specificity control. One representative experiment is shown (n = 2).
Extended Data Fig. 1
Extended Data Fig. 1. Basic culture conditions to keep human CD4+ T cells viable and resting.
a, Combined IL-7/IL-15 treatment is optimal for resting CD4+ T cells. Primary CD4+ T cells were enriched from PBMCs from healthy donors using the EasySep Rosette Human CD4+ T Cell enrichment kit (negative selection). Isolated cells were kept in culture for 4 weeks with the addition of the indicated interleukins to the culture medium. The interleukin supplement was refreshed twice a week. Once a week an aliquot of cells was analyzed by staining with LIVE/DEADTM Fixable Near-IR Dead Cell Stain to assess the culture’s viability. Means are shown (n = 2). b, Resting CD4+ T cells were labeled with CFSE, seeded at the indicated cell concentrations and plate formats (flat bottom, U bottom, V bottom), and maintained in culture with medium containing IL-7/IL-15 (both 2 ng/ml). Two weeks later, cell proliferation was assessed by flow cytometry. Means are shown (n = 2). Anti-CD3/CD28 mAb-activated CD4+ T cells served as positive control. c, Once a week over a period of four weeks WT cells were analyzed by flow cytometry using BD Trucount™ Tubes to assess absolute cell counts. Data from two independent donors are shown. d, Gating strategy to assess cell viability by staining with LIVE/DEADTM Fixable Near-IR Dead Cell Stain. e-g, RNP nucleofection per se does not alter cell’s activation state. Resting CD4+ T cells were nucleofected with RNPs specific for CD46 (gRNA1 + 2), and CD46 KO cells and WT cells were maintained in culture with medium containing IL-7/IL-15 (both 2 ng/ml) and (e) analyzed two weeks later for expression of T cell activation markers CD25 and CD69. Anti-CD3/CD28 mAb-activated CD4+ T cells served as positive control. f,g, Once a week over a period of six weeks, cells were also analyzed by flow cytometry for the following parameters: DNA synthesis by EdU incorporation assay (f, top panels), RNA content quantification by Pyronin Y staining (f, bottom panels), cell proliferation by CFSE staining (g). Left panels show one representative example at week 2 after nucleofection. Right panels are the summary of all results with means ± s.e.m. (n = 3). Note that EdU incorporation scores cell division only at the time point of analysis, while CSFE analysis tracks cell division events during the entire cultivation period. Typically, both markers stayed below 1% positivity in cultures for up to 6 weeks, consistent with a lack of proliferation. Source data
Extended Data Fig. 2
Extended Data Fig. 2. Optimized nucleofection allows RNP delivery into virtually every resting CD4+ T cell and results in efficient KO of single genes.
a, RNPs were generated by mixing crispr RNA (crRNA) together with a fluorescently labeled tracrRNA (Atto550; IDT) in an equimolar ratio and incubation at 95 °C for 5 min. The temperature was then decreased slowly to reach room temperature (around 1 hour). Next, the gRNA complex was mixed together with CAS9 for 15 min at room temperature, at molar ratios of 1:2.5 (Cas9:gRNA). Cells were mixed with the RNP complex and nucleofected in P3 buffer using either nucleofection program EH100 or EO115 (the latter suggested by the manufacturer). 24 h after nucleofection, the positivity for the fluorescent Atto5 label was analyzed by flow cytometry on a BD LSRFortessa. Cells mixed with the RNP fluorescent complex, but not nucleofected, served as control. FACS plots of one out of two experiments is shown. b,c Resting CD4+ T cells were nucleofected with RNPs specific for CD46 using either gRNA1, gRNA2, gRNA3 or a combination of gRNA1 + 2. One week later, cells were collected and lysed. A PCR specific for the CD46 locus was performed. The product was either analyzed by deep sequencing on an Illumina Miseq (b) or separated on an agarose gel (c). One experiment is shown (n = 2). d, Qualitative evaluation of the different gene KOs in resting CD4+ T cells by immunostaining and confocal microscopy two weeks after nucleofection. One representative donor each out of three is shown. Scale bars: 20 µm.
Extended Data Fig. 3
Extended Data Fig. 3. PSGL-1 KO in resting CD4+ T cells.
Cells were nucleofected with RNPs specific for PSGL-1/SELPLG using either gRNA1, gRNA2, gRNA3 or a combination of gRNA2 + 3. One week after nucleofection, cells were collected and lysed. A PCR specific for the PSGL-1 locus was performed and analyzed by TIDE analysis (a) or Illumina Miseq (b). c, Analysis of the indel size distribution from the PSGL-1 KO generated with gRNA3 in the PSGL-1 locus. d, Sequence alignment of the different indels found in c. e-f, Analysis of the indels (e) and their size distribution (f) from the PSGL-1 KO generated with gRNA2 + 3 in the PSGL-1 locus. One representative experiment is shown (n = 3). Outknocker (http://www.outknocker.org/) was used for sequence analysis. g, PSGL-1 surface expression two weeks after nucleofection of the indicated gRNAs. Density plots of flow cytometric analysis of viable, resting (CD25/CD69) CD4+ T cells of one representative experiment are shown (n = 3). h, Resting CD4+ T cells were nucleofected with PSGL-1-targeting gRNA2+ 3. Subsequently, T cells were either cultivated in IL-7/IL-15 (both 2 ng/ml) or activated using anti-CD3/CD28 mAb and IL-2 (50 IU/ml), or maintained untreated. Interleukins were refreshed twice a week. Two weeks later, PSGL-1 expression was analyzed by flow cytometry. Means ± s.e.m. are shown (n = 3). Statistics indicate significance by two-ways ANOVA. P-values were corrected for multiple comparison (Tukey)(***P ≤ 0.001). Source data
Extended Data Fig. 4
Extended Data Fig. 4. Characterization of different KOs in resting CD4+ T cells.
a, Evaluation of KO efficiency in polyclonal resting CD4+ T cells of single gRNAs for genes studied in functional assays. Cells were nucleofected with RNPs specific for the indicated genes, and the KO efficiency was evaluated by Illumina Miseq one week after nucleofection. Representative examples for each gRNA are shown. Together with TIDE analysis, this method was used to validate individual gRNAs. Depending on their efficiency, a combination of the two most potent gRNAs was used to obtain >95% KO efficiency, unless indicated otherwise. b, SAMHD1 decay in RNP-nucleofected cultivated for up to 6 weeks. Cells were nucleofected with either SAMHD1-gRNA2 + 3 or NTC and cultivated for the indicated period of time. Shown are immunoblots for either SAMHD1 or vinculin (loading control). One representative experiment is shown (n = 4).
Extended Data Fig. 5
Extended Data Fig. 5. Schematic of T cell migration assay.
Culture medium with or without supplementation with the natural CXCR4 ligand SDF-1-α was placed in the bottom chamber of a trans-well and CD4+ T cells (WT or CXCR4 KO) were added into the top chamber. After three hours, the absolute number of cells in the bottom chamber was quantified by flow cytometry using BD Trucount™ Tubes (schematic created with BioRender.com).
Extended Data Fig. 6
Extended Data Fig. 6. Principles of X4 HIV-1 fusion and infection assays in resting CD4+ T cells.
Two different types of conditions for HIV-1 challenge were used depending on the scientific question, that is the target protein of interest and the step of the HIV replication cycle under investigation. a, First, to characterize the effect of KOs of either host dependency factors (CXCR4, CD4) or restriction factors (PSGL-1) for HIV binding and entry, we employed the well-established HIV fusion assay without spinoculation. Here, cells were exposed to the X4 HIV-1 BlaM-Vpr inoculum for 4 hours at 37 °C. Cells with either CXCR4 KO or nucleofected with NTC-gRNA were used. Representative dot plots of the flow cytometric detection of the CCF2 substrate cleavage by BlaM in viable cells after virion fusion are shown. As specificity controls, cells were pretreated with either the HIV-1 fusion inhibitor T20 or an anti-CD4 mAb. One representative experiment is shown (n = 7). b, Second, to characterize the role of potential cellular restriction factors (SAMHD1, MX2) or host dependency factors (CPSF6) at post-entry steps of the replication cycle (for example at reverse transcription, nuclear import, integration) we sought to efficiently overcome the natural restriction at virion entry and allow a high-level of virus delivery (see Fig. 3 and Fig. 5). In this context, we applied spinoculation at 650 g for 150 min at 37 °C. To prove that this is optimal for high-level virion delivery into resting CD4+ T cells, we performed a quantitative HIV-1 fusion assay. This spinoculation condition allowed X4 HIV-1 to enter into virtually every resting CD4+ T cell that expresses the co-receptor CXCR4, that is typically around 95% of the cell population. As specificity control, the small molecule inhibitor AMD3100, which blocks CXCR4-dependent HIV-1 fusion, was used. Means ± s.e.m. are shown (n = 4). Source data
Extended Data Fig. 7
Extended Data Fig. 7. Time- and Vpx-dependent impact of SAMHD1 KO on HIV-1 infection in resting CD4+ T cells.
SAMHD1 KO cells or NTC-nucleofected reference cells were challenged at the indicated weeks after nucleofection with either HIV-1* GFP without Vpx (left panel) or with Vpx (+ Vpx, right panel) and analyzed for GFP expression on day 3 by flow cytometry. Means ± s.e.m. are shown (n = 4-5). Statistics indicate significance by two-tailed paired t-test. (2 weeks, **P = 0.0035; 4 weeks, *P = 0.0294; 6 weeks*P = 0.0496). Source data
Extended Data Fig. 8
Extended Data Fig. 8. ssDNA as donor template improves cell viability, but reduces KI efficiency.
a, KI CD4+ T cell cultures from Fig. 4b were lysed and a PCR specific for the eGFP integration into the SAMHD1 locus was performed. Untreated WT cells served as reference. A PCR specific for the CD46 locus was used as loading control (lower panel). b, GFP expression following KI (see also schematic in Fig. 4a). Density plots of flow cytometry analysis of viability (FSC/SSC, upper part) and GFP expression of resting CD4+ T cells two weeks after nucleofection. Cells were either left untreated (WT) or nucleofected with the indicated SAMHD1-gRNA2, dsDNA, ssDNA sense or ssDNA antisense templates alone or in combination. One µg of DNA template was used for each condition. One representative experiment is shown (n = 2).
Extended Data Fig. 9
Extended Data Fig. 9. The GFP-SAMHD1 fusion protein, expressed from the SAMHD1 locus, can be degraded by the lentiviral Vpx protein.
Monoclonal SAMHD1 KO cells were generated in human glioblastoma cell line LN18. Next, SAMHD1 KO LN18 cells were stably transfected with linearized plasmids encoding for either GFP-SAMHD1 or SAMHD1-GFP. GFP-positive cells were sorted by flow cytometry 4 weeks after transfection. To deliver Vpx into cells, WT LN18 and SAMHD1 KO cells expressing either GFP-SAMHD1 or SAMHD1-GFP were challenged with VSV- G pseudotyped virus like particles (VLPs) with incorporated lentiviral Vpx (Vpx-VLPs). Empty VLPs (Ø) or VLPs with incorporated Vpr (Vpr-VLPs) were used as negative controls. After VLP treatment, cells were collected and SAMHD1 immunoblots performed. Vinculin served as loading control. Endogenous SAMHD1 in WT cells and stably expressed GFP-SAMHD1 were degraded by Vpx. In contrast, SAMHD1-GFP was protected from Vpx degradation likely due to steric hindrance. Experiment performed only one time.
Extended Data Fig. 10
Extended Data Fig. 10. Efficiency of the GFP-SAMHD1 KI approach in resting CD4+ T cells.
Density plots of flow cytometric analyses of viability (FSC/SSC, upper panels) and GFP expression (lower panels) of nucleofected cells two weeks after nucleofection and prior to sorting (see also Fig. 5e). WT cells served as reference. Data from two independent donors are shown.

Comment in

  • Editing naive CD4+ T cells.
    Papadopoulos AO, Ndhlovu ZM. Papadopoulos AO, et al. Nat Methods. 2022 Jan;19(1):36-37. doi: 10.1038/s41592-021-01332-y. Nat Methods. 2022. PMID: 34949808 No abstract available.

References

    1. Pan X, Baldauf HM, Keppler OT, Fackler OT. Restrictions to HIV-1 replication in resting CD4+ T lymphocytes. Cell Res. 2013;23:876–885. doi: 10.1038/cr.2013.74. - DOI - PMC - PubMed
    1. Berger, A. et al. SAMHD1-deficient CD14+ cells from individuals with Aicardi–Goutières syndrome are highly susceptible to HIV-1 infection. PLoS Pathog. 10.1371/journal.ppat.1002425 (2011). - PMC - PubMed
    1. Baldauf HM, et al. SAMHD1 restricts HIV-1 infection in resting CD4+ T cells. Nat. Med. 2012;18:1682–1687. doi: 10.1038/nm.2964. - DOI - PMC - PubMed
    1. Descours, B. et al. SAMHD1 restricts HIV-1 reverse transcription in quiescent CD4+ T-cells. Retrovirology10.1186/1742-4690-9-87 (2012). - PMC - PubMed
    1. Hrecka K, et al. Vpx relieves inhibition of HIV-1 infection of macrophages mediated by the SAMHD1 protein. Nature. 2011;474:658–661. doi: 10.1038/nature10195. - DOI - PMC - PubMed

Publication types

MeSH terms

Substances