. 2022 Jan;19(1):119-128.
doi: 10.1038/s41592-021-01330-0. Epub 2021 Dec 23.

FlyWire: online community for whole-brain connectomics

Affiliations

FlyWire: online community for whole-brain connectomics

Sven Dorkenwald et al. Nat Methods. 2022 Jan.

Abstract

Due to advances in automated image acquisition and analysis, whole-brain connectomes with 100,000 or more neurons are on the horizon. Proofreading of whole-brain automated reconstructions will require many person-years of effort, due to the huge volumes of data involved. Here we present FlyWire, an online community for proofreading neural circuits in a Drosophila melanogaster brain and explain how its computational and social structures are organized to scale up to whole-brain connectomics. Browser-based three-dimensional interactive segmentation by collaborative editing of a spatially chunked supervoxel graph makes it possible to distribute proofreading to individuals located virtually anywhere in the world. Information in the edit history is programmatically accessible for a variety of uses such as estimating proofreading accuracy or building incentive systems. An open community accelerates proofreading by recruiting more participants and accelerates scientific discovery by requiring information sharing. We demonstrate how FlyWire enables circuit analysis by reconstructing and analyzing the connectome of mechanosensory neurons.


Conflict of interest statement

Competing interests

TM and HSS are owners of Zetta AI LLC, which provides neural circuit reconstruction services for research labs. RL and NK are employees of Zetta AI LLC.

Figures

Extended Data Fig. 1:
Extended Data Fig. 1:. Full brain rendering and comparison with the hemibrain.
(a, b) A neuropil rendering of the fly brain (white) is overlaid with a rendering of the hemibrain and proofread reconstructions of neurons from the antennal mechanosensory and motor center (AMMC). The proofread reconstructions of (a) the AMMC-A2 neuron from the right hemisphere and (b) an WV-WV neuron are added. Scale bar: 50 μm
Extended Data Fig. 2:
Extended Data Fig. 2:. Quality of EM image alignment.
(a, b) Chunked pearson correlation (CPC) between two neighboring sections in the original alignment (v14) and our re-aligned data (v14.1). (a) Relative change of CPC between the original and our re-aligned data per section. (b) Histogram of the CPC improvements from (a) (dashed red line is at 0). (c, d, e) Example images used for the CPC calculation in (a) where (c) the CPC improved through a better alignment around an artifact, (d) the CPC is almost identical and (e) the CPC overall improved due to a stretch of poorly aligned sections in the original data that were resolved in v14.1.
Extended Data Fig. 3:
Extended Data Fig. 3:. Chunking the dataset.
(a) Automated segmentation overlayed on the EM data. Each different color represents an individual putative neuron. (b) The underlying supervoxel data is chunked (white dotted lines) such that each supervoxel is fully contained in one chunk. (c) A close up view of the box in (b). (d) Application of the same chunking scheme to the meshes, requiring only minimal mesh recomputations after edits. (e) Diversity of the number of supervoxels in each chunk (median: 25661). (f) The median supervoxel contains 792 voxels. All very small supervoxels (< 200 voxels) are the result of chunking.
Extended Data Fig. 4:
Extended Data Fig. 4:. Proofreading with the ChunkedGraph.
(a,)In the ChunkedGraph connected component information is stored in an octree structure where each abstract node (black nodes in levels >1) represents the connected component in the spatially underlying graph (dashed lines represent chunk boundaries). Nodes on the highest layer represent entire neuronal components. (b) Edits in the ChunkedGraph (here, a merge; indicated by the red arrow and added red edge) affect the supervoxel graph to recompute the neuronal connected components. (c) The same neuron shown in Fig 2 after proofreading with each merged component shown in a different color. Scale bar (c): 10 μm
Extended Data Fig. 5:
Extended Data Fig. 5:. The FlyWire proofreading platform.
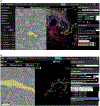
(a) The most common view in FlyWire displays four panels: a bar with links and a leaderboard of top proofreaders (left), the EM image in grayscale overlaid with segmentation in color (second panel from left), a 3D view of selected cell segments (third panel), and menus with multiple tools (right). (b) Annotation tools include points, which can be used for a variety of purposes such as marking particular cells or synapses.
Extended Data Fig. 6:
Extended Data Fig. 6:. Fast proofreading in FlyWire.
Analysis of 60 neurons included in the triple proofreading analysis and fast proofreading analysis. (a) Comparison of the F1-Scores (0–1, higher is better; with respect to proofreading results after three rounds) between different proofreading rounds according to volumetric completeness (medians: Auto: 0.777, 1: 0.992, 2: 0.999, Fast: 0.988 means: Auto: 0.729, 1: 0.975, 2: 0.992, Fast: 0.968) and (b) assigned synapses (medians: Auto: 0.799, 1: 0.992, 2: 0.999, Fast: 0.988, means: Auto: 0.746, 1: 0.958, 2: 0.986, Fast: 0.945). “Auto” refers to reconstructions without proofreading. Boxes are interquartile ranges (IQR), whiskers are set at 1.5 x IQR.
Extended Data Fig. 7:
Extended Data Fig. 7:. NBLAST based analysis of segmentation accuracy.
Comparison of NBLAST matches and scores of 183 neurons before and after proofreading to assess the quality of the automated segmentation. (a) NBLAST scores of all 183 triple-proofread neurons (Fig 5) against 16129 neurons in FlyCircuit. For each neuron in FlyWire we found the best hit in FlyCircuit according to the mean of the two NBLAST scores. (b) scores for the best matches labeled by manual labels of match vs. no match (N(match)=174 out of 183). (c) mean scores of the FlyWire neurons with matches before and after proofreading (N=174 neurons). (d) Histogram of the change in NBLAST score before and after proofreading. (e) Rankings of each FlyCircuit neuron matched to a triple proofread neuron in FlyWire among the 16129 neurons before proofreading and after one round of proofreading. (f) NBLAST scores of the unproofread segments grouped by whether they matched or did not match the broad cell type after proofreading.
Extended Data Fig. 8:
Extended Data Fig. 8:. Renderings of AMMC-B1 subtypes
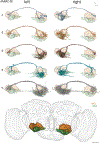
Neurons grouped by subtype and hemisphere. AMMC, WED brain regions are shown for reference. The neuropil mesh is shown to the same scale. Scale bar: 50 μm
Extended Data Fig. 9:
Extended Data Fig. 9:. Connectivity diagrams.
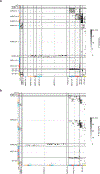
(a) Diagram from Figure 6b reordered by putative subtype (b) Same diagram as in Figure 6b with different colormap threshold.
Figure 1.
Figure 1.. Assessing segmentation quality using known neurons.
(a-d) Comparison of light microscopy-level stains of giant fiber neurons (a) and a mushroom body APL neuron (b, red) to FlyWire’s AI-predicted segmentation of these cells (c,d). Arrows in (c) point at falsely merged pieces in the automated segmentation. (e,f) The same neurons shown following proofreading. (g-n) Examples of other cell types before and after proofreading (top and bottom of each image pair, respectively): central complex neurons (g,h), olfactory projection neurons (i,j), gustatory receptor neurons (k,l) and a lobula plate tangential cell (m,n). All views frontal except APL and central complex neurons: dorso-frontal view. Scale bars: (c, d, e, f, i, j) 30 μm; (g, h, k, l) 15 μm; (m, n) 20 μm.
Figure 2.
Figure 2.. Proofreading the supervoxel graph.
(a) Automated segmentation overlaid on the EM data. Each color represents an individual putative cell. (b) Different colors represent the supervoxels that make up the putative cells. (c) Supervoxels belonging to a particular neuron, with an overlaid cartoon of its supervoxel graph. This panel corresponds to the framed square in (a) and the full panel in (b). (d) Touching supervoxels (circles) may be connected through edges in the graph indicating that they belong to the same connected component (solid lines). Merge operations add edges between supervoxels resulting in new neuronal components (orange). (e) Split operations remove edges resulting in new neuronal components (blue, purple). (f) Example neuron after proofreading (black). Green, blue and red components were removed during proofreading. While edit operations have global effects, the edits to the supervoxel graph themselves are performed at a local level. (g) For splits, users place points (red and blue dots) either in 2D (left) or 3D (center panel) that are linked to the underlying supervoxels (left panel). The proofreading backend then automatically determines which edges need to be removed and performs the split (right panel). The panels are screenshots from FlyWire’s neuroglancer. The colored lines represent coordinate axes: red (x), green (y), blue (z). (h) For the operation shown in (g) the backend performs max-flow min-cut on the local supervoxel graph to determine the optimal cut that separates the user-defined input locations (blue and purple framed circles). The thickness of the edges symbolizes the edge weight (cartoon). Scale bars (a,b,c): 1μm; (f): 10 μm
Figure 3.
Figure 3.. The ChunkedGraph approach for proofreading supervoxel graphs.
(a) One-dimensional representation of the supervoxels graph. In the simplest approach (naive), connected component information (neuronal component) is stored in a dedicated parent node. (b) In an alternative data structure connected component information is stored in an octree structure where each abstract node (black nodes in levels > 1) represents the connected component in the spatially underlying graph (dashed lines represent chunk boundaries). Nodes on the highest layer represent entire neuronal components. (c) Illustration of how edits to the ChunkedGraph (here, a split; indicated by the red arrow and removed red edge) affect the supervoxel graph to recompute the neuronal connected components. (d) Chunk size (represented by the grid) along each dimension in different layers. (e) Server response times for the remapping of the connected components from root to supervoxel (N=3,080,494) and supervoxel to root (N=12,096) (f) as well as splits (N=2,497) and merges (N=4,612) for real user interactions in the beta-phase of FlyWire. (g) Number of supervoxels that need to be loaded for a split (global vs local) (h, i) Reading speed (h) and speed of max-flow min-cut calculations (i) for the ChunkedGraph and a naïve approach. The red lines in (g, h, i) are mean and the shaded area standard deviation of bins along x-axis (10 bins); N=15,233 split operations. N in (e, f) are the number of observed requests to the server.
Figure 4.
Figure 4.. Attaching automatically detected synapses to neurons.
(a) Each edit (black dot) is linked to a user and timestamp enabling the retrieval of the edit history and credit assignment post-hoc. (b, c) Classification of pre- (b) and post-synaptic (c) segments based on their morphology and whether they are attached to a bigger component that will be attached during a conservative procedure. (d) Examples of these assessments. (e) AMMC-A2 neuron (left) with automatically detected synapses displayed as balls (blue: presynaptic (N=5140), red: postsynaptic (N=1669), balls overlap). Scale bar: (d): 1 μm; (e) 50 μm, (e, inset): 10 μm
Figure 5.
Figure 5.. Proofreading in FlyWire.
Analysis of 183 triple-proofread neurons (a) Number of edits per neuron and proofreading round (medians: 1: 18, 2: 7, 3: 9, means: 1: 36.5, 2: 18.0, 3: 25.7). (b) Number of edits per neuron and proofreading round restricted to large edits (> 1μm3, medians: 1: 7, 2: 1, 3: 0, means: 1: 10.9, 2: 2.5, 3: 2.6). (c, d) F1-Scores (0–1, higher is better; with respect to proofreading results after three rounds) between different proofreading rounds according to volumetric completeness (c) (medians: Auto: 0.730, 1: 0.989, 2: 0.999, means: Auto: 0.665, 1: 0.968, 2: 0.984) and assigned synapses (d) (medians: Auto: 0.724, 1: 0.988, 2: 0.998, means: Auto: 0.642, 1: 0.942, 2: 0.970). “Auto” refers to reconstructions without proofreading. Boxes are interquartile ranges (IQR), whiskers are set at 1.5 x IQR.
Figure 6.
Figure 6.. Connectivity between mechanosensory neurons extracted with FlyWire.
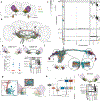
(a) Analysis of 178 neurons innervating three mechanosensory areas in both hemispheres - the AMMC (green) receives direct unilateral input from mechanoreceptor neurons in the JO (Johnston’s Organ) of the antenna, (b) Neurons colored by their cell type (see x and y axes of (c) for color mappings of individual cell types). (c) Connectivity diagram between all 178 neurons ordered by cell type. Gray through lines divide cells from different hemispheres (left/top: left hemisphere, right/bottom: right hemisphere) and colored bars separate putative cell types within each cell class. (d) WED-VLP type 1 and 2 neurons, separated based on differential inputs from ipsilateral AMMC-A2 neurons. (e) AMMC-B1 neurons, grouped according to their outputs on to other cell types, and their connectivity matrix. (f) Axonal arbors of AMMC-B1 and WED-VLP subtypes in both hemispheres (insets). Arrows point to differences in arborization. (g) A single AMMC-B1–4 neuron targeting a single AMMC-A1 neuron (red: AMMC-A1, turquoise: AMMC-B1–4). We found 66 automatically detected synapses from this AMMC-B1–4 neuron onto this AMMC-A1 neuron (black balls). An example synapse is shown in the EM inset with the arrow pointing at the T-bar. (h) Connectivity diagram for mechanosensory neurons. Cell types are placed in their primary input region. (i) Unpaired medial neuron types with bilateral innervation called WV-WV, separated by their connectivity with AMMC-B1 and AMMCA1 neurons, and their connectivity matrix. Scale bars: 50 μm, insets in (f), (g): 10 μm, EM inset in (g): 500 nm

References

    1. Ahrens MB, Orger MB, Robson DN, Li JM & Keller PJ Whole-brain functional imaging at cellular resolution using light-sheet microscopy. Nat. Methods 10, 413–420 (2013) doi:10.1038/nmeth.2434. - DOI - PubMed
    1. White JG, Southgate E, Thomson JN & Brenner S The structure of the nervous system of the nematode Caenorhabditis elegans. Philos. Trans. R. Soc. Lond. B Biol. Sci. 314, 1–340 (1986) doi:10.1098/rstb.1986.0056. - DOI - PubMed
    1. Cook SJ et al. Whole-animal connectomes of both Caenorhabditis elegans sexes. Nature 571, 63–71 (2019) doi:10.1038/s41586-019-1352-7. - DOI - PMC - PubMed
    1. Scheffer LK et al. A connectome and analysis of the adult Drosophila central brain. Elife 9, (2020) doi:10.7554/eLife.57443. - DOI - PMC - PubMed
    1. Coen P et al. Dynamic sensory cues shape song structure in Drosophila. Nature 507, 233–237 (2014) doi:10.1038/nature13131. - DOI - PubMed

Publication types

LinkOut - more resources