. 2022 Jan;19(1):41-50.
doi: 10.1038/s41592-021-01336-8. Epub 2021 Dec 23.

Benchmarking atlas-level data integration in single-cell genomics

Affiliations

Benchmarking atlas-level data integration in single-cell genomics

Malte D Luecken et al. Nat Methods. 2022 Jan.

Abstract

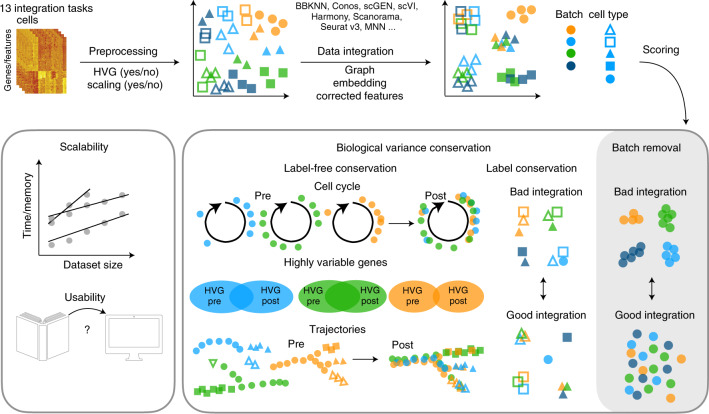
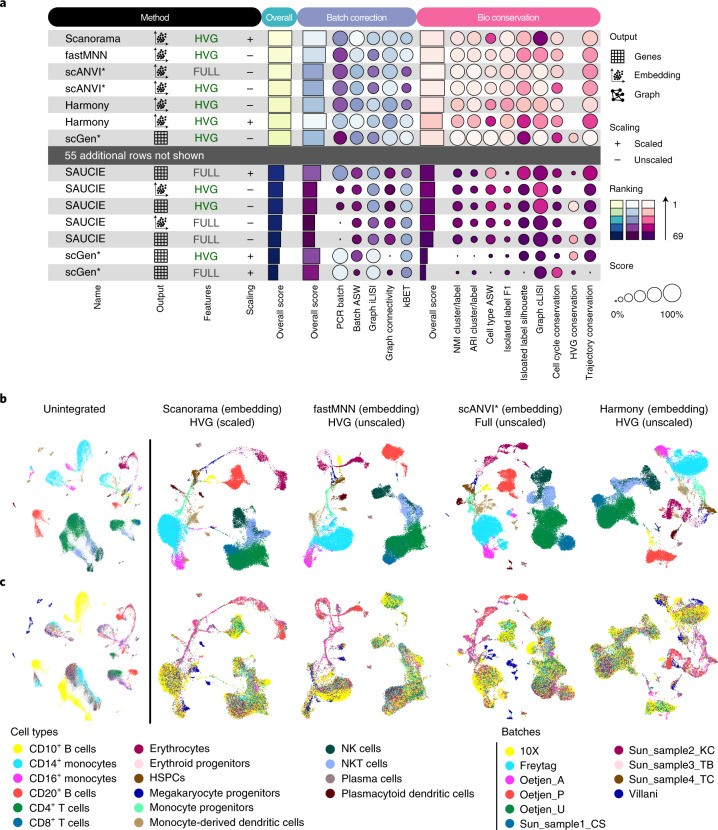
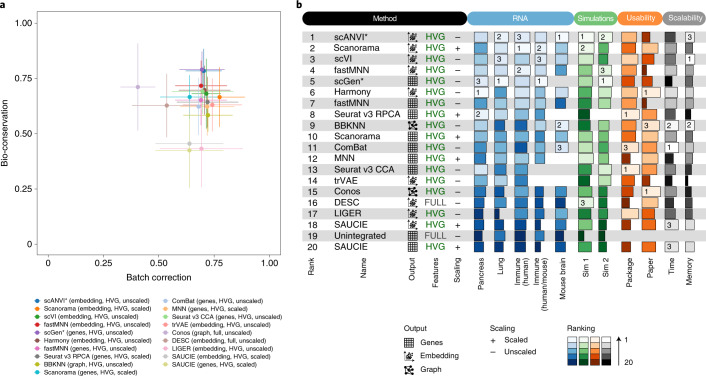
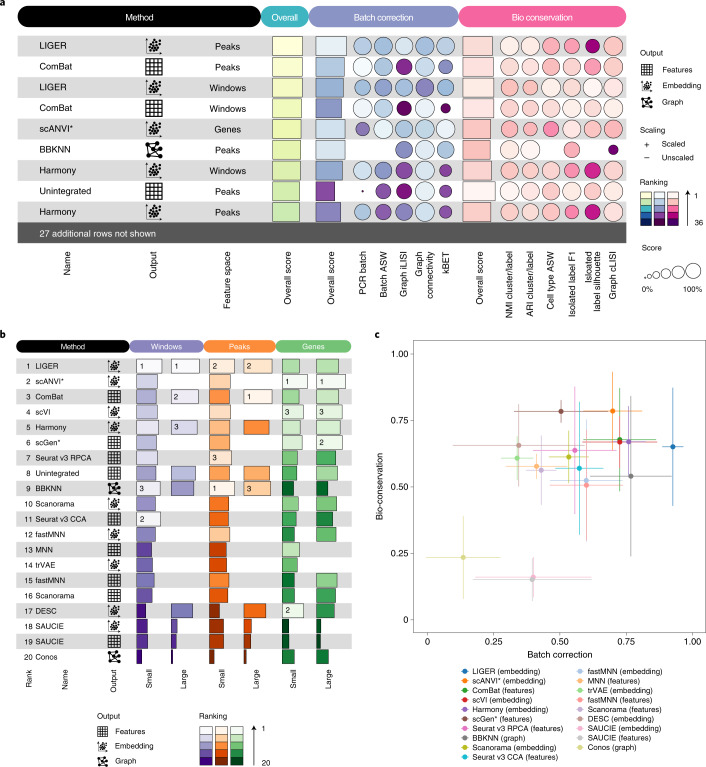
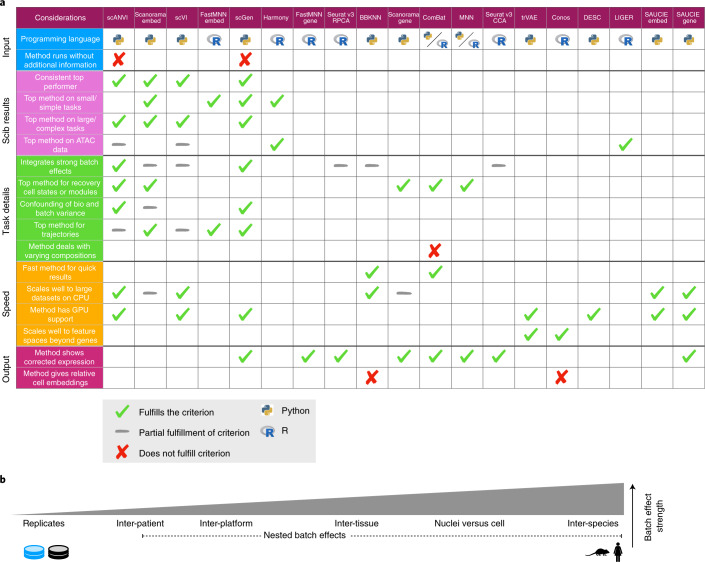
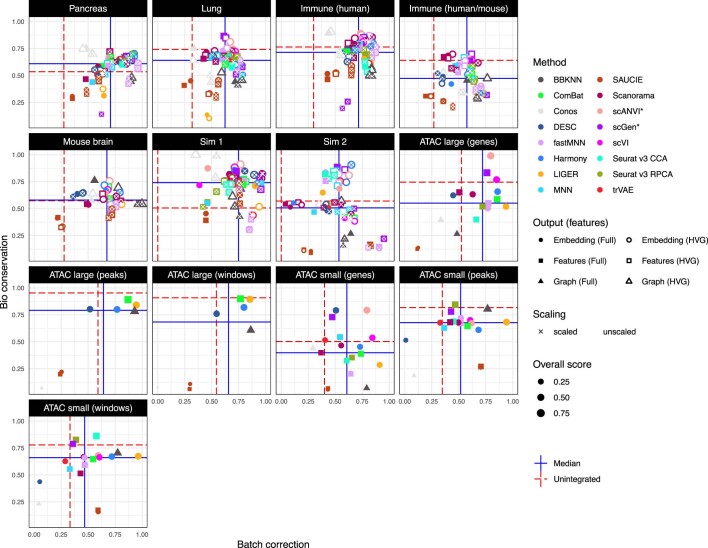
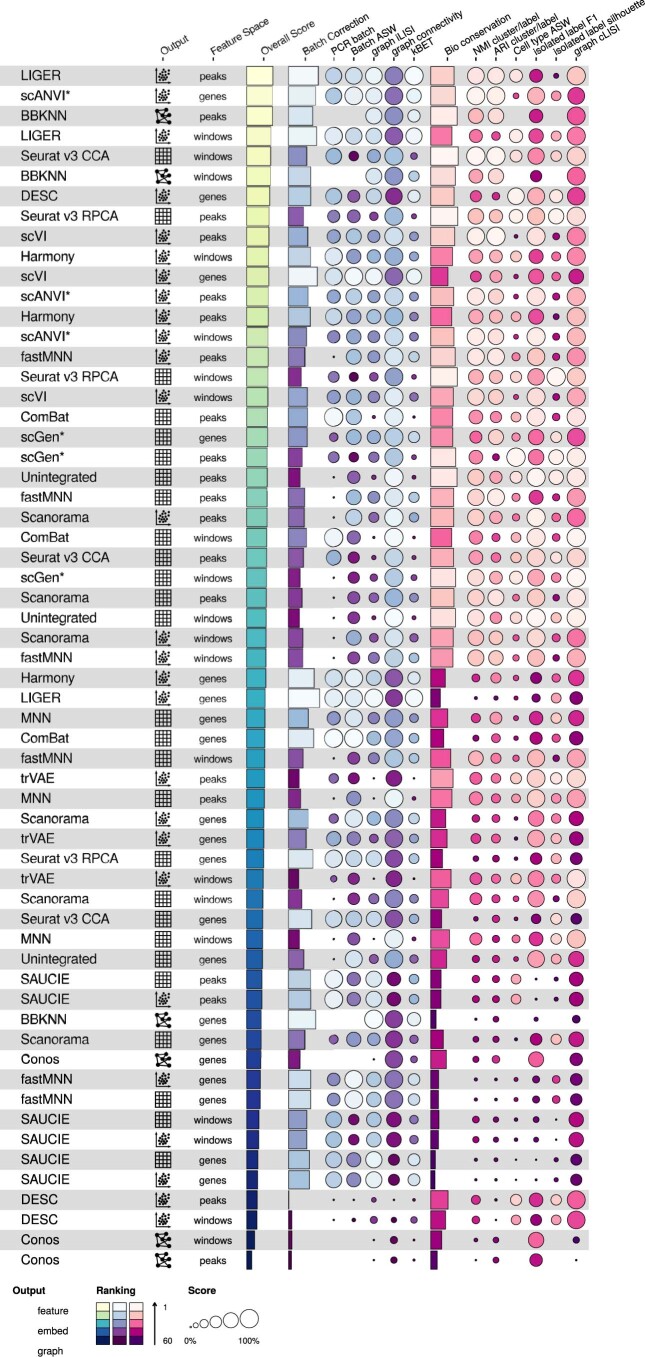
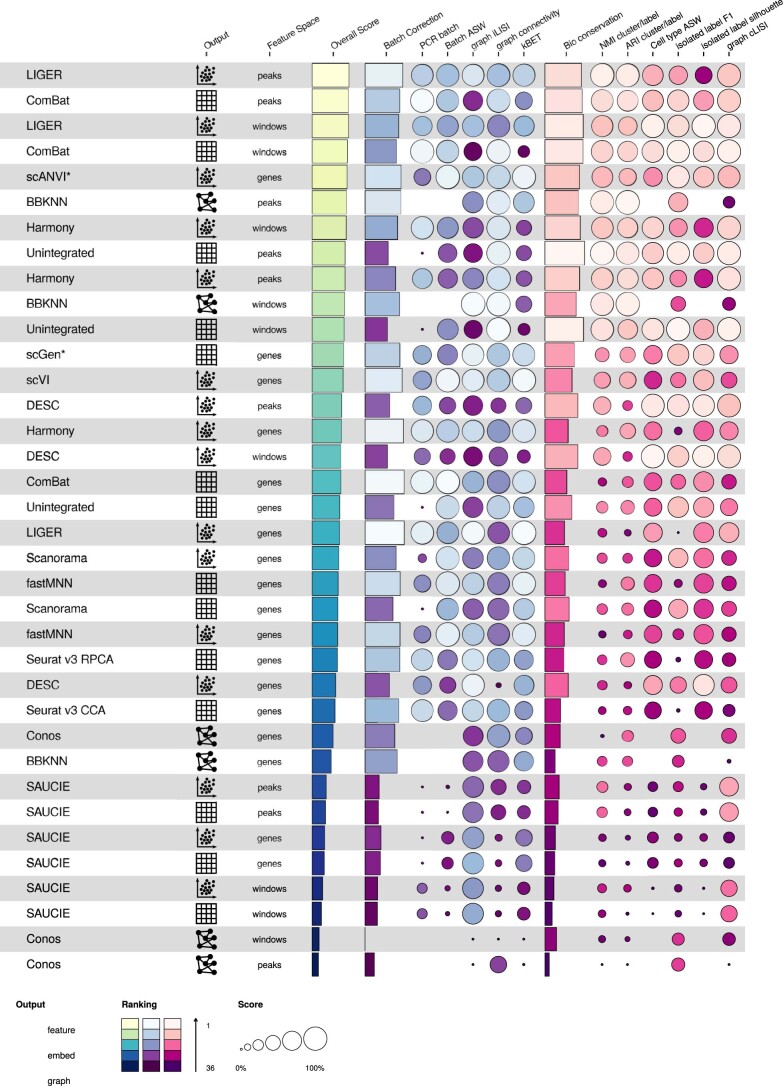
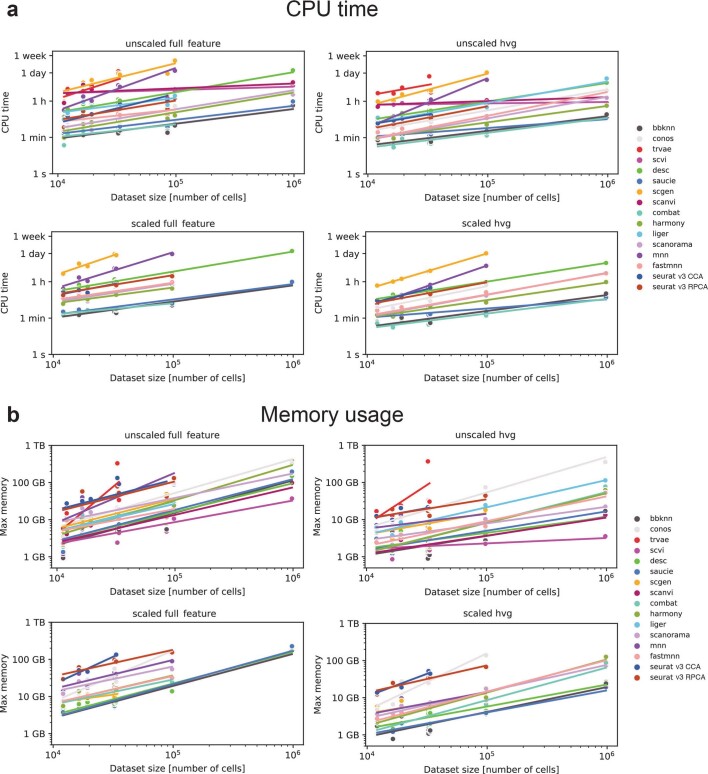
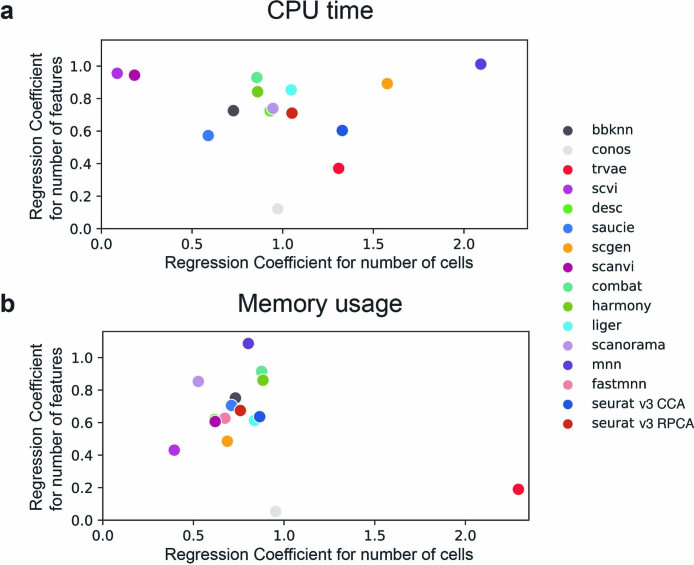
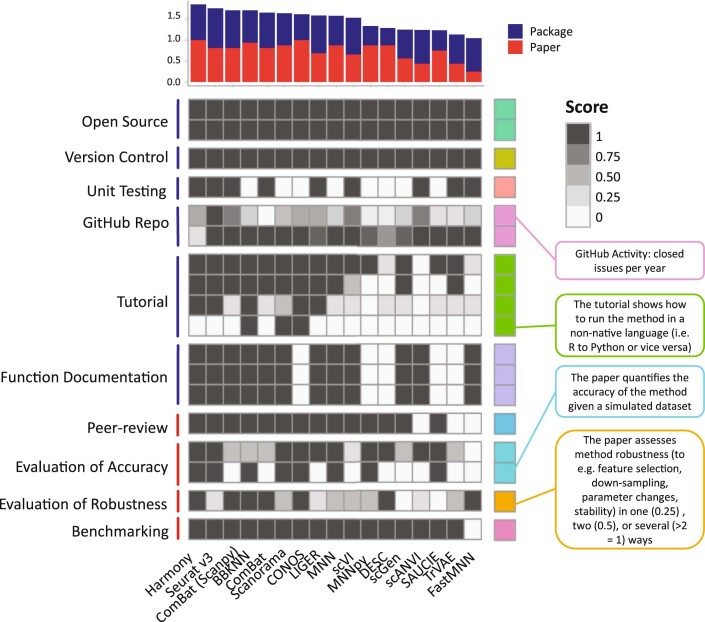
Single-cell atlases often include samples that span locations, laboratories and conditions, leading to complex, nested batch effects in data. Thus, joint analysis of atlas datasets requires reliable data integration. To guide integration method choice, we benchmarked 68 method and preprocessing combinations on 85 batches of gene expression, chromatin accessibility and simulation data from 23 publications, altogether representing >1.2 million cells distributed in 13 atlas-level integration tasks. We evaluated methods according to scalability, usability and their ability to remove batch effects while retaining biological variation using 14 evaluation metrics. We show that highly variable gene selection improves the performance of data integration methods, whereas scaling pushes methods to prioritize batch removal over conservation of biological variation. Overall, scANVI, Scanorama, scVI and scGen perform well, particularly on complex integration tasks, while single-cell ATAC-sequencing integration performance is strongly affected by choice of feature space. Our freely available Python module and benchmarking pipeline can identify optimal data integration methods for new data, benchmark new methods and improve method development.


Conflict of interest statement

F.J.T. reports receiving consulting fees from Immunai and ownership interest in Dermagnostix GmbH and Cellarity. The remaining authors declare no competing interests.

Figures

Fig. 1
Fig. 1. Design of single-cell integration benchmarking (scIB).
Schematic diagram of the benchmarking workflow. Here, 16 data integration methods with four preprocessing decisions are tested on 13 integration tasks. Integration results are evaluated using 14 metrics that assess batch removal, conservation of biological variance from cell identity labels (label conservation) and conservation of biological variance beyond labels (label-free conservation). The scalability and usability of the methods are also evaluated.
Fig. 2
Fig. 2. Benchmarking results for the human immune cell task.
a, Overview of top and bottom ranked methods by overall score for the human immune cell task. Metrics are divided into batch correction (blue) and bio-conservation (pink) categories. Overall scores are computed using a 40/60 weighted mean of these category scores (see Methods for further visualization details and Supplementary Fig. 2 for the full plot). b,c, Visualization of the four best performers on the human immune cell integration task colored by cell identity (b) and batch annotation (c). The plots show uniform manifold approximation and projection layouts for the unintegrated data (left) and the top four performers (right).
Fig. 3
Fig. 3. Overview of benchmarking results on all RNA integration tasks and simulations, including usability and scalability results.
a, Scatter plot of the mean overall batch correction score against mean overall bio-conservation score for the selected methods on RNA tasks. Error bars indicate the standard error across tasks on which the methods ran. b, The overall scores for the best performing method, preprocessing and output combinations on each task as well as their usability and scalability. Methods that failed to run for a particular task were assigned the unintegrated ranking for that task. An asterisk after the method name (scANVI and scGen) indicates that, in addition, cell identity information was passed to this method. For ComBat and MNN, usability and scalability scores corresponding to the Python implementation of the methods are reported (Scanpy and mnnpy, respectively).
Fig. 4
Fig. 4. Benchmarking results for mouse brain ATAC tasks.
a, Overview of top ranked methods by overall score for the combined large ATAC tasks. Metrics are divided into batch correction (blue) and bio-conservation (pink) categories. Overall scores are computed using a 40:60 weighted mean of these category scores (see Extended Data Fig. 5 for the full plot). b, The overall scores for the best performing methods on each task. Methods that failed to run for a particular task were assigned the unintegrated ranking for that task. Methods ranking below unintegrated are not suitable for integrating ATAC batches. c, Scatter plot summarizing integration performance on all ATAC tasks. The x axis shows the overall batch correction score and the y axis shows the overall bio-conservation score. Each point is an average value per method with the error bars indicating a standard deviation. All methods are indicated by different colors.
Fig. 5
Fig. 5. Guidelines to choose an integration method.
a, Table of criteria to consider when choosing an integration method, and which methods fulfill each criterion. Ticks show which methods fulfill each criterion and gray dashes indicate partial fulfillment. When more than half of the methods fulfill a criterion, we instead highlight the methods that do not by a cross; hence blank spaces denote a cross except in the three rows with labeled crosses. Method outputs are ordered by their overall rank on RNA tasks. Python and R symbols indicate the primary language in which the method is programmed and used. Considerations are divided into the five broad categories (input, scIB results, task details, speed and output), which cover usability (input, output), scalability (speed) and expected performance (scIB results, task details). If not otherwise specified, criteria relate to RNA results. As a dataset specific alternative, method selection can be guided by running the scIB pipeline to test all methods on a user-provided dataset. b, Schematic of the relative strength of batch effect contributors in our study.
Extended Data Fig. 1
Extended Data Fig. 1. Trajectories of the best and worst performers on the immune cell human integration task ordered by overall score on the set of cells belonging to the erythrocyte lineage.
UMAP plots for the unintegrated data (left), the top 4 performers (upper rows a, b and c), and the worst 4 performers (lower rows a and b). Plots are colored by (a) diffusion pseudotime, (b) batch labels, and (c) cell identity annotations.
Extended Data Fig. 2
Extended Data Fig. 2. Diffusion maps of diffusion pseudotime (dpt) trajectories on integrated immune cell human data of the best and worst performers ordered by overall score.
Diffusion maps of erythrocyte lineage cells of the 4 best (upper rows a, b and c) and 4 worst (lower rows a, b and c) integration methods, ordered by the overall score. Plots are colored by (a) diffusion pseudotime, (b) batch labels, and (c) cell identity annotations. In cases where it wasn’t possible to compute a trajectory due to disconnected clusters, all cells are colored yellow in (a).
Extended Data Fig. 3
Extended Data Fig. 3. Diffusion maps of diffusion pseudotime (dpt) trajectories on integrated immune cell human data of the best and worst performers ordered by trajectory score.
Diffusion maps of erythrocyte lineage cells of the 4 best (upper row a, b and c) and 4 worst (lower row a, b and c) integration methods, ordered by the overall score. Plots are colored by (a) diffusion pseudotime, (b) batch labels, and (c) cell identity annotations. In cases where it wasn’t possible to compute a trajectory due to disconnected clusters, all cells are colored yellow in (a).
Extended Data Fig. 4
Extended Data Fig. 4. Scatter plots summarizing integration performance on all tasks.
Overall batch correction score (x-axis) versus overall bio-conservation score (y-axis). Each point is an individual integration run. Point color indicates method, size the overall score and shape the output type (embedding, features, graph). Filled points use the full feature set while unfilled points use selected highly variable genes. Points marked with a cross use scaled features. Horizontal and vertical lines indicate reference points. Red dashed lines show performance calculated on the unintegrated dataset and solid blue lines the median performance across methods for each dataset.
Extended Data Fig. 5
Extended Data Fig. 5. Benchmarking results for all small mouse brain tasks for all feature spaces based on scATAC-seq.
Metrics are divided into batch correction (blue, purple) and bio conservation (pink) categories (see Methods for further visualization details). Overall scores are computed by a 40:60 weighted mean of these category scores. Methods that failed to run are omitted.
Extended Data Fig. 6
Extended Data Fig. 6. Benchmarking results for all large mouse brain tasks for all feature spaces based on scATAC-seq.
Metrics are divided into batch correction (blue, purple) and bio conservation (pink) categories (see Methods for further visualization details). Overall scores are computed by a 40:60 weighted mean of these category scores. Methods that failed to run are omitted.
Extended Data Fig. 7
Extended Data Fig. 7. Scalability of each data integration method, separated by preprocessing procedure.
(a) CPU time for each method (colored dots) and data integration task. (b) Maximum memory usage for each method and scenario. Colored lines denote linear fit of log-scaled time or memory vs log-scaled dataset size for each data integration method and pre-processing combination. ATAC task results were included as unscaled full feature runs, and integration runs on peaks and windows feature spaces were excluded.
Extended Data Fig. 8
Extended Data Fig. 8. Scalability of each data integration method in terms of number of cells and features.
(a) Regression coefficients for number of cells and features on CPU time for each method. (b) Regression coefficients for number of cells and features on maximum memory usage for each method. Each dot denotes the regression coefficient of the linear fit of log-scaled time or memory vs log-scaled number of cells + log-scaled number of features for each data integration method. All unscaled RNA and ATAC data were modeled to determine the coefficients.
Extended Data Fig. 9
Extended Data Fig. 9. Usability assessment of data integration methods.
The usability of each data integration method was assessed via ten categories (labels on the left, see Methods) that consider criteria related to the implementation of the methods (package; dark blue) and information included in the original publications (paper; red). Each score is plotted as a heatmap, and methods are ordered by overall usability score. This score is computed as the sum of the partial average package and paper usability scores, and plotted on top in a barplot. On the right-hand side, criteria with poor scores across methods are highlighted for each category. For the Package scores of ComBat and MNN, we separately considered the original R implementation and the Python implementation that was used in this benchmark. Usability was assessed on December 17th, 2020.

References

    1. Tabula Muris Consortium. A single-cell transcriptomic atlas characterizes ageing tissues in the mouse. Nature. 2020;583:590–595. - PMC - PubMed
    1. Gehring J, Hwee Park J, Chen S, Thomson M, Pachter L. Highly multiplexed single-cell RNA-seq by DNA oligonucleotide tagging of cellular proteins. Nat. Biotechnol. 2020;38:35–38. - PubMed
    1. Mereu E, et al. Benchmarking single-cell RNA-sequencing protocols for cell atlas projects. Nat. Biotechnol. 2020;38:747–755. - PubMed
    1. Regev, A. et al. The Human Cell Atlas white paper. Preprint at 10.7554/eLife.27041 (2018).
    1. Eisenstein M. Single-cell RNA-seq analysis software providers scramble to offer solutions. Nat. Biotechnol. 2020;38:254–257. - PubMed

Publication types