. 2021 Dec 7:12:763022.
doi: 10.3389/fmicb.2021.763022. eCollection 2021.

Captivity Influences the Gut Microbiome of Rhinopithecus roxellana

Affiliations

Captivity Influences the Gut Microbiome of Rhinopithecus roxellana

Xiaochen Wang et al. Front Microbiol. .

Abstract

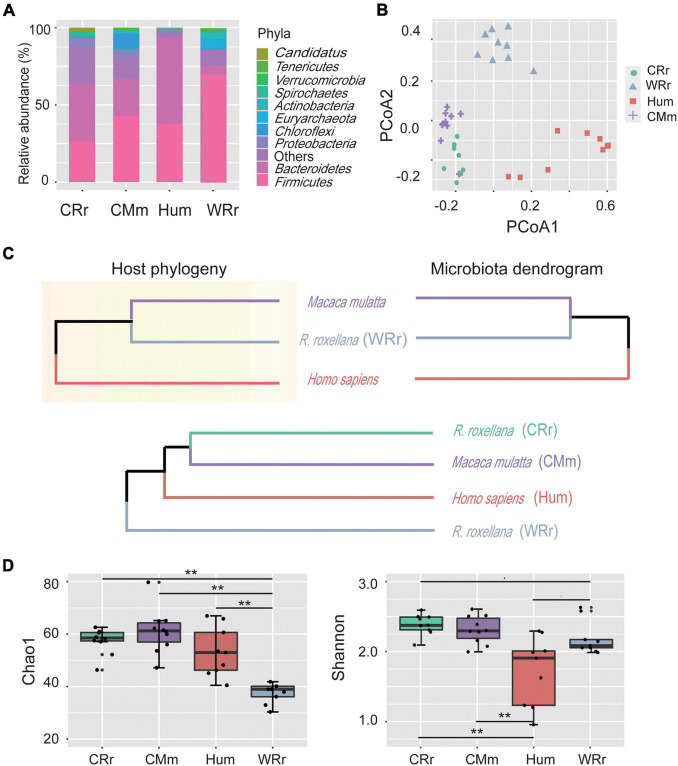
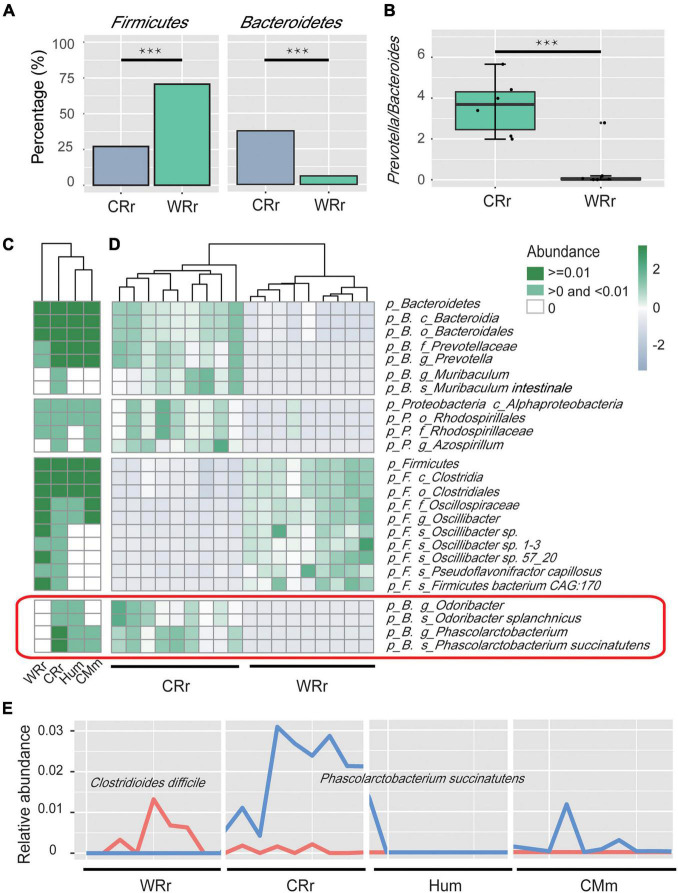
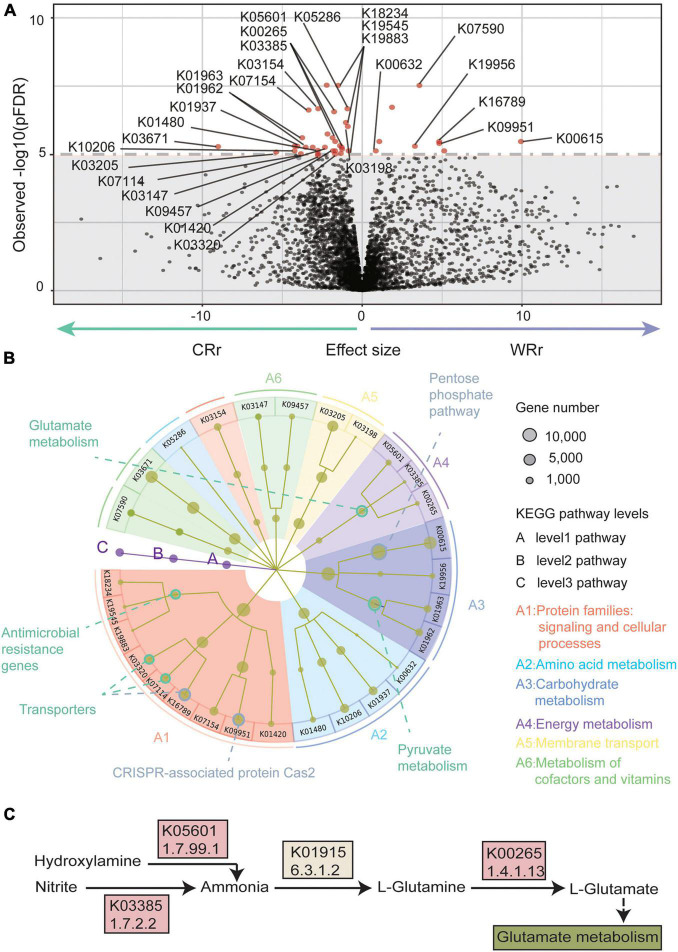
Ex situ (captivity in zoos) is regarded as an important form of conservation for endangered animals. Many studies have compared differences in the gut microbiome between captive and wild animals, but few have explained those differences at the functional level due to the limited amount of 16S rRNA data. Here, we compared the gut microbiome of captive and wild Rhinopithecus roxellana, whose high degree of dietary specificity makes it a good subject to observe the effects of the captive environment on their gut microbiome, by performing a metagenome-wide association study (MWAS). The Chao1 index was significantly higher in the captive R. roxellana cohort than in the wild cohort, and the Shannon index of captive R. roxellana was higher than that of the wild cohort but the difference was not significant. A significantly increased ratio of Prevotella/Bacteroides, which revealed an increased ability to digest simple carbohydrates, was found in the captive cohort. A significant decrease in the abundance of Firmicutes and enrichment of genes related to the pentose phosphate pathway were noted in the captive cohort, indicating a decreased ability of captive monkeys to digest fiber. Additionally, genes required for glutamate biosynthesis were also significantly more abundant in the captive cohort than in the wild cohort. These changes in the gut microbiome correspond to changes in the composition of the diet in captive animals, which has more simple carbohydrates and less crude fiber and protein than the diet of the wild animals. In addition, more unique bacteria in captive R. roxellana were involved in antibiotic resistance (Acinetobacter) and diarrhea (Desulfovibrio piger), and in the prevention of diarrhea (Phascolarctobacterium succinatutens) caused by Clostridioides difficile. Accordingly, our data reveal the cause-and-effect relationships between changes in the exact dietary composition and changes in the gut microbiome on both the structural and functional levels by comparing of captive and wild R. roxellana.

Keywords: MWAS; Rhinopithecus roxellana; captive environment; diet composition; gut microbiome.


Conflict of interest statement

The authors declare that the research was conducted in the absence of any commercial or financial relationships that could be construed as a potential conflict of interest.

Figures

FIGURE 1
FIGURE 1
Community constituents, structure, richness, and diversity of the gut microbiome among all cohorts. (A) Compositional bar plot of the ten most abundant phyla in each cohort (WRr: wild R. roxellana; CRr: captive R. roxellana; Hum: humans; CMm: captive M. mulatta). (B) PCoA plot of the gut microbiome community composition in the four cohorts at the genus level. (C) Comparison of the host phylogeny (upper left panel; assembled using http://timetree.org/) and their hierarchical tree (upper right panel). The gut microbiome dendrogram of the four cohorts (lower panel). (D) Alpha diversity of the gut microbiome in the four cohorts and [p(FDR)-value] between cohorts. Two asterisk indicates significant differences (p(FDR)-value < 0.01). Panel (A–D) indicate the tremendous effects of captivity and lifestyle on captive monkeys, and the gut microbiome of captive monkeys was more similar to that of humans than to that of wild monkeys.
FIGURE 2
FIGURE 2
Microbial community profiles of captive and wild R. roxellana microbiome. (A) Bar plots showing the relative abundance of Firmicutes and Bacteroidetes between WRr and CRr samples. Three asterisk indicates significant differences (p(FDR)-value < 0.001). (B) Box plots showing the Prevotella/Bacteroides (P/B) ratio of WRr and CRr samples. (C) The average relative abundance of taxa in the four cohorts (white = average relative abundance = 0; light green = average relative abundance < 0.01; dark green = average relative abundance > 0.01). (D) A heatmap showing the taxonomic terms that were significantly different [p(FDR) < 0.005] between wild and captive R. roxellana. Bacteria in the red box were shared by CRr, Hum, and CMm samples but not WRr samples. (E) The distribution of the relative abundances of C. difficile and P. succinatutens among the four cohorts. Panel (A–E) indicate the significant differences in bacterial communities between CRr and WRr samples, and the captive populations share some fecal microbes with humans.
FIGURE 3
FIGURE 3
Metagenome-wide association study results of the wild-captive R. roxellana gene association test. (A) A volcano plot of the K-numbers based on the KEGG database. In the volcano plot, the x-axis indicates beta value of the GLM as the effect size. The y-axis indicates observed –log10 [p(FDR)-values]. The horizontal dotted line indicates p(FDR) = 1e-5. There were 40 K-numbers with p(FDR) < 1e-5 are plotted as red dots, and other clades are plotted as black dots. (B) System diagram of KEGG pathways enriched with the 40 K-numbers highlighted in (A). The three levels are defined as A, B, and C and described from the inner layer out. The size of the dots represents the number of genes. The eight pathways with significant enrichment are outlined by circles (green: pathways with significantly different abundance in CRr samples; gray: pathways with significantly different abundance in WRr samples). (C) A pathway diagram showing the K-numbers associated with glutamate metabolism. Panel (A–C) show the significantly differentially abundant pathways between captive and wild R. roxellana and the abundance K-numbers associated with L-glutamate in the captive population.

References

    1. Amato K. R., Metcalf J. L., Song S. J., Hale V. L., Clayton J., Ackermann G., et al. (2016). Using the gut microbiota as a novel tool for examining colobine primate GI health. Glob. Ecol. Conserv. 7 225–237. 10.1016/j.gecco.2016.06.004 - DOI
    1. Asnicar F., Weingart G., Tickle T. L., Huttenhower C., Segata N. (2015). Compact graphical representation of phylogenetic data and metadata with GraPhlAn. PeerJ 3:e1029. 10.7717/peerj.1029 - DOI - PMC - PubMed
    1. Baj A., Moro E., Bistoletti M., Orlandi V., Crema F., Giaroni C. (2019). Glutamatergic signaling along the microbiota-gut-brain axis. Int. J. Mol. Sci. 20:1482. 10.3390/ijms20061482 - DOI - PMC - PubMed
    1. Baniel A., Amato K. R., Beehner J. C., Bergman T. J., Mercer A., Perlman R. F., et al. (2021). Seasonal shifts in the gut microbiome indicate plastic responses to diet in wild geladas. Microbiome 9:26. 10.1186/s40168-020-00977-9 - DOI - PMC - PubMed
    1. Benjamini Y., Hochberg Y. (1995). Controlling the false discovery rate:a practical and powerful approach to multiple testing. J. R. Stat. Soc. 57 289–300.

LinkOut - more resources