. 2021 Dec 7:8:780865.
doi: 10.3389/fmolb.2021.780865. eCollection 2021.

The Identification of a Novel Calcium-Dependent Link Between NAD+ and Glucose Deprivation-Induced Increases in Protein O-GlcNAcylation and ER Stress

Affiliations

The Identification of a Novel Calcium-Dependent Link Between NAD+ and Glucose Deprivation-Induced Increases in Protein O-GlcNAcylation and ER Stress

Luyun Zou et al. Front Mol Biosci. .

Abstract

The modification of proteins by O-linked β-N-acetylglucosamine (O-GlcNAc) is associated with the regulation of numerous cellular processes. Despite the importance of O-GlcNAc in mediating cellular function our understanding of the mechanisms that regulate O-GlcNAc levels is limited. One factor known to regulate protein O-GlcNAc levels is nutrient availability; however, the fact that nutrient deficient states such as ischemia increase O-GlcNAc levels suggests that other factors also contribute to regulating O-GlcNAc levels. We have previously reported that in unstressed cardiomyocytes exogenous NAD+ resulted in a time and dose dependent decrease in O-GlcNAc levels. Therefore, we postulated that NAD+ and cellular O-GlcNAc levels may be coordinately regulated. Using glucose deprivation as a model system in an immortalized human ventricular cell line, we examined the influence of extracellular NAD+ on cellular O-GlcNAc levels and ER stress in the presence and absence of glucose. We found that NAD+ completely blocked the increase in O-GlcNAc induced by glucose deprivation and suppressed the activation of ER stress. The NAD+ metabolite cyclic ADP-ribose (cADPR) had similar effects on O-GlcNAc and ER stress suggesting a common underlying mechanism. cADPR is a ryanodine receptor (RyR) agonist and like caffeine, which also activates the RyR, both mimicked the effects of NAD+. SERCA inhibition, which also reduces ER/SR Ca2+ levels had similar effects to both NAD+ and cADPR on O-GlcNAc and ER stress responses to glucose deprivation. The observation that NAD+, cADPR, and caffeine all attenuated the increase in O-GlcNAc and ER stress in response to glucose deprivation, suggests a potential common mechanism, linked to ER/SR Ca2+ levels, underlying their activation. Moreover, we showed that TRPM2, a plasma membrane cation channel was necessary for the cellular responses to glucose deprivation. Collectively, these findings support a novel Ca2+-dependent mechanism underlying glucose deprivation induced increase in O-GlcNAc and ER stress.

Keywords: ER stress; NAD+; O-GlcNAc; TRPM2 cation channel; calcium; glucose deprivation.


Conflict of interest statement

The authors declare that the research was conducted in the absence of any commercial or financial relationships that could be construed as a potential conflict of interest.

Figures

FIGURE 1
FIGURE 1
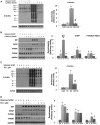
Effects of NAD+ on O-GlcNAc levels and ER stress in response to glucose deprivation in AC16 cells. (A) Left panel: O-GlcNAc, OGA and OGT immunoblots, with and without glucose (5 mM) and NAD+ (250 µM). Right panel: Quantification of immunoblots normalized to GAPDH. (B) Left panel: O-GlcNAc and acetylated lysine immunoblots, with and without glucose (5 mM) and nicotinamide (NAM, 5 mM). Right panel: Quantification of immunoblots normalized to GAPDH. (C) Left panel: Effects of SIRT1 inhibitor EX527 (10 µM) on O-GlcNAc and acetylated lysine levels in response to glucose deprivation with NAD+. Right panel: Quantification of immunoblots normalized to GAPDH. (D) Left panel: BiP, CHOP, phospho- (P) and total (T) PERK immunoblots, with and without glucose (5 mM) and NAD+ (250 µM). Right panel: Quantification of immunoblots normalized to GAPDH. *p < 0.05 vs. Control (Con) group; #p < 0.05 vs. glucose deprivation (GD) group. All data are expressed as mean ± S.E.M. of 3–6 independent experiments.
FIGURE 2
FIGURE 2
The effects of cADPR and ADPR on the glucose deprivation induced increase in O-GlcNAc and ER Stress in AC16 cells. (A) Left panel: O-GlcNAc immunoblots with and without glucose in the presence or absence of cADPR (100 µM). Right panel Quantification of immunoblots normalized to GAPDH. (B) Left panel: O-GlcNAc immunoblots with and without glucose in the presence or absence of ADPR (50 µM). Right panel: Quantification of immunoblots normalized to GAPDH. (C) Left panel: BiP, CHOP, phospho- (P) and total (T) PERK immunoblots, with and without glucose in the presence or absence of cADPR (100 µM). Right panel: Quantification of immunoblots normalized to GAPDH. (D) Left panel: BiP, CHOP, phospho- (P) and total (T) PERK immunoblots, with and without glucose in the presence or absence of ADPR (50 µM). Right panel: Quantification of immunoblots normalized to GAPDH. *p < 0.05 vs. Control (Con) group; #p < 0.05 vs. glucose deprivation (GD) group. All data are expressed as mean ± S.E.M. of 3–6 independent experiments.
FIGURE 3
FIGURE 3
The effects of caffeine and thapsigargin (TG) on the glucose deprivation induced increase in O-GlcNAc and ER Stress in AC16 cells: (A) Left panel: O-GlcNAc immunoblots with and without glucose in the presence or absence of caffeine (5 mM). Right panel: Quantification of immunoblots normalized to GAPDH. (B) Left panel: BiP, CHOP, phospho- (P) and total (T) PERK immunoblots, with and without glucose in the presence or absence of caffeine (5 mM). Right panel: Quantification of immunoblots normalized to GAPDH. (C) Left panel: O-GlcNAc immunoblots with and without glucose in the presence or absence of thapsigargin (1 µM). Right panel Quantification of immunoblots normalized to GAPDH. (D) Left panel: BiP, CHOP, phospho- (P) and total (T) PERK immunoblots, with and without glucose in the presence of thapsigargin (1 µM). Right panel: Quantification of immunoblots normalized to GAPDH. All data are expressed as mean ± S.E.M. of 3–6 independent experiments. *p < 0.05 vs. Control (Con) group; #p < 0.05 vs. glucose deprivation (GD) group.
FIGURE 4
FIGURE 4
The effects of TRPM2 inhibition in AC16 cells, or TRPM2 deletion in MEFs on the glucose deprivation induced increase in O-GlcNAc and ER Stress: (A) Top Panels: O-GlcNAc immunoblots with and without glucose in the presence or absence of TRPM2 inhibitors FLA (5–100 µM) and ACA (1–10 µM); Bottom Panels: Quantification of immunoblots at 50 and 100 µM FLA and 5 and 10 µM ACA normalized to GAPDH. (B) Top Panels: BiP and CHOP immunoblots with and without glucose in the presence or absence of TRPM2 inhibitors FLA (50, 100 µM) and ACA (5, 10 µM); Bottom Panels: Quantification of immunoblots normalized to GAPDH. (C) Left O-GlcNAc immunoblots from wild type (WT) and TRPM2−/− cells with and without glucose in the presence or absence of NAD+ (250 µM); Quantification of immunoblots for WT and TRMP2−/− normalized to GAPDH. (D) Top Panels: Immunoblots for BiP and CHOP from wild type (WT) and TRPM2−/− cells with and without glucose in the presence or absence of NAD+ (250 µM); Bottom Panels: Quantification of immunoblots for WT and TRPM2−/− normalized to GAPDH. *p < 0.05 vs. Control (Con) group; #p < 0.05 vs. glucose deprivation (GD) group. All data are expressed as mean ± S.E.M. of 3–6 independent experiments.
FIGURE 5
FIGURE 5
The effects of SKF96365, KN93, CN585, and glucosamine on the glucose deprivation induced increase in O-GlcNAc levels and indices of ER stress in AC16 cells. (A) Left Panel: Immunoblots O-GlcNAc, BiP and CHOP with and without glucose in the presence or absence of SKF96365 (20 µM); Right Panels: Quantification of immunoblots normalized to GAPDH. (Note the duration of these experiments was shortened from 24 to 6 h because longer periods of glucose deprivation in the presence of SKF96365 resulted in cell death; hence the increase in O-GlcNAc following glucose deprivation is lower than other studies where the experimental period was 24 h), (B) Left Panels: Immunoblots for O-GlcNAc, BiP and CHOP with and without glucose in the presence or absence of KN93 (20 µM); Right Panels: Quantification of immunoblots normalized to GAPDH. (C) Left Panels: Immunoblots for O-GlcNAc, BiP and CHOP with and without glucose in the presence or absence of CN585 (60 µM); Right Panels: Quantification of immunoblots normalized to GAPDH. (D) Left Panel: Immunoblots O-GlcNAc, BiP and CHOP with and without glucose in the presence or absence of glucosamine; Right Panels: Quantification of immunoblots normalized to GAPDH. *p < 0.05 vs. Control (Con) group; #p < 0.05 vs. glucose deprivation (GD) group. All data are expressed as mean ± S.E.M. of 3–6 independent experiments.
FIGURE 6
FIGURE 6
A schematic summarizing the results and illustrating potential mechanisms underlying effects of glucose deprivation on O-GlcNAc and ER stress and how they might be regulated by NAD+ and its metabolites: 1) In response to glucose deprivation there is a decrease in HBP flux, which is supported by the observation that glucosamine, which is metabolized to UDP-GlcNAc via the HBP, attenuates the responses to glucose deprivation. 2) While the downstream effector of the decreased HBP flux has yet to be identified, a likely candidate would the loss of O-GlcNAc from specific site(s) on a protein(s) subsequently triggering a release of Ca2+ from the ER/SR. This is supported by observations that interventions that decrease ER/SR Ca2+ levels attenuate the responses to glucose deprivation. 3) Inhibition of TRPM2 or loss of TRPM2 blocked the glucose deprivation responses, suggesting that its activation via glucose deprivation resulted in an influx of extracellular Ca2+. In addition, ER/SR Ca2+ release has been shown to be sufficient to activate TRPM2 channels. This is supported by earlier observations that extracellular Ca2+ was required for the glucose deprivation induced increase in O-GlcNAc (Zou et al., 2012) and that inhibition of downstream Ca2+ signaling pathways blunted the increase in ER stress and O-GlcNAc in response to glucose deprivation. In addition, SKF96365 a SOCE inhibitor, which also attenuates the response to glucose deprivation, is reported to inhibit members of the transient receptor potential family including TRPM2 channels (Harteneck et al., 2011). 4) The TRPM2 mediated influx of Ca2+ activates Ca2+/CaM-dependent pathway, which potentially via activation of calcineurin leads to increased ER stress and O-GlcNAc levels. This is supported by the observation that KN93 a CaMKII and Ca2+/CaM inhibitor and CN585, a calcineurin inhibitor, attenuated the responses to glucose deprivation. The links between Ca2+/CaM and the increase in ER stress and O-GlcNAc following glucose deprivation are currently not known, although calcineurin has been associated with activation of ER stress (Carreras-Sureda et al., 2018). 5) The NAD+ metabolites, cADPR and ADPR, are known to activate the RyR releasing ER/SR Ca2+ and caffeine a RyR agonist all attenuate the cellular responses to glucose deprivation. The SERCA inhibitors thapsigargin (Thg) and CPA, which decrease ER/SR Ca2+ levels also blunt the response to glucose deprivation.

References

    1. Almanza A., Carlesso A., Chintha C., Creedican S., Doultsinos D., Leuzzi B., et al. (2019). Endoplasmic Reticulum Stress Signalling - from Basic Mechanisms to Clinical Applications. FEBS J. 286, 241–278. 10.1111/febs.14608 - DOI - PMC - PubMed
    1. Bastide B., Snoeckx K., Mounier Y. (2002). ADP-ribose Stimulates the Calcium Release Channel RyR1 in Skeletal Muscle of Rat. Biochem. Biophysical Res. Commun. 296, 1267–1271. 10.1016/s0006-291x(02)02073-9 - DOI - PubMed
    1. Bheda P., Jing H., Wolberger C., Lin H. (2016). The Substrate Specificity of Sirtuins. Annu. Rev. Biochem. 85, 405–429. 10.1146/annurev-biochem-060815-014537 - DOI - PubMed
    1. Bruzzone S., Guida L., Zocchi E., Franco L., Flora A. D. (2001). Connexin 43 Hemichannels Mediate Ca2+‐regulated Transmembrane NAD+ Fluxes in Intact Cells. FASEB j. 15, 10–12. 10.1096/fj.00-0566fje - DOI - PubMed
    1. Carreras-Sureda A., Pihán P., Hetz C. (2018). Calcium Signaling at the Endoplasmic Reticulum: fine-tuning Stress Responses. Cell Calcium 70, 24–31. 10.1016/j.ceca.2017.08.004 - DOI - PubMed