. 2021 Oct 24;4(1):100388.
doi: 10.1016/j.jhepr.2021.100388. eCollection 2022 Jan.

Characterization of the liver immune microenvironment in liver biopsies from patients with chronic HBV infection

Affiliations

Characterization of the liver immune microenvironment in liver biopsies from patients with chronic HBV infection

Nicholas van Buuren et al. JHEP Rep. .

Abstract

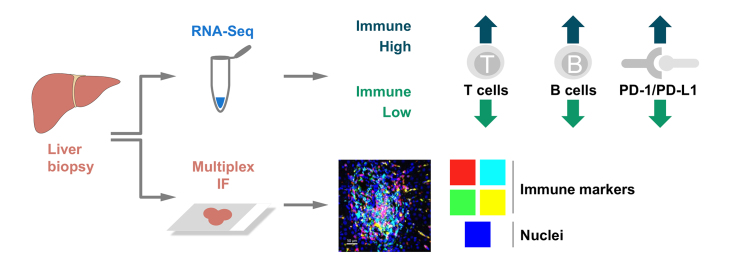
Background & aims: We aim to describe the liver immune microenvironment by analyzing liver biopsies from patients with chronic HBV infection (CHB). Host immune cell signatures and their corresponding localization were characterized by analyzing the intrahepatic transcriptome in combination with a custom multiplex immunofluorescence panel.

Method: Matching FFPE and fresh frozen liver biopsies were collected from immune active patients within the open-label phase IV study GS-US-174-0149. RNA-Seq was conducted on 53 CHB liver biopsies from 46 patients. Twenty-eight of the 53 samples had matched FFPE biopsies and were stained with a 12-plex panel including cell segmentation, immune and viral biomarkers. Corresponding serum samples were screened using the MSD Human V-plex Screen Service to identify peripheral correlates for the immune microenvironment.

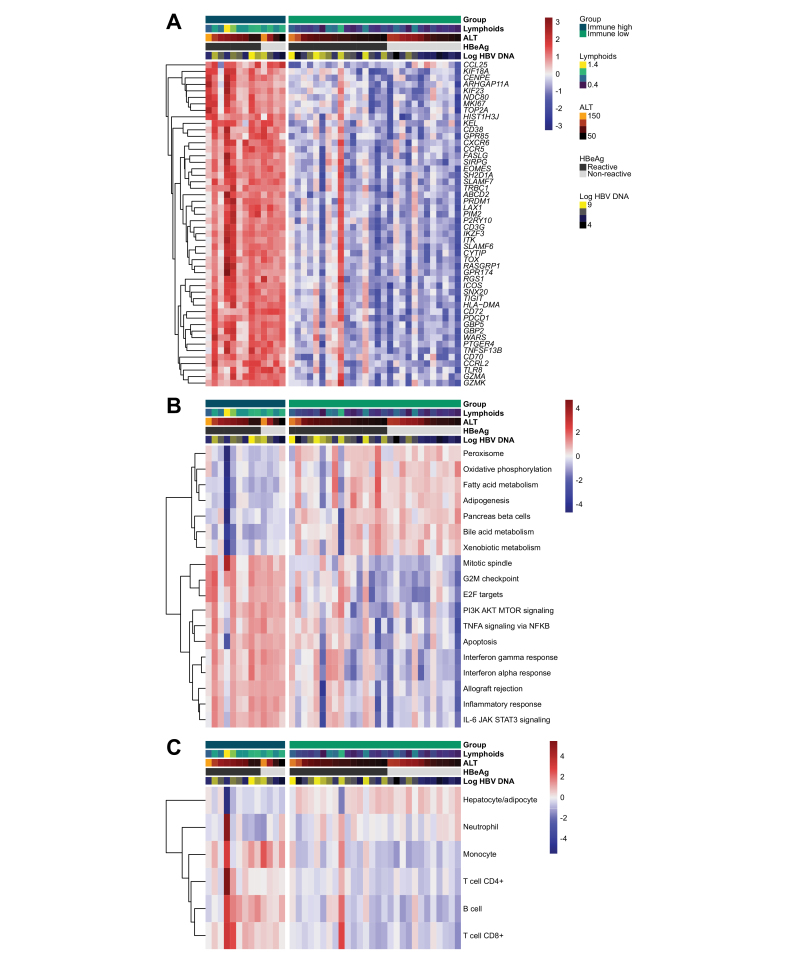
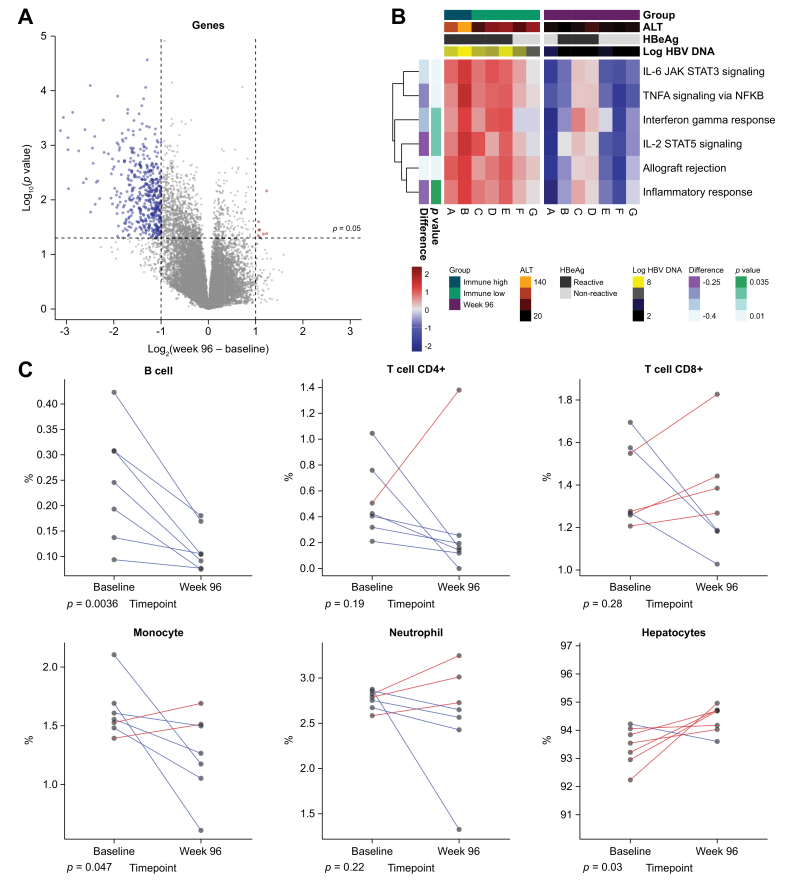
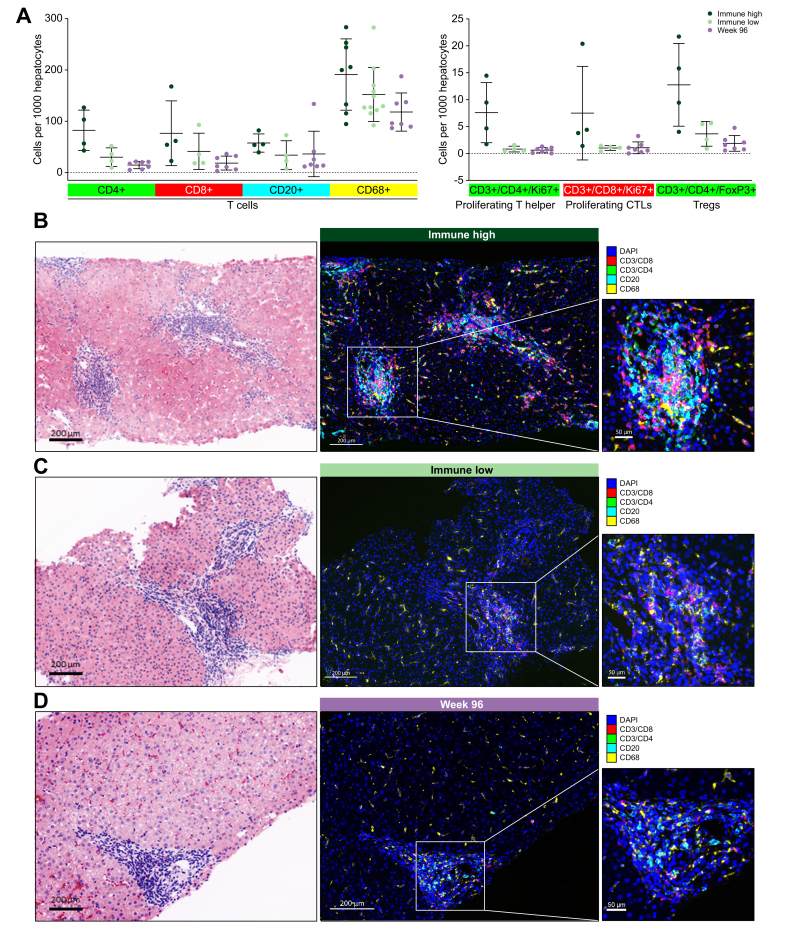
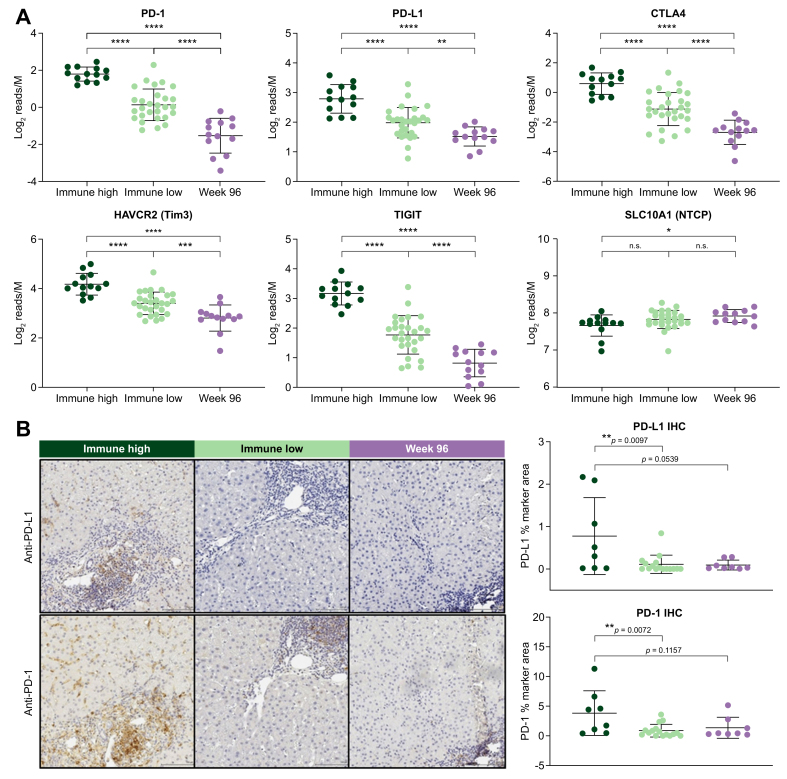
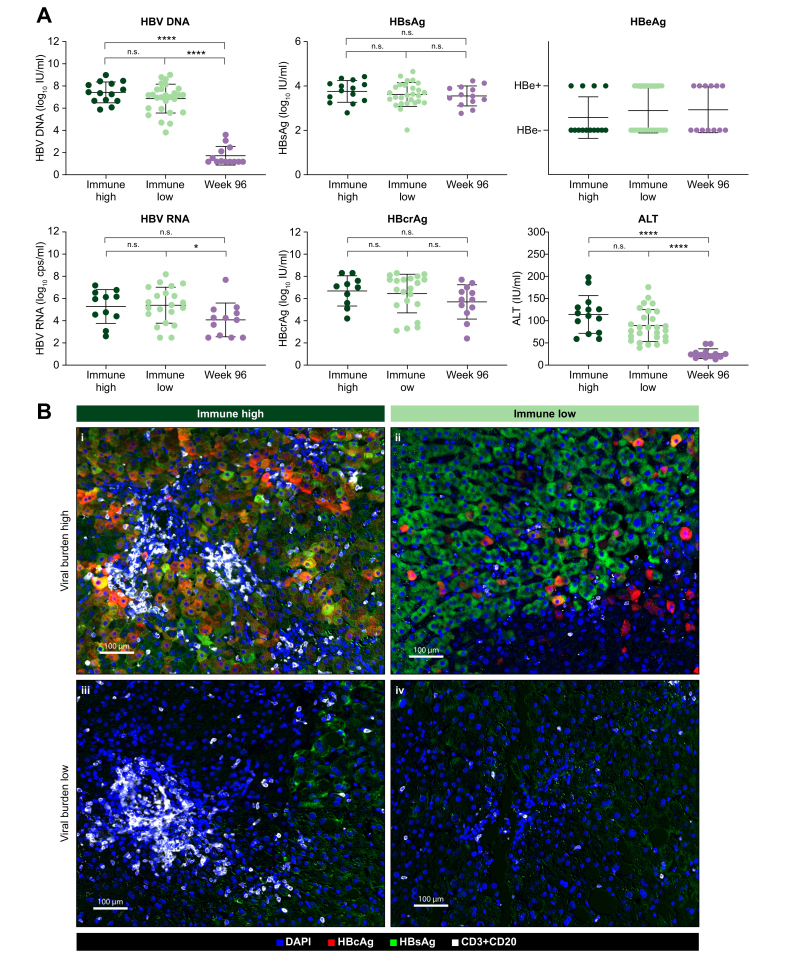
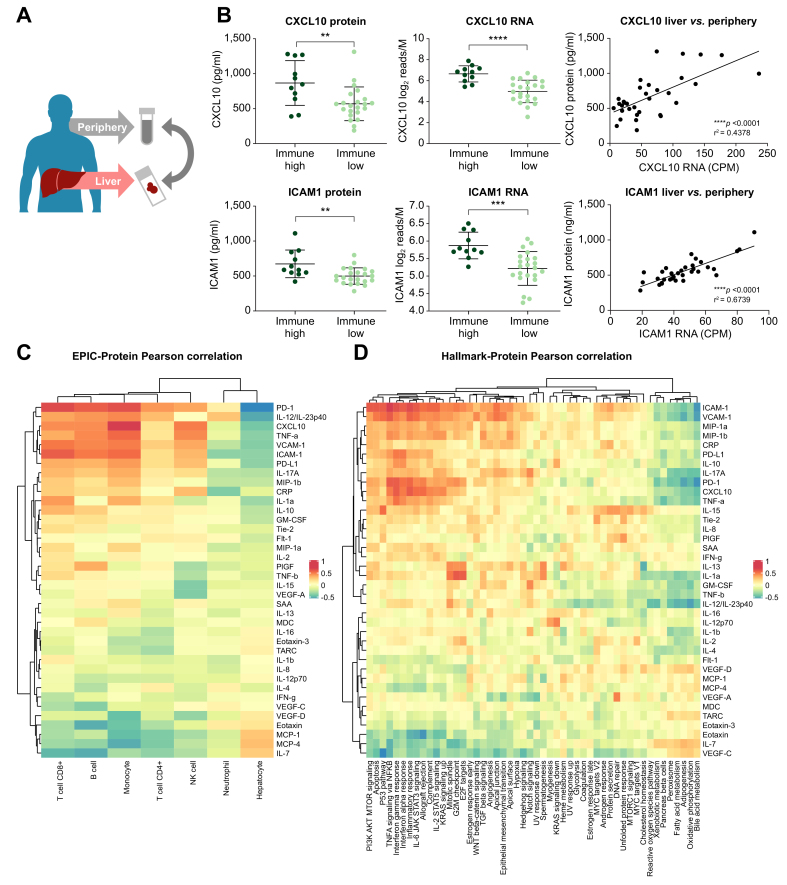
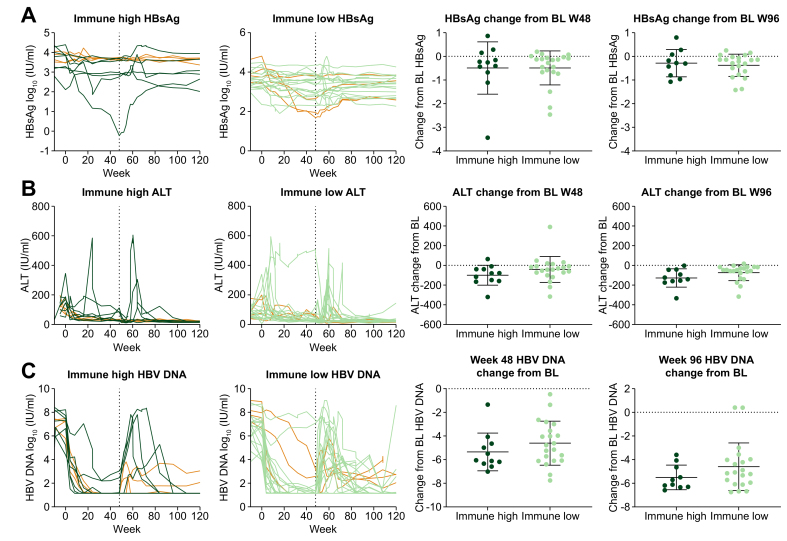
Results: Using unsupervised clustering of the transcriptome, we reveal two unique liver immune signatures classified as immune high and immune low based on the quantification of the liver infiltrate gene signatures. Multiplex immunofluorescence analysis demonstrated large periportal lymphoid aggregates in immune high samples consisting of CD4 and CD8 T cells, B cells and macrophages. Differentiation of the high and low immune microenvironments was independent of HBeAg status and peripheral viral antigen levels. In addition, longitudinal analysis indicates that treatment and normalization of ALT correlates with a decrease in liver immune infiltrate and inflammation. Finally, we screened a panel of peripheral biomarkers and identified ICAM-1 and CXCL10 as biomarkers that strongly correlate with these unique immune microenvironments.

Conclusion: These data provide a description of immune phenotypes in patients with CHB and show that immune responses are downregulated in the liver following nucleotide analogue treatment. This may have important implications for both the safety and efficacy of immune modulator programs aimed at HBV cure.

Lay summary: Liver biopsies from patients with chronic hepatitis B were submitted to RNA-Seq and multiplex immunofluorescence and identified two different liver immune microenvironments: immune high and immune low. Immune high patients showed elevated immune pathways, including interferon signaling pathways, and increase presence of immune cells. Longitudinal analysis of biopsies from treatment experienced patients showed that treatment correlates with a marked decrease in inflammation and these findings may have important implications for both safety and efficacy of immune modulator programs for HBV cure.

Keywords: ALT, alanine aminotransferase; BCR, B-cell receptor; CHB, chronic HBV infection; Chronic HBV; DEG, differentially expressed gene; FFPE, formalin-fixed paraffin-embedded; Hepatitis B; IHC, immunohistochemistry; Immune Microenvironment; Intrahepatic transcriptome; PEG-IFNα, pegylated-interferon-α; TCR, T-cell receptor; TDF, tenofovir disoproxil fumarate; TLS, tertiary lymphoid structures; mIF, multiplex immunofluorescence; multiplex immunofluorescence; ssGSEA, single sample gene set enrichment analysis.


Conflict of interest statement

All authors are either employees of Gilead Sciences or funded by Gilead Sciences for clinical trial sample collection. Please refer to the accompanying ICMJE disclosure forms for further details.

Figures

None
Graphical abstract
Fig. 1
Fig. 1
Comparison of intrahepatic immune cell and pathway signatures across CHB liver biopsies. Gene expression patterns were analyzed by xCell (lymphoids on x-axis) and unsupervised hierarchical clustering to define two groups called immune high and immune low. (A) List of the top differentially expressed genes between immune high and immune low clusters. (B) Differentiated Hallmark pathways between immune high and immune low. (C) EPIC cell deconvolution shows an increase of T-cell, B-cell, and monocyte signatures in immune high samples. Patient order is consistent in heatmaps A-C. ALT, alanine aminotransferase; CHB, chronic HBV infection.
Fig. 2
Fig. 2
Tenofovir disoproxil fumarate treatment suppresses liver inflammation. (A) Seven patients donated longitudinal liver biopsies from baseline and week 96. Differential gene expresssion analysis between baseline and matched week 96 samples. P values are from limma's moderated t test. (B) Immune pathways were scored for each patient at baseline and week 96. Each row is a unique immune-related pathway from MSigDB which is normalized to the mean of the 7 week 96 samples. (C) Longitudinal analysis using EPIC cell deconvolution.P values represent pairwise t tests. ALT, alanine aminotransferase.
Fig. 3
Fig. 3
Immune high liver biopsies contain increased B-cell, T-cell and Kupffer cell numbers in portal regions. (A) mIF was performed on FFPE slides from 28 samples with matched RNA-Seq. Immune cell types and markers were quantified and normalized per 1,000 hepatocytes. (B) Representative images from an immune high, immune low and week 96 sample are shown. CD3/8 (red), CD3/4 (green), CD20 (cyan), CD68 (yellow) and DAPI (blue). Virtual H&E stains were generated following all rounds of fluorescent staining. FFPE, formalin-fixed paraffin-embedded; mIF, multiplex immunofluorescence.
Fig. 4
Fig. 4
Immune high cluster demonstrates significantly higher expression of immune checkpoints. (A) Gene expression patterns for a variety of checkpoint receptors (and ligands) plotted to compare expression in immune high (blue) vs. immune low (green) vs. week 96 (purple) samples. Statistical significance was calculated by unpaired t test. (B) FFPE slides were analyzed by single-plex IHC with anti-PD-1 and anti-PD-L1. Images from a representative immune high, immune low and week 96 sample are displayed. PD-1 and PD-L1 staining was quantified by % marker area staining. Staining patterns between sample groups were analyzed using unpaired t tests. FFPE, formalin-fixed paraffin-embedded; IHC, immunohistochemistry.
Fig. 5
Fig. 5
Immune group clusters are not differentiated by viral antigen burden. (A) Patient sera matched to each liver biopsy was analyzed for viral biomarkers and ALT levels. The viral biomarkers HBV DNA, HBV RNA, HBcrAg, HBsAg and HBeAg were analyzed from each patient and timepoint and compared between immune groups. P values were calculated using unpaired t tests. (B) mIF channels for HBcAg, HBsAg, CD20 and CD3 were overlaid to visualize intrahepatic immune signatures in relation to viral antigens. Representative images from 4 individual samples representing immune high and immune low signatures at baseline with corresponding high or low viral antigen burdens are shown. HBcAg (red), HBsAg (green), CD3/CD20 merged (white) and DAPI (blue). IHC, immunohistochemistry; mIF, multiplex immunofluorescence.
Fig. 6
Fig. 6
Targeted biomarker screen for peripheral correlates of the liver immune clusters. (A) Patient sera were analyzed using Meso-Scale Discovery platform. (B) Serum protein levels of each analyte were compared to the corresponding liver expression levels using Pearson’s correlation analysis. CXCL10 and ICAM-1 protein significantly correlate with their liver gene expression and differentiate the immune groups. (C) Peripheral biomarkers were correlated to intrahepatic immune pathway signatures using Hallmark analysis. (D) Peripheral biomarkers were correlated to intrahepatic cell signatures using EPIC analysis.
Fig. 7
Fig. 7
Clinical outcomes analysis for immune high vs. immune low patients. Clinical parameters (A) HBsAg, (B) ALT, (C) HBV DNA were plotted over time between baseline and week 96 for patients from immune high (n = 11) and immune low (n = 21) groups. Changes from baseline to week 48 or week 96 were also calculated. Eight patients that experienced HBeAg loss are highlighted in orange. ALT, alanine aminotransferase.

References

    1. Organization WH . 2017. Hepatitis B.https://www.who.int/news-room/fact-sheets/detail/hepatitis-b [cited; Available from:
    1. Iloeje U.H., Yang H.I., Jen C.L., Su J., Wang L.Y., You S.L., et al. Risk and predictors of mortality associated with chronic hepatitis B infection. Clin Gastroenterol Hepatol. 2007;5:921–931. - PubMed
    1. Fattovich G., Stroffolini T., Zagni I., Donato F. Hepatocellular carcinoma in cirrhosis: incidence and risk factors. Gastroenterology. 2004;127:S35–S50. - PubMed
    1. Hou J., Brouwer W.P., Kreefft K., Gama L., Price S.L., Janssen H.L.A., et al. Unique intrahepatic transcriptomics profiles discriminate the clinical phases of a chronic HBV infection. PLoS One. 2017;12 - PMC - PubMed
    1. Karmen A., Wroblewski F., Ladue J.S. Transaminase activity in human blood. J Clin Invest. 1955;34:126–131. - PMC - PubMed