. 2021 Dec 10;2(4):100998.
doi: 10.1016/j.xpro.2021.100998. eCollection 2021 Dec 17.

A protocol for imaging microvilli biogenesis on the surface of cultured porcine kidney epithelial cell monolayers

Affiliations

A protocol for imaging microvilli biogenesis on the surface of cultured porcine kidney epithelial cell monolayers

Isabella M Gaeta et al. STAR Protoc. .

Abstract

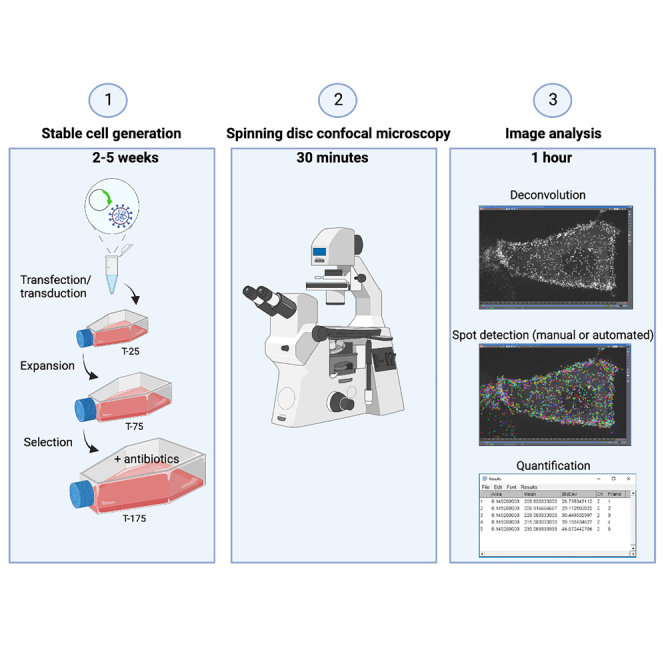
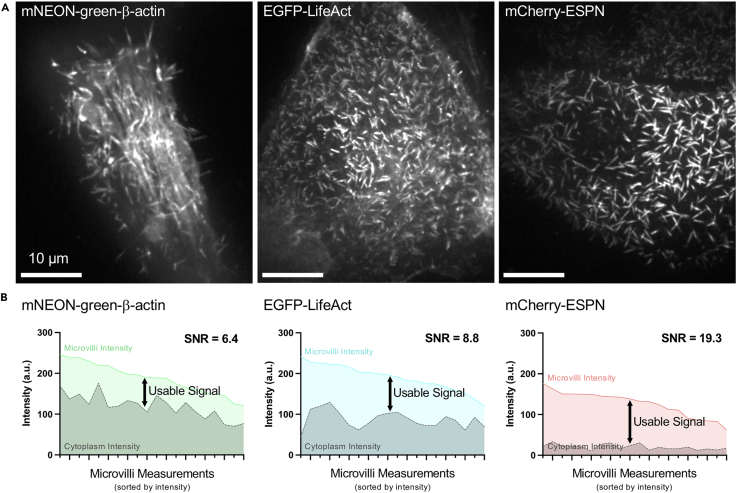
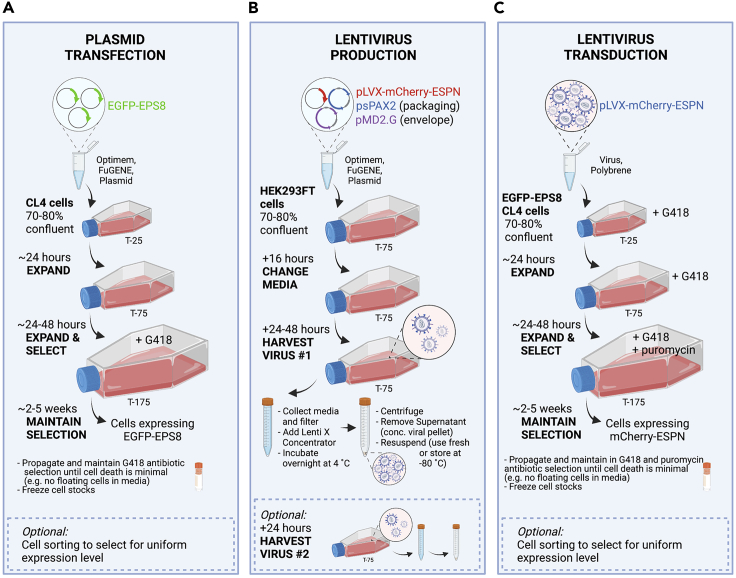
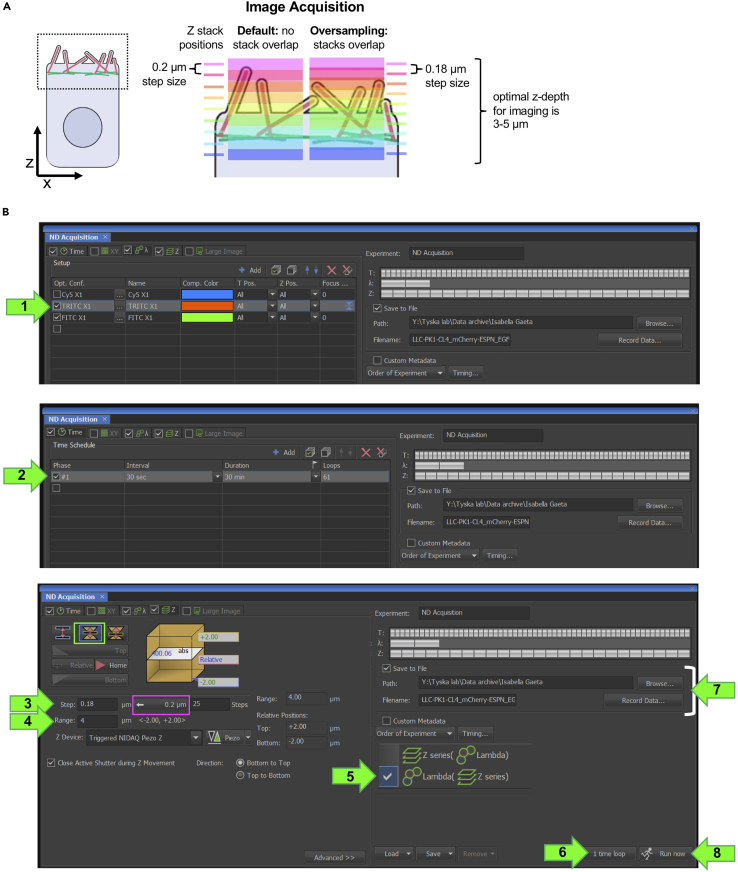
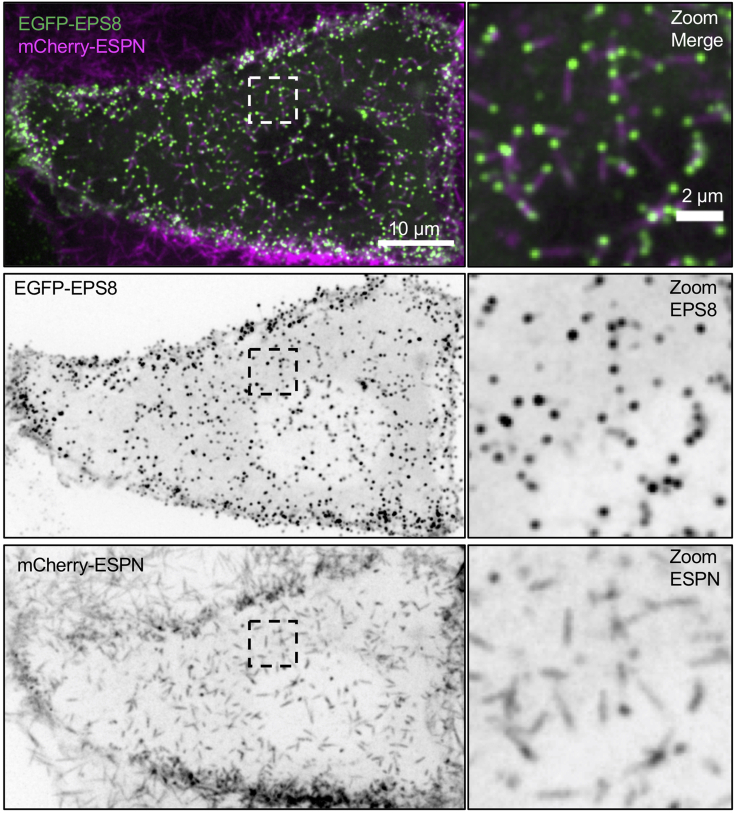
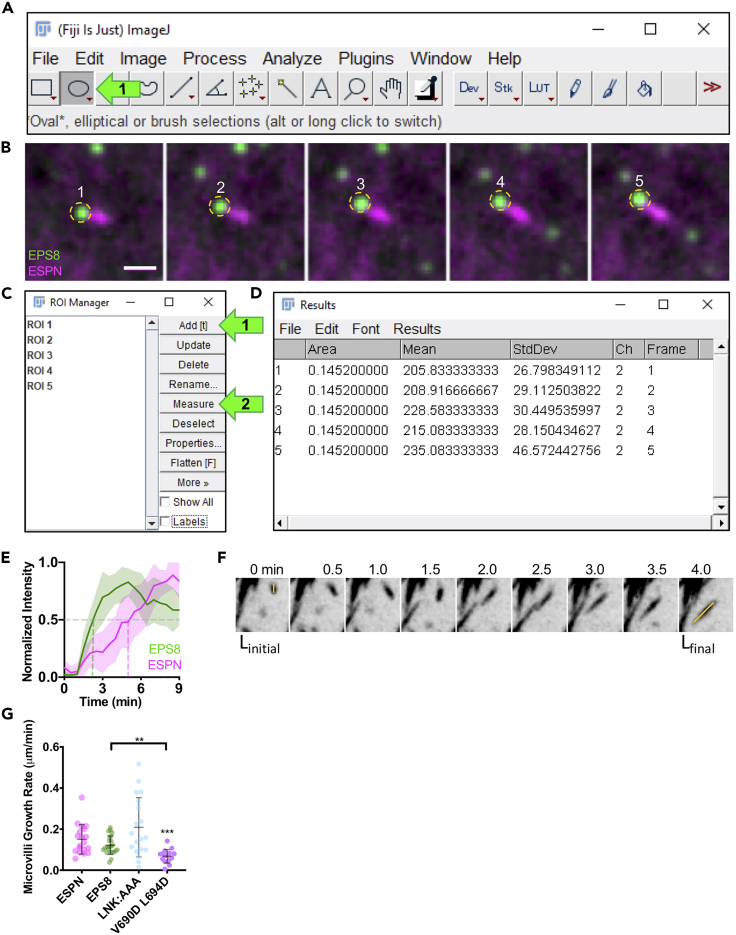
A key facet of epithelial differentiation is the assembly of actin-based protrusions known as microvilli, which amplify apical membrane surface area for various cell functions. To probe mechanisms of microvillus assembly, we developed a protocol using spinning disk confocal microscopy to directly visualize microvillus biogenesis on the surface of cultured porcine kidney epithelial cell monolayers engineered to express fluorescent proteins. This protocol offers access to the molecular details of individual protrusion growth events at high spatiotemporal resolution. For complete details on the use and execution of this protocol, please refer to Gaeta et al. (2021).

Keywords: Cell Biology; Cell culture; Cell-based Assays; Microscopy.


Conflict of interest statement

The authors declare no competing interests.

Figures

None
Graphical abstract
Figure 1
Figure 1
Examples of CL4 cells expressing markers for the actin cytoskeleton (A) Spinning disk confocal images of cells expressing mNEON-green-β-actin (left), EGFP-LifeAct (middle) and mCherry-ESPN (right). (B) Microvilli signal to noise ratio (SNR) plots corresponding to images shown in A. N = 20 microvilli. SNR is defined as μ/σ, with μ = signal mean and σ = standard deviation of the noise.
Figure 2
Figure 2
Workflow for creation of stable cells via plasmid transfection and viral transduction
Figure 3
Figure 3
Example of optimal cell density for capturing microvillus growth events Cells are growing in sub-confluent islands.
Figure 5
Figure 5
Optical sectioning of CL4 cells over time to capture apical surface dynamics (A) Representative schematic of oversampling in the z dimension to enable deconvolution. (B) Stepwise acquisition settings.
Figure 4
Figure 4
Example of a CL4 cell expressing EGFP-EPS8 (green) and mCherry-ESPN (magenta) This cell satisfies conditions outlined in Step-by-step details 3a. Most notably, microvilli are sparse enough to observe nascent microvillus growth events and the mCherry-ESPN signal is sufficiently high over background. Scale bar = 10 μm. Zoom inset scale bar = 2 μm.
Figure 6
Figure 6
Stepwise 3D deconvolution setup
Figure 7
Figure 7
Performing spot detection and tracking binaries (A) Progression of a deconvolved z stack to a maximum intensity projection. The maximum intensity projected image is then used for spot detection. (B) Spot detection setup. (C) Track Binaries setup. (D) Frequency distribution setup in Prism 10. (E) Example of EGFP-EPS8 puncta intensity histogram. n = number of puncta from a single representative cell (reprinted with permission from Gaeta et al., 2021).
Figure 8
Figure 8
Region tracking of microvillus growth events in FIJI (A) FIJI user interface with an arrow pointing to oval selection. (B) Example of manual region tracking of EGFP-EPS8 puncta. Scale bar = 1 μm. (C) ROI manager interface with arrows pointing to the add and measure selections. (D) Example of a results table displaying the ROI area, mean, standard deviation, channel and frame. (E) Normalized intensity vs time plot of EGFP-EPS8 and mCherry-ESPN. N= 14 events from 7 cells (reprinted with permission from Gaeta et al., 2021). (F) Example montage of a microvillus growth event in a cell expressing mCherry-ESPN. Box width = 4μm. Linitial and Lfinal measurements are overlaid (reprinted with permission from Gaeta et al., 2021). (G) Quantification of microvillus growth rate. Using ANOVA with Kruskal-Wallis, ∗∗∗p=0.0004 compared to ESPN only control. Bracketed asterisks use ANOVA with Kruskal-Wallis compared to EGFP-EPS8 ∗∗∗p=0.0045. ESPN n = 19 growth events, IRTKS n = 19 growth events, EPS8 n = 23 growth events, LNK:AAA n = 19 growth events, V690D L694D n = 16 growth events. Error bars indicate mean ± SD. Each data point represents a single de novo microvillus growth event. (E–G reprinted with permission from Gaeta et al., 2021).

References

    1. Baas A.F., Kuipers J., van der Wel N.N., Batlle E., Koerten H.K., Peters P.J., Clevers H.C. Complete polarization of single intestinal epithelial cells upon activation of LKB1 by STRAD. Cell. 2004;116:457–466. - PubMed
    1. Elia N., Lippincott-Schwartz J. Culturing MDCK cells in three dimensions for analyzing intracellular dynamics. Curr. Protoc. Cell Biol. 2009;Chapter 4:4–22. - PMC - PubMed
    1. Gaeta I.M., Meenderink L.M., Postema M.M., Cencer C.S., Tyska M.J. Direct visualization of epithelial microvilli biogenesis. Curr. Biol. 2021;31:2561–2575.e2566. - PMC - PubMed
    1. Meenderink L.M., Gaeta I.M., Postema M.M., Cencer C.S., Chinowsky C.R., Krystofiak E.S., Millis B.A., Tyska M.J. Actin dynamics drive microvillar motility and clustering during brush border assembly. Dev. Cell. 2019;50:545–556.e544. - PMC - PubMed
    1. Melak M., Plessner M., Grosse R. Actin visualization at a glance. J. Cell Sci. 2017;130:525–530. - PubMed

Publication types