Review
. 2022 Apr 1;322(4):H493-H522.
doi: 10.1152/ajpheart.00392.2021. Epub 2021 Dec 24.

Assessing hemodynamics from the photoplethysmogram to gain insights into vascular age: a review from VascAgeNet

Affiliations
Review

Assessing hemodynamics from the photoplethysmogram to gain insights into vascular age: a review from VascAgeNet

Peter H Charlton et al. Am J Physiol Heart Circ Physiol. .

Abstract

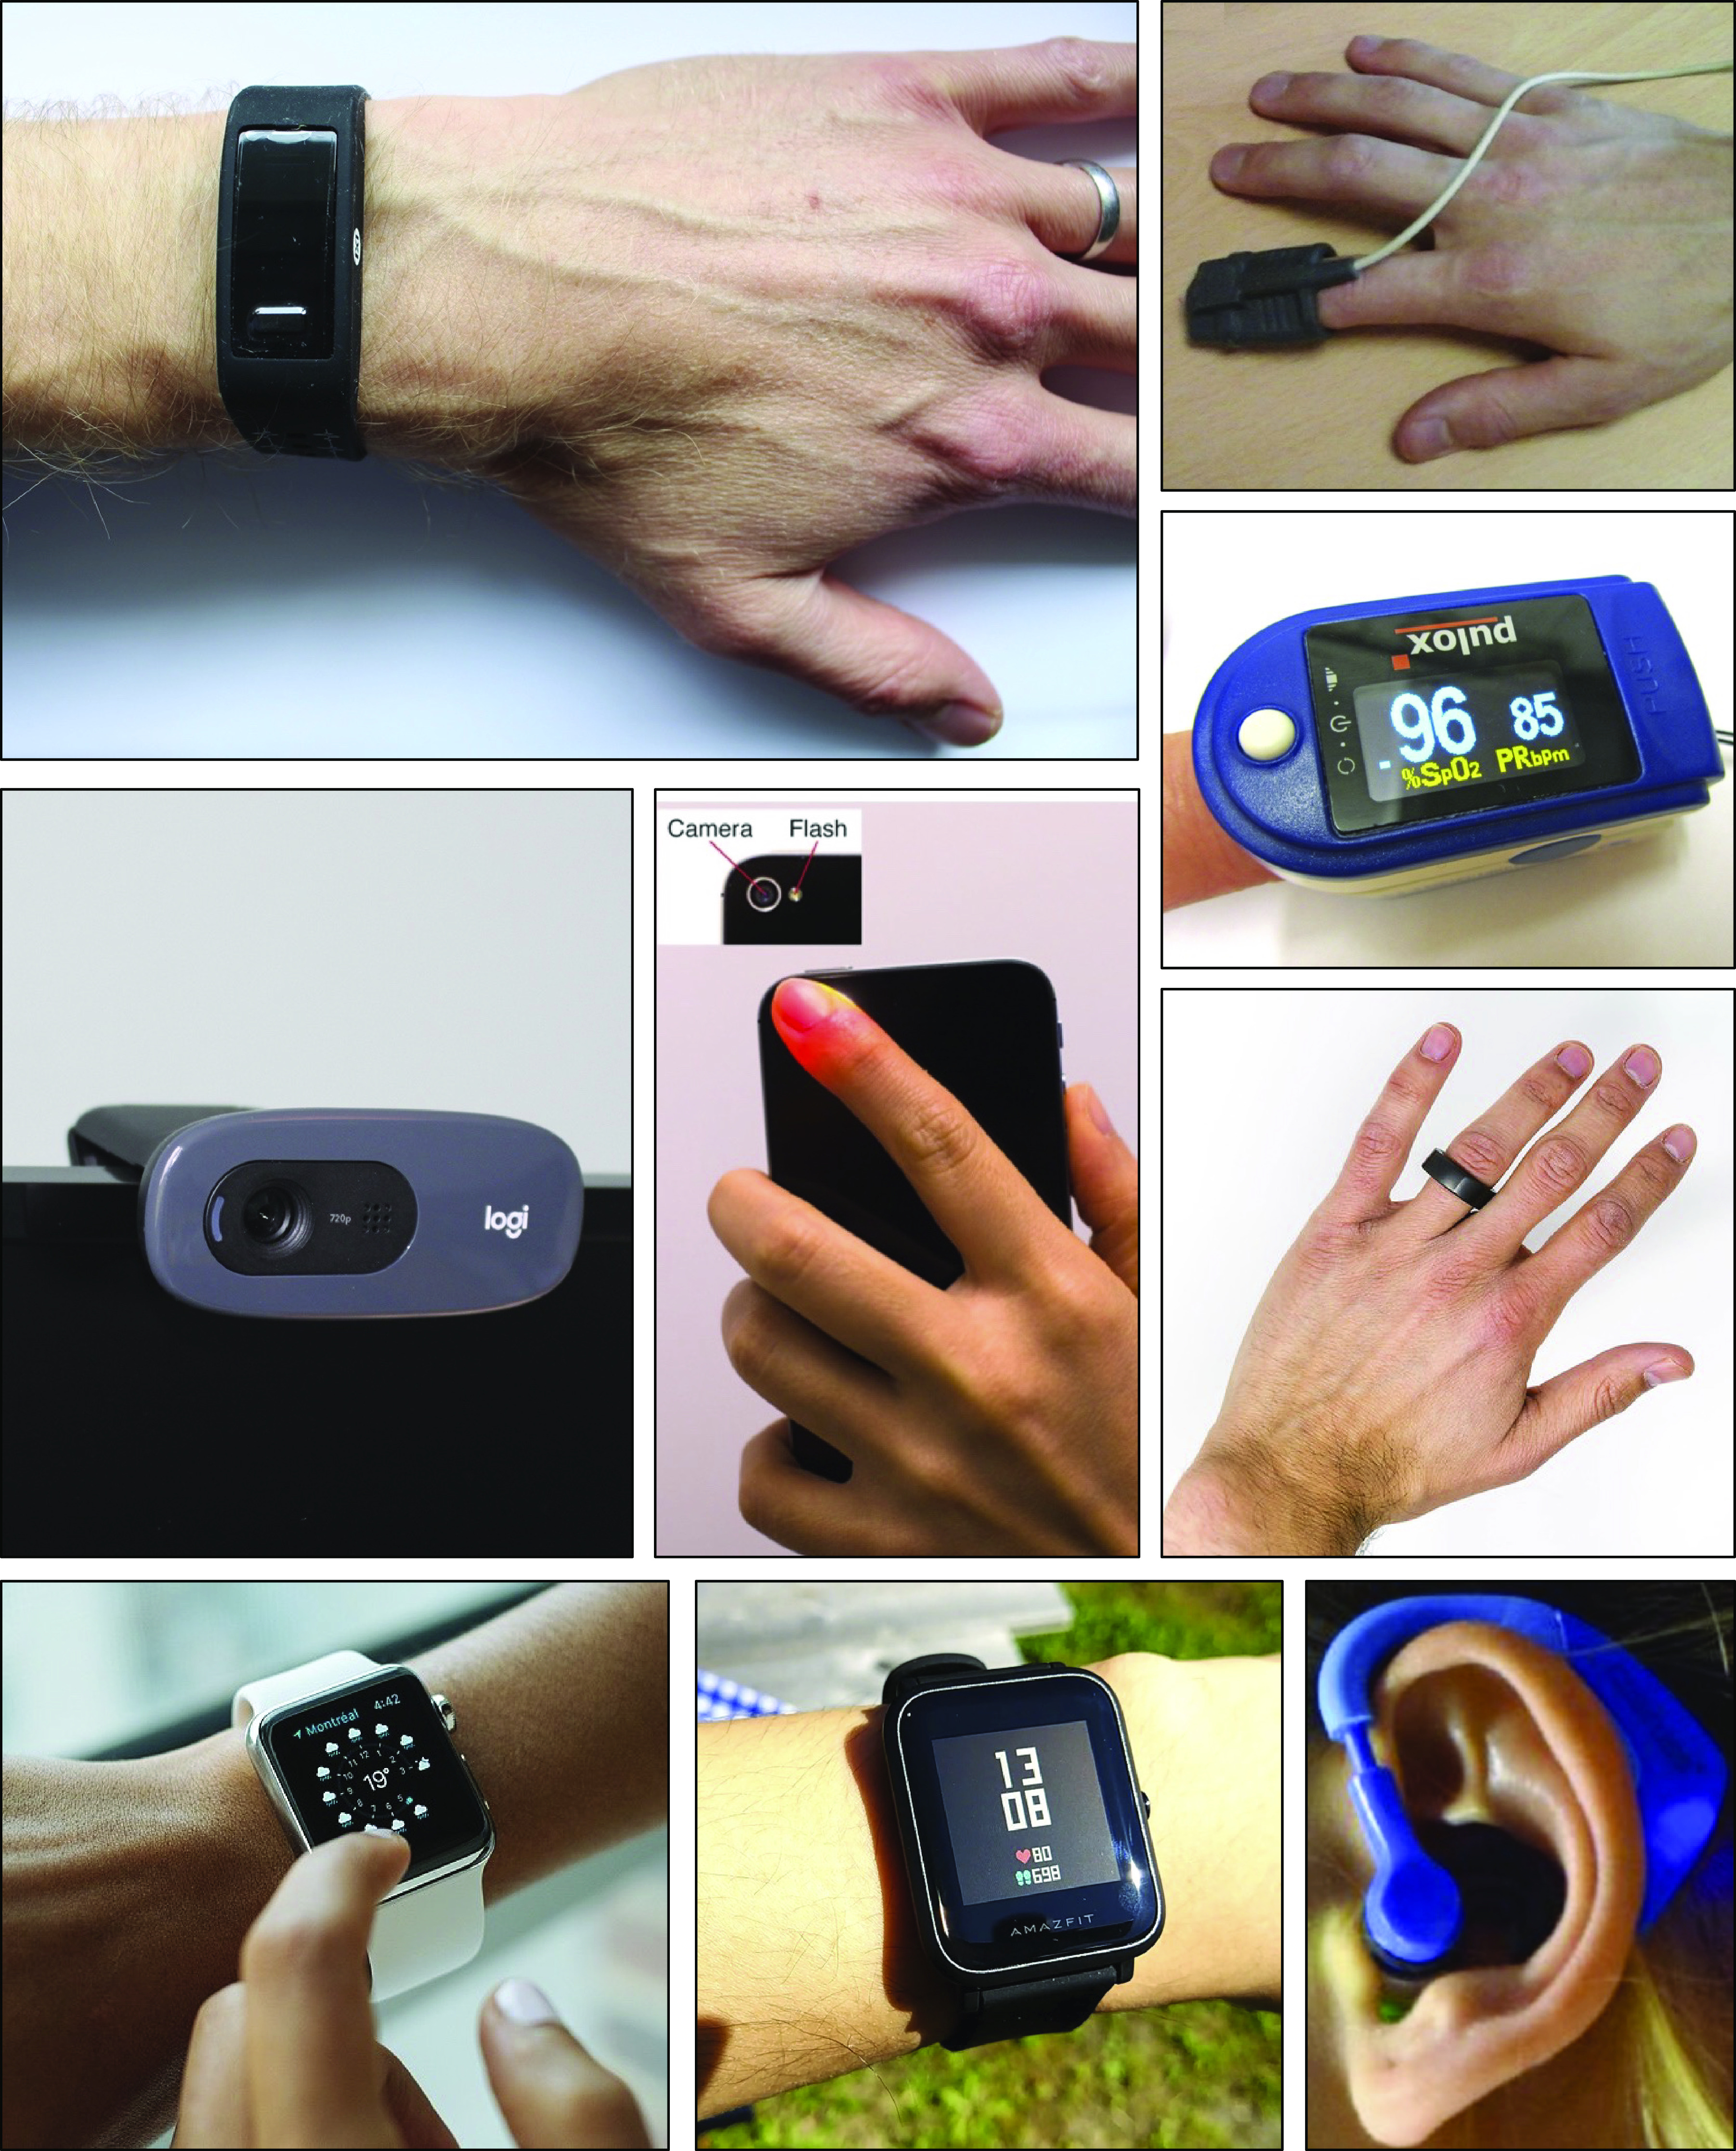
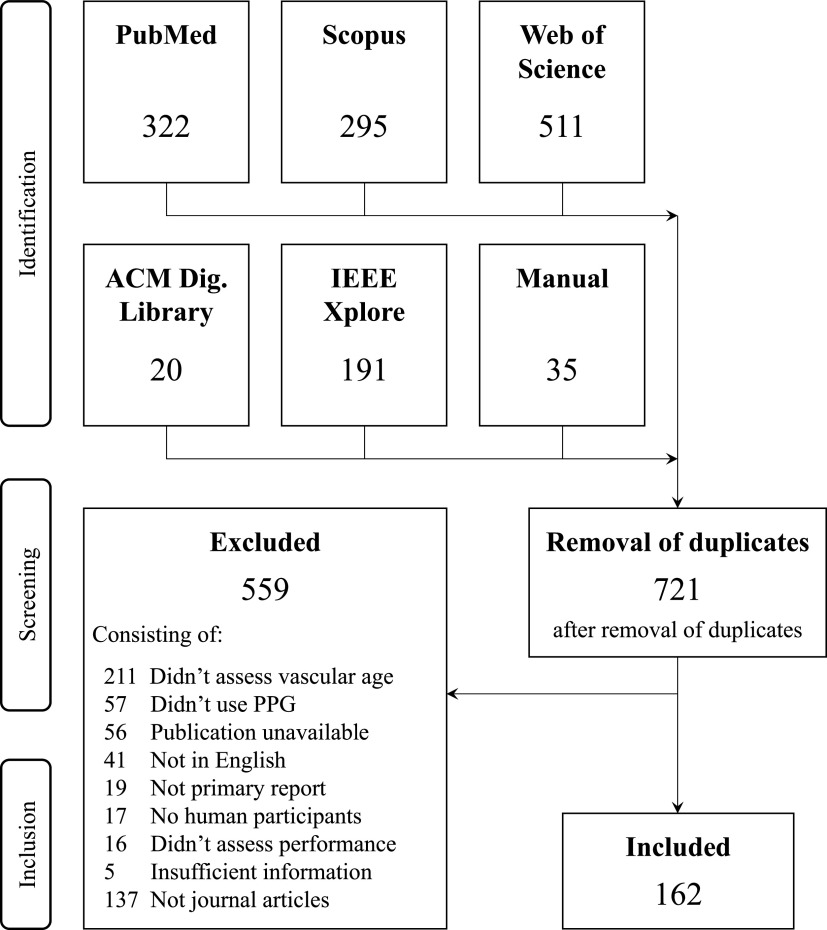
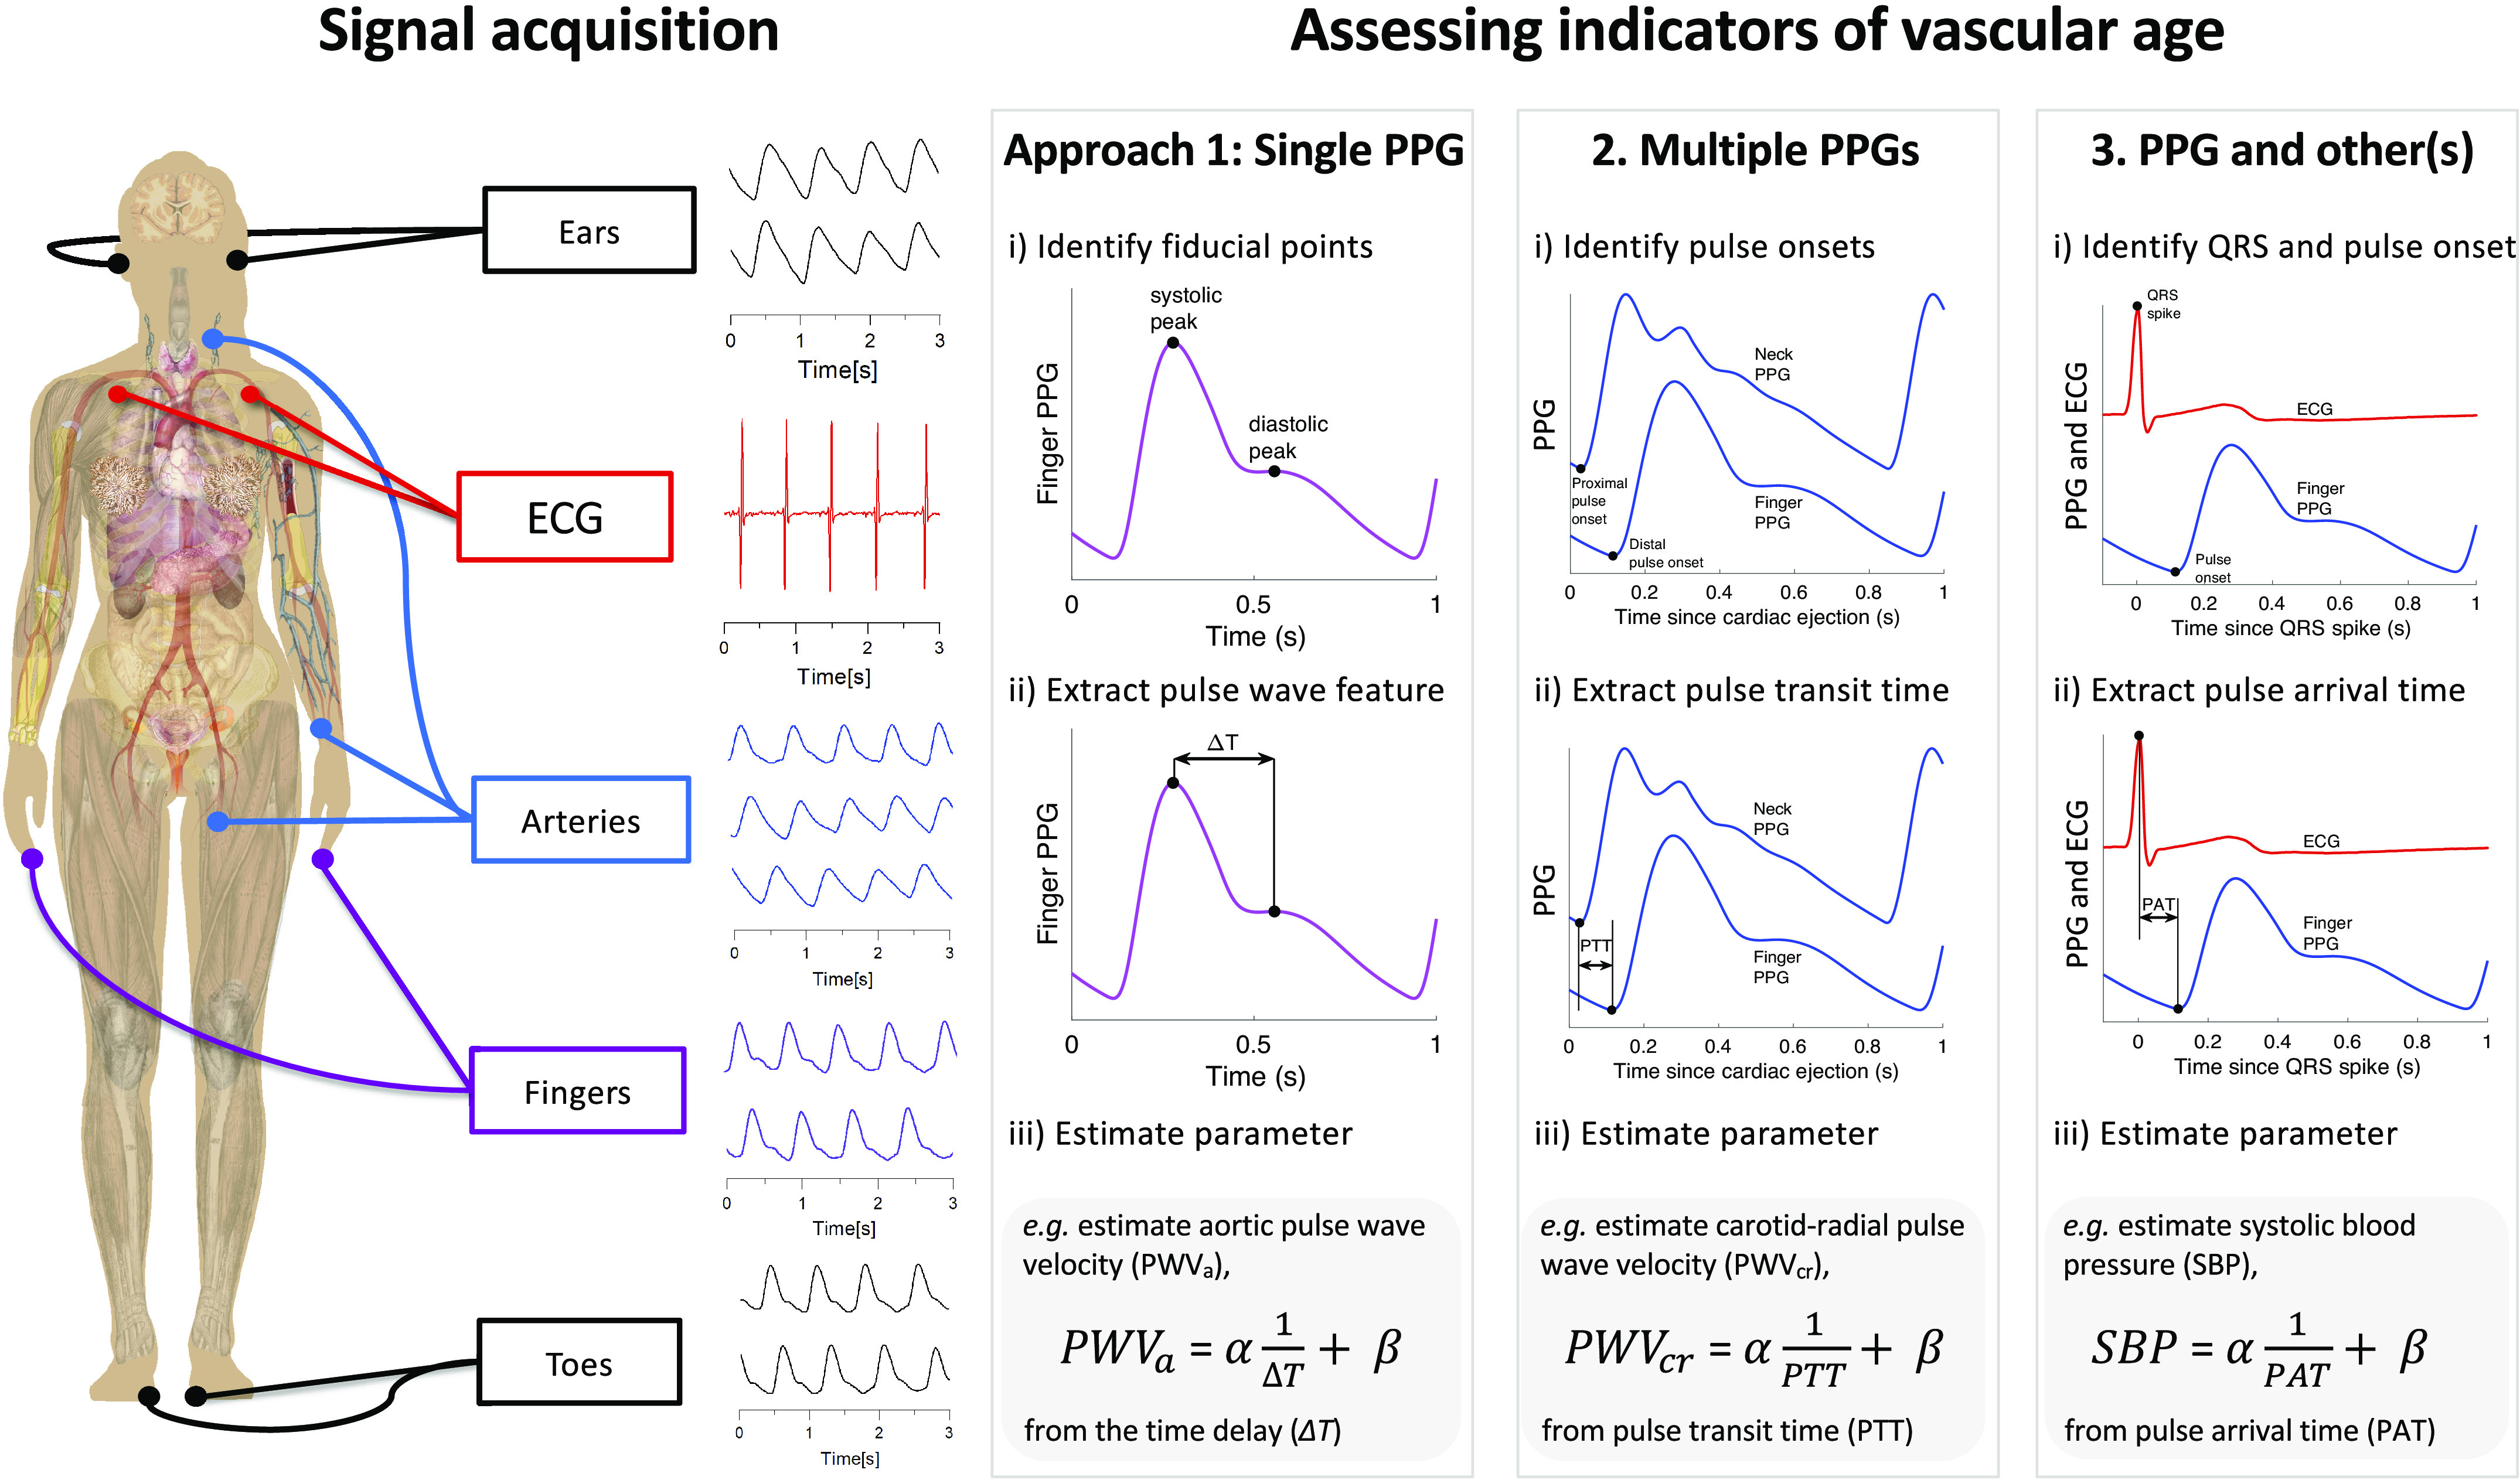
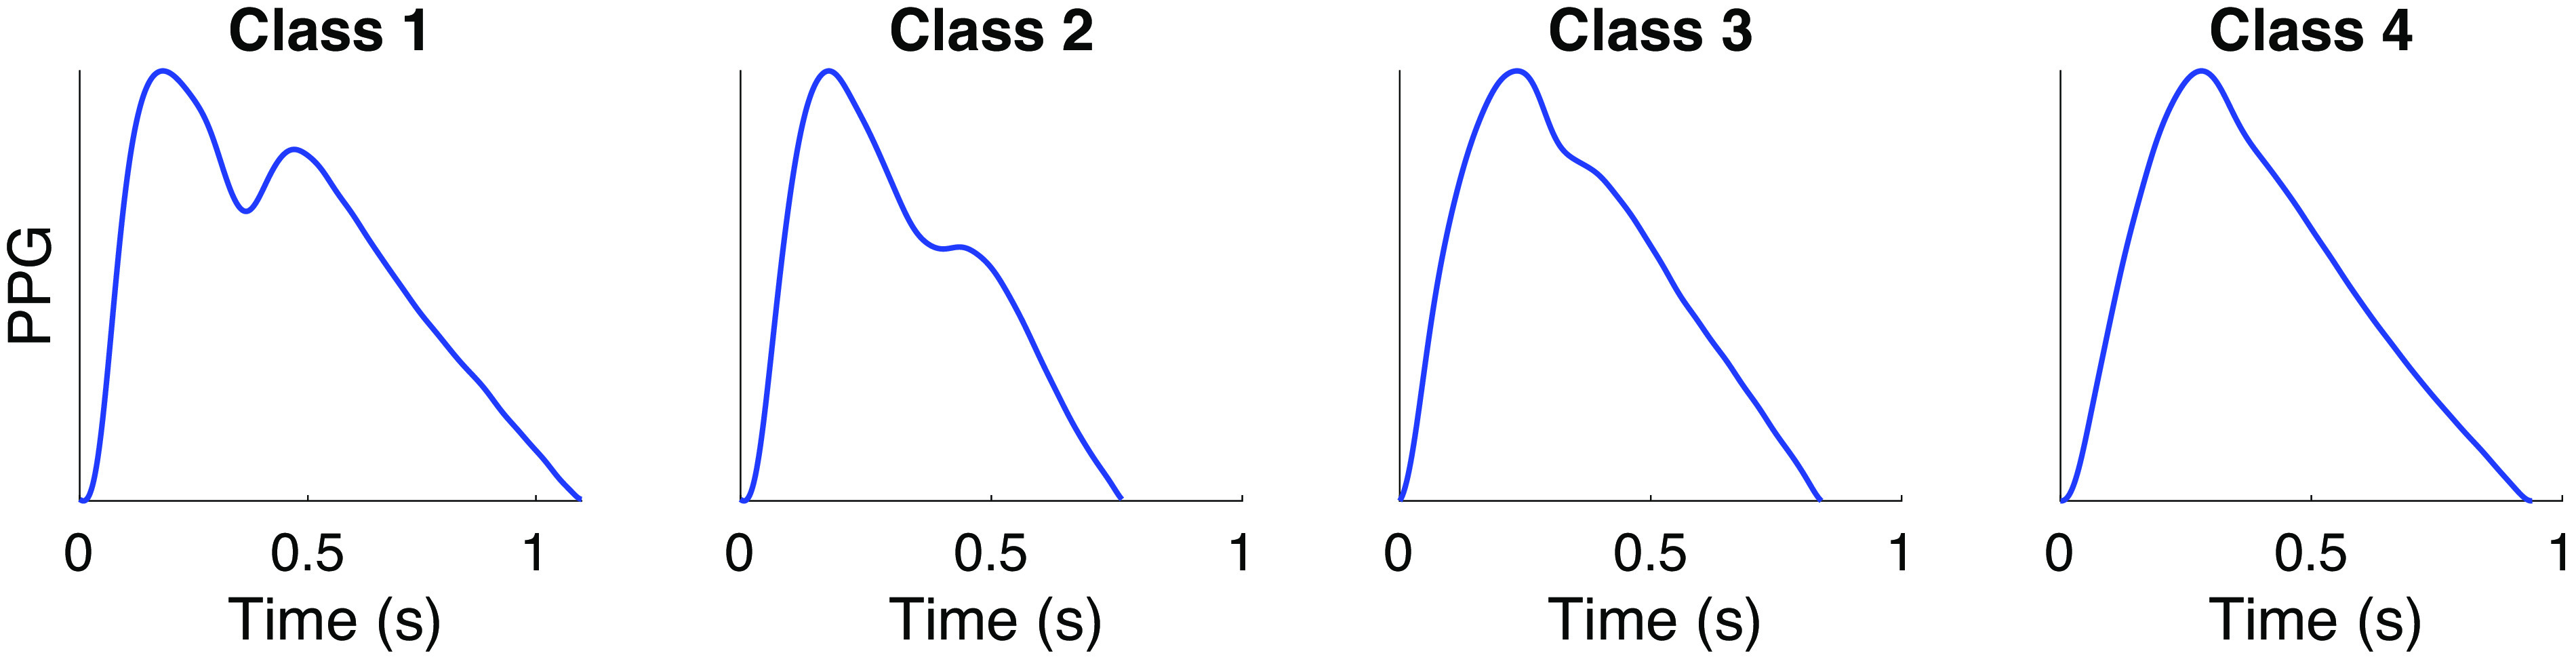
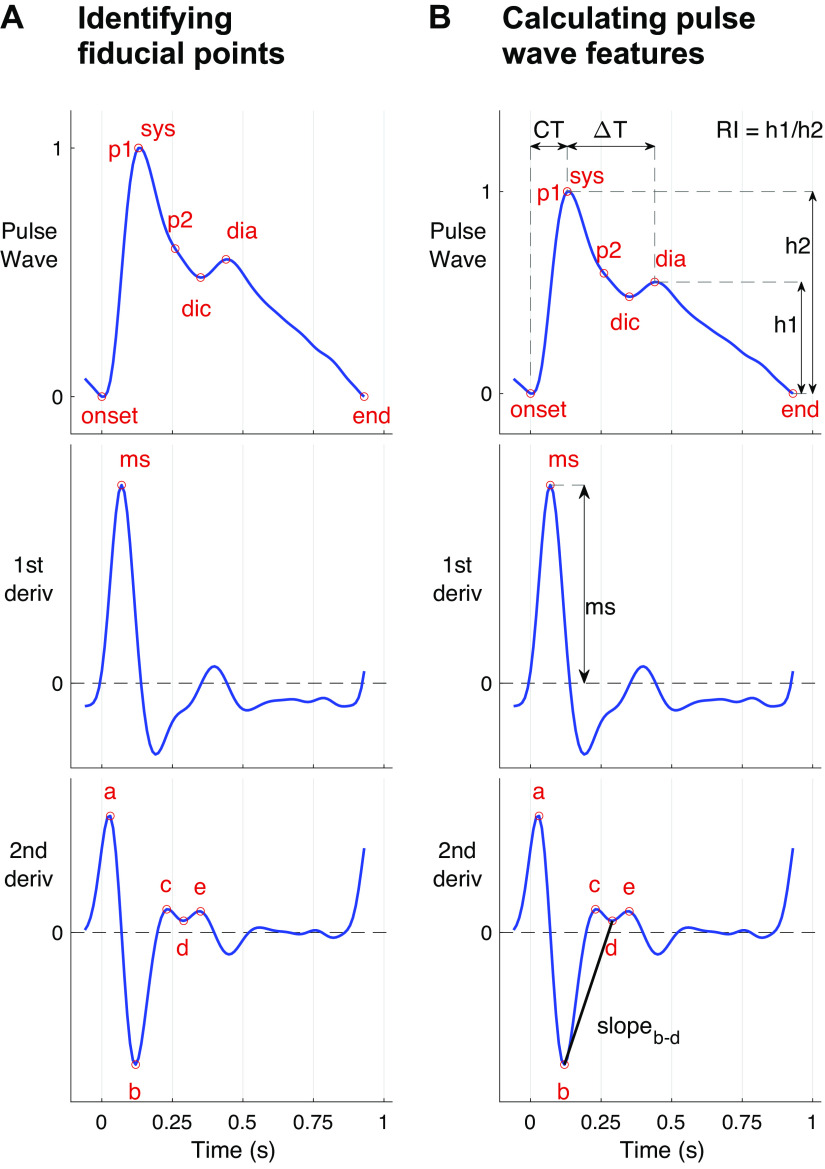
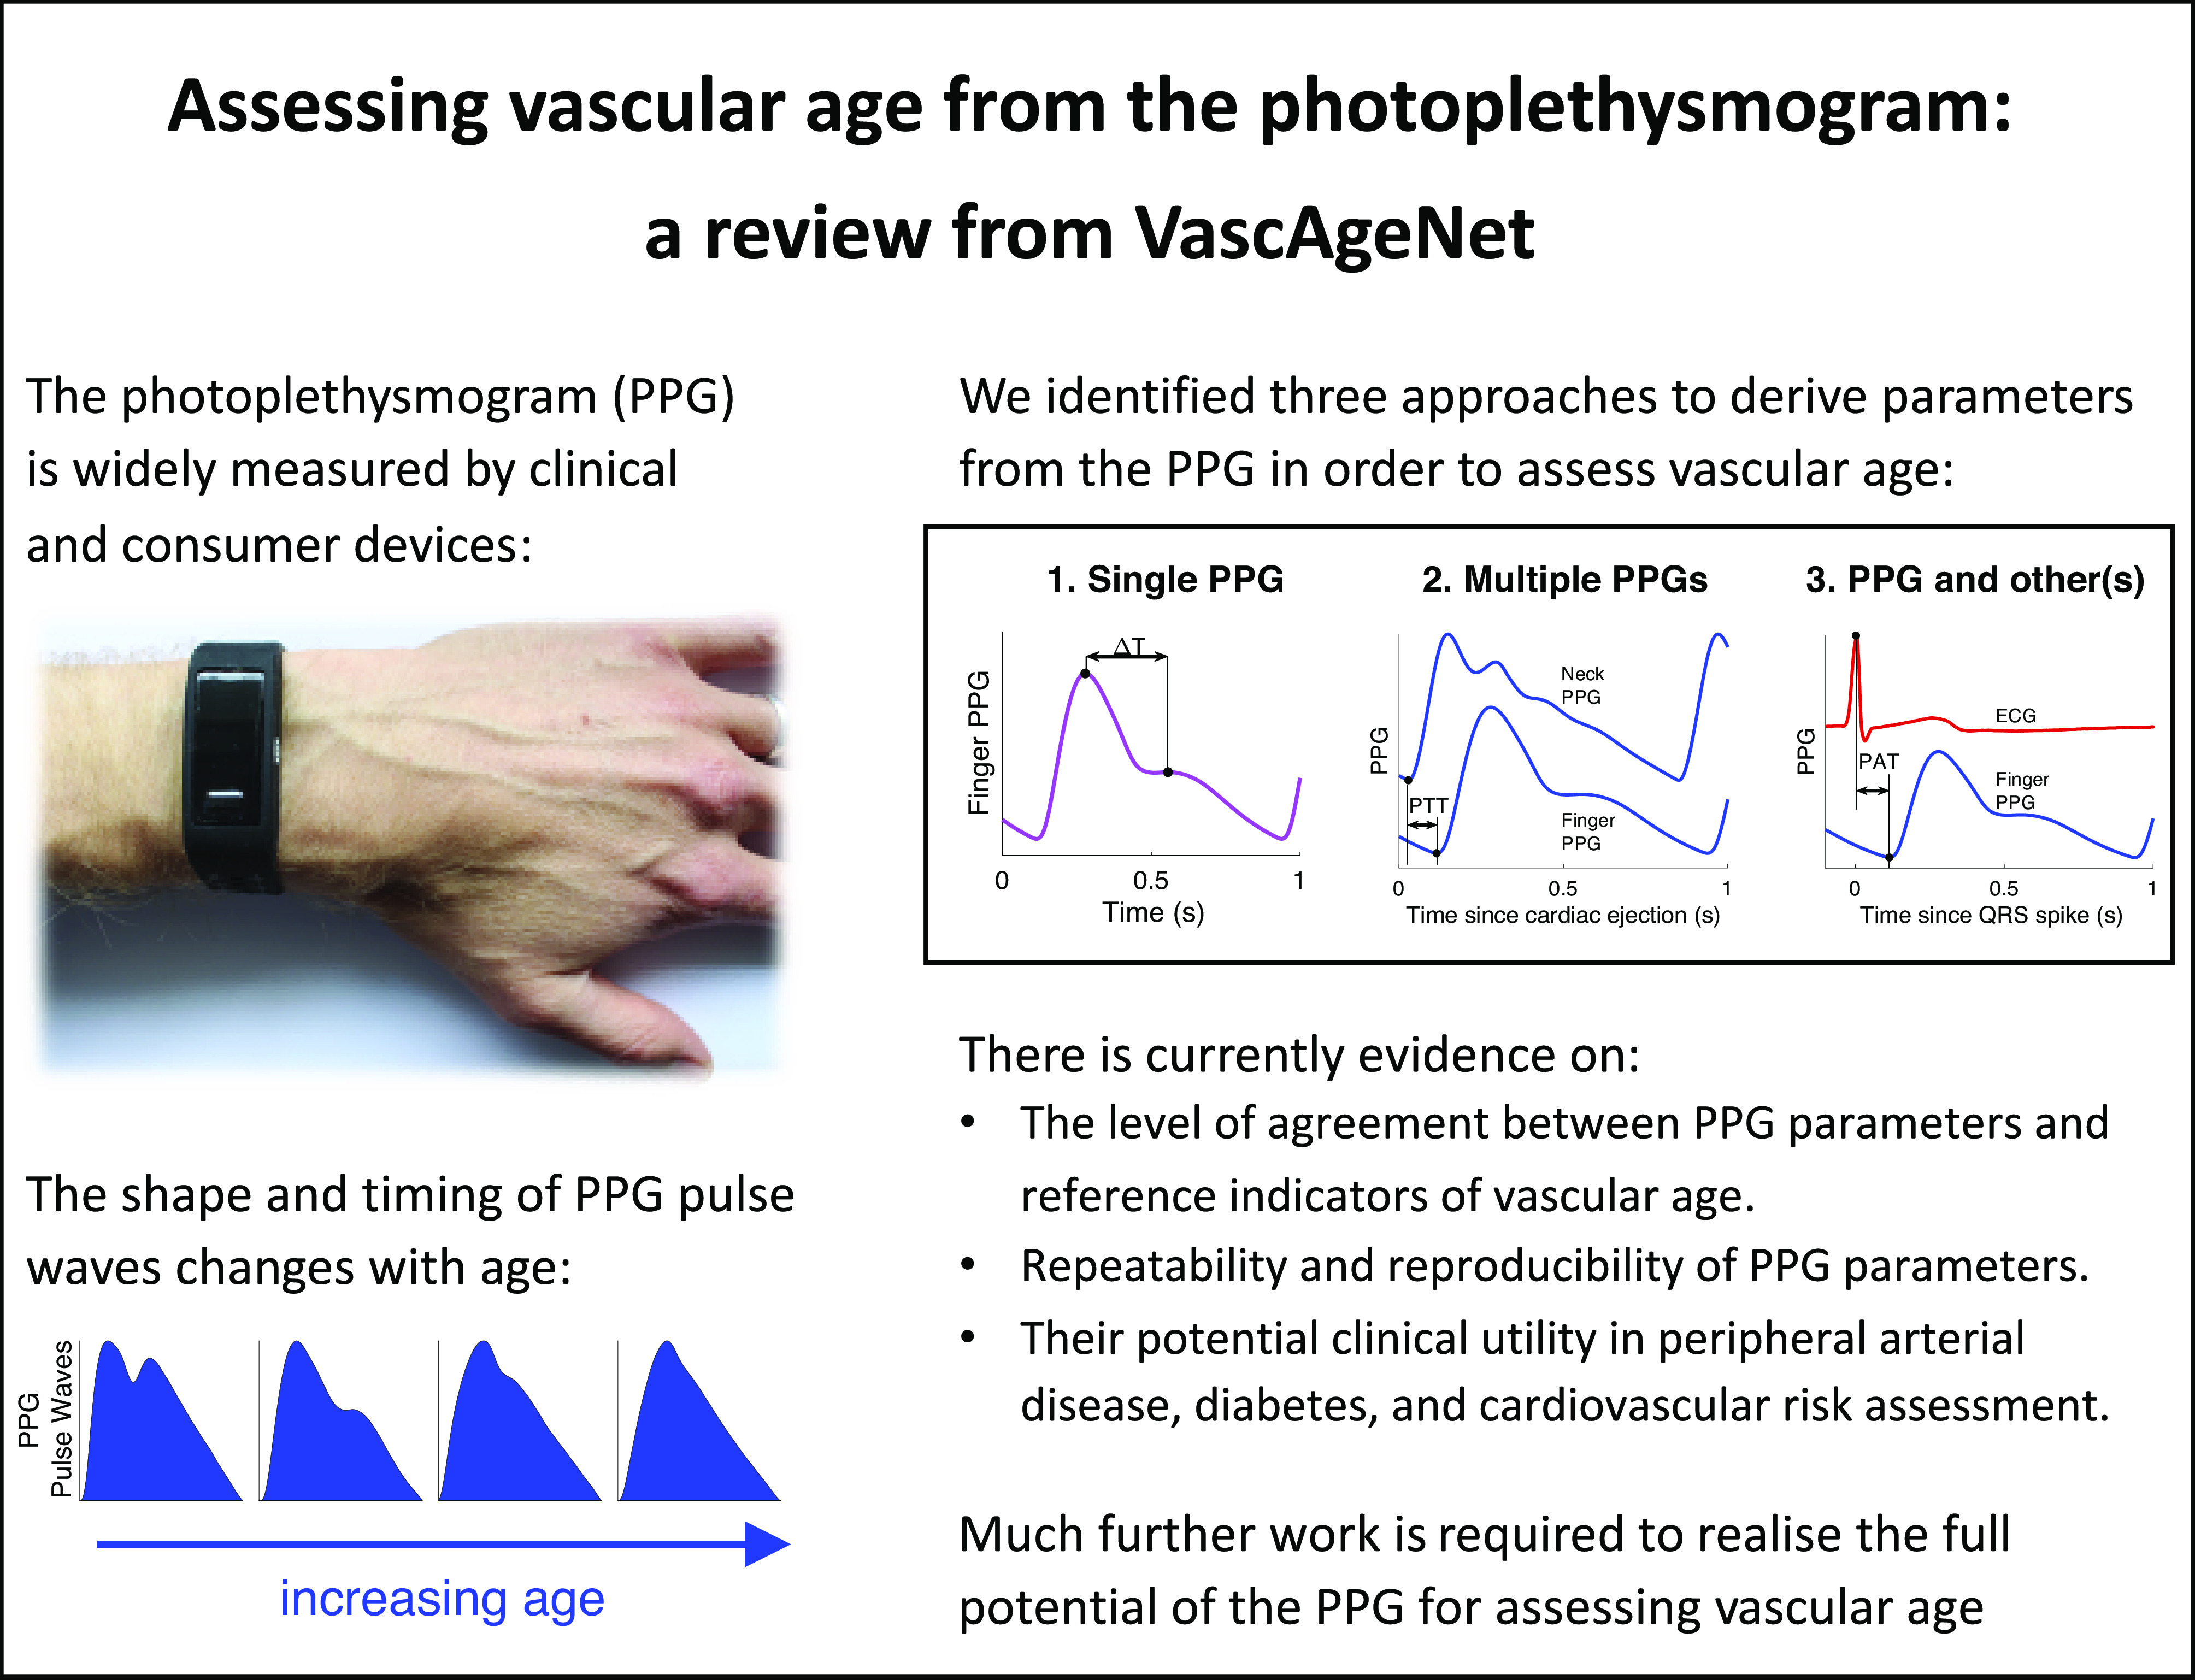
The photoplethysmogram (PPG) signal is widely measured by clinical and consumer devices, and it is emerging as a potential tool for assessing vascular age. The shape and timing of the PPG pulse wave are both influenced by normal vascular aging, changes in arterial stiffness and blood pressure, and atherosclerosis. This review summarizes research into assessing vascular age from the PPG. Three categories of approaches are described: 1) those which use a single PPG signal (based on pulse wave analysis), 2) those which use multiple PPG signals (such as pulse transit time measurement), and 3) those which use PPG and other signals (such as pulse arrival time measurement). Evidence is then presented on the performance, repeatability and reproducibility, and clinical utility of PPG-derived parameters of vascular age. Finally, the review outlines key directions for future research to realize the full potential of photoplethysmography for assessing vascular age.

Keywords: arterial stiffness; arteriosclerosis; atherosclerosis; blood pressure; photoplethysmography; pulse wave velocity.


Conflict of interest statement

S. Zanelli collaborates with Axelife, a company that designs and develops PPG-based medical devices. D. Kulin is shareholder and employee in E-Med4All Europe Ltd., a Hungarian med-tech startup developing various PPG-based telemedicine solutions. M. Hallab is CEO of Axelife and has authored patents used by Axelife. E. Bianchini is co-founder of QUIPU s.r.l., Pisa, Italy, a spin-off company of the Italian National Research Council and the University of Pisa developing medical software for ultrasound image processing. V. Dittrich is CEO and shareholder of Redwave Medical GmbH, a company developing medical algorithms for pulse wave analysis. None of the other authors has any conflicts of interest, financial or otherwise, to disclose.

Figures

Figure 1.
Figure 1.
Devices for measuring the photoplethysmogram (PPG) signal. The PPG can be measured by several clinical and consumer devices, including (clockwise from top left): wristbands, pulse oximeters (×2), smart rings, hearables, smartwatches (×2), webcams, and smartphones. Sources (clockwise from top): P. H. Charlton, Max Health Band (“https://commons.wikimedia.org/wiki/File:Max_Health_Band.jpg”) (“https://creativecommons.org/licenses/by/4.0/” CC BY 4.0); P. H. Charlton, Wrist pulse oximeter (“https://commons.wikimedia.org/wiki/File:Wrist_pulse_oximeter.jpg”) (“https://creativecommons.org/licenses/by/4.0/” CC BY 4.0); Stefan Bellini, Pulox Pulse Oximeter (“https://commons.wikimedia.org/wiki/File:Pulox_Pulse_Oximeter.JPG”) (“https://creativecommons.org/publicdomain/zero/1.0/” CC0 1.0) M. Verch, https://flickr.com/photos/160866001@N07/32586534637/ (“https://creativecommons.org/licenses/by/2.0/” CC BY 2.0); S. Passler et al. (242) https://doi.org/10.3390/s19173641 (“https://creativecommons.org/licenses/by/4.0/” CC BY 4.0); GEEK KAZU, https://www.flickr.com/photos/152342724@N04/36729615770/ (“https://creativecommons.org/licenses/by/2.0/” CC BY 2.0); L. Chesser, Apple_Watch_user_(Unsplash) (“https://commons.wikimedia.org/wiki/File:Apple_Watch_user_(Unsplash).jpg”) “https://creativecommons.org/publicdomain/zero/1.0/” CC0 1.0); Peter H. Charlton, Webcam on computer screen (“https://commons.wikimedia.org/wiki/File:Webcam_on_computer_screen.jpg”) (“https://creativecommons.org/licenses/by/4.0/deed.en” CC BY 4.0); (centre) P-H. Chan et al. (243) https://doi.org/10.1161/JAHA.116.003428 (Creative Commons Licence).
Figure 2.
Figure 2.
A summary of the identification and screening processes. PPG, photoplethysmogram.
Figure 3.
Figure 3.
Three approaches for assessing indicators of vascular age from the photoplethysmogram (PPG): Signal(s) are acquired from single or multiple sites (left). One of three approaches is then used to derive a parameter of vascular age from the following signals: 1) a single PPG, 2) multiple PPGs, or 3) PPG and other(s). An example of a regression equation for assessing an indicator of vascular age is provided for each approach: i) estimating aortic pulse wave velocity from the time delay between systolic and diastolic peaks on a PPG pulse wave; ii) estimating carotid-radial pulse wave velocity from the pulse transit time (PTT) between PPG pulse waves measured at different sites; iii) estimating systolic blood pressure from the pulse arrival time (PAT) between the QRS spike of an ECG signal, and the arrival of a PPG pulse wave at the finger. ECG, electrocardiogram; α and β, linear regression coefficients obtained during a calibration procedure. Sources: Mikael Häggström, Female shadow anatomy without labels (“https://commons.wikimedia.org/wiki/File:Female_shadow_anatomy_without_labels.png”) (public domain); “signal acquisition” signals—Institute of Biophysics, University of Belgrade; remaining PPG signals—the Pulse Wave Database under ODC PDDL v.1.0 (https://opendatacommons.org/licenses/pddl/1-0/) (4).
Figure 4.
Figure 4.
Classes of photoplethysmogram (PPG) pulse wave shape: Typical changes in PPG pulse wave shape with age, from young (left) to old (right). As described by Dawber et al. (244): class 1 waves exhibit an incisura; class 2 show a horizontal on the line of descent; class 3 show a change in gradient on the downslope; class 4 shows no evidence of a notch. Pulse waves were measured using infrared reflection mode photoplethysmography, and were obtained from the Vortal dataset (245). Source: P. H. Charlton, “Classes of photoplethysmogram (PPG) pulse wave shape (https://commons.wikimedia.org/wiki/File:Classes_of_photoplethysmogram_(PPG)_pulse_wave_shape.svg)” (CC BY 4.0).
Figure 5.
Figure 5.
Extracting features from photoplethysmogram (PPG) pulse waves. Features can be extracted from a single PPG pulse wave in two steps: A) identifying fiducial points on the pulse wave, such as systolic (sys) and diastolic (dia) peaks, dicrotic notch (dic), early and late systolic peaks (p1 and p2), the slope of the rising front (ms), and a, c, e peaks and b and d troughs of the 2nd derivative; and B) calculating features from the amplitudes and timings of these points, such as the time from pulse onset to sys (CT), the time from sys to dia (ΔT), the reflection index (RI), the maximum upslope (ms), and the slope between b and d troughs (slopeb-d). Sources: A: P.H. Charlton, “Photoplethysmogram (PPG) pulse wave fiducial points” (https://commons.wikimedia.org/wiki/File:Photoplethysmogram_(PPG)_pulse_wave_fiducial_points.svg) (CC BY 4.0); B: P.H. Charlton, “Photoplethysmogram (PPG) pulse wave indices (https://commons.wikimedia.org/wiki/File:Photoplethysmogram_(PPG)_pulse_wave_indices.svg)” (CC BY 4.0).
Figure 6.
Figure 6.
A graphical summary of the key conclusions. Wristband adapted from P. H. Charlton, “Max Health Band” (CC BY 4.0). Pulse waves adapted from: P. H. Charlton, “Classes of photoplethysmogram (PPG) pulse wave shape” (CC BY 4.0).
Figure A1.
Figure A1.
The number of included articles published per year.

References

    1. Hamczyk MR, Nevado RM, Barettino A, Fuster V, Andrés V. Biological versus chronological aging: JACC focus seminar. J Am Coll Cardiol 75: 919–930, 2020. doi: 10.1016/j.jacc.2019.11.062. - DOI - PubMed
    1. O’Rourke M, Nichols WW, Vlachopoulos C. McDonald’s Blood Flow in Arteries (6th ed.). London, UK: Hodder Arnold, 2011.
    1. O’Rourke M. Arterial stiffness, systolic blood pressure, and logical treatment of arterial hypertension. Hypertension 15: 339–347, 1990. doi: 10.1161/01.HYP.15.4.339. - DOI - PubMed
    1. Charlton PH, Mariscal Harana J, Vennin S, Li Y, Chowienczyk P, Alastruey J. Modeling arterial pulse waves in healthy aging: a database for in silico evaluation of hemodynamics and pulse wave indexes. Am J Physiol Heart Circ Physiol 317: H1062–H1085, 2019. doi: 10.1152/ajpheart.00218.2019. - DOI - PMC - PubMed
    1. Vlachopoulos C, Aznaouridis K, Stefanadis C. Prediction of cardiovascular events and all-cause mortality with arterial stiffness: a systematic review and meta-analysis. J Am Coll Cardiol 55: 1318–1327, 2010. doi: 10.1016/j.jacc.2009.10.061. - DOI - PubMed

Publication types

LinkOut - more resources