. 2021 Dec 24:10:e70535.
doi: 10.7554/eLife.70535.

Molecular determinants of phase separation for Drosophila DNA replication licensing factors

Affiliations

Molecular determinants of phase separation for Drosophila DNA replication licensing factors

Matthew W Parker et al. Elife. .

Abstract

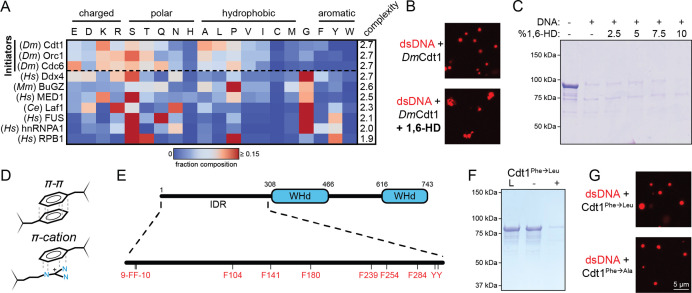
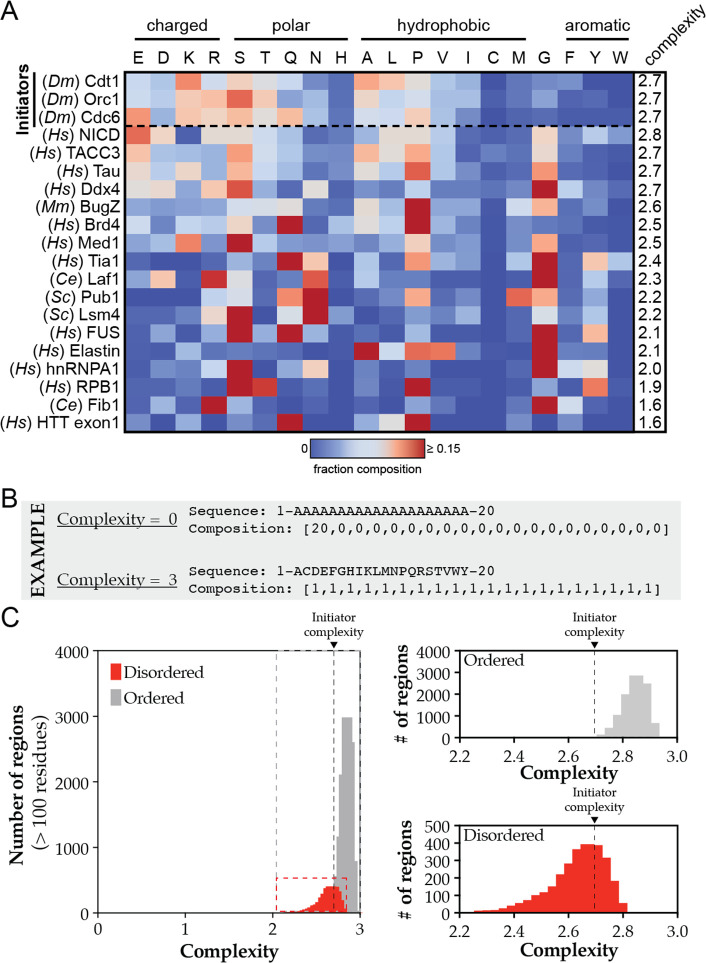
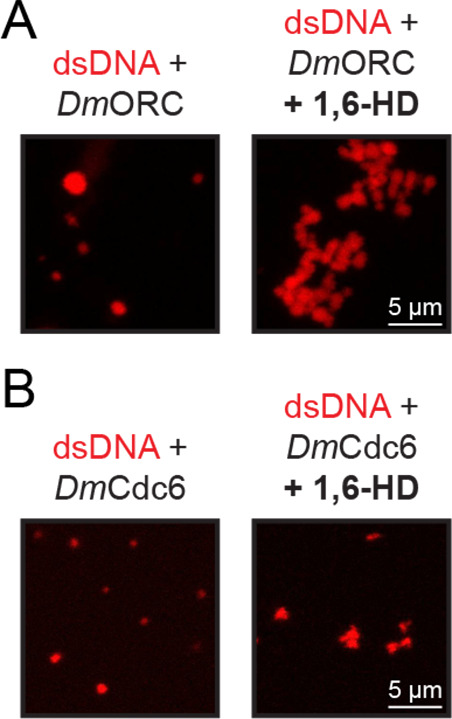
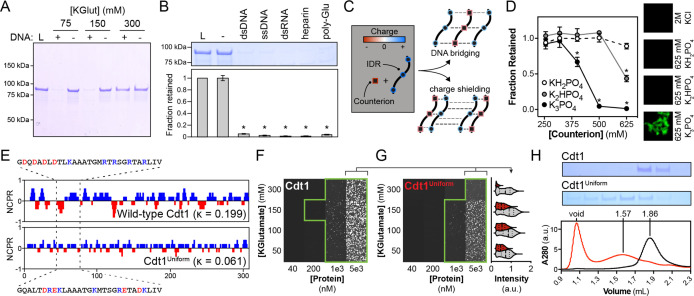
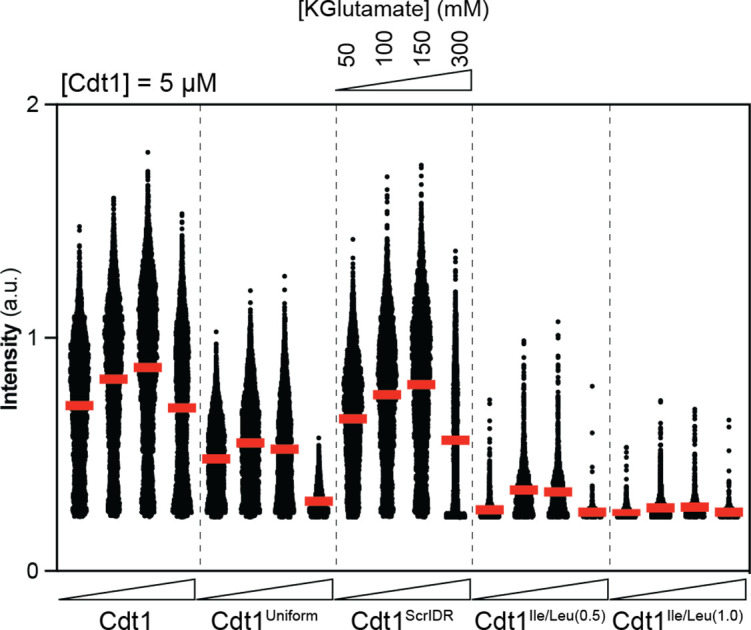
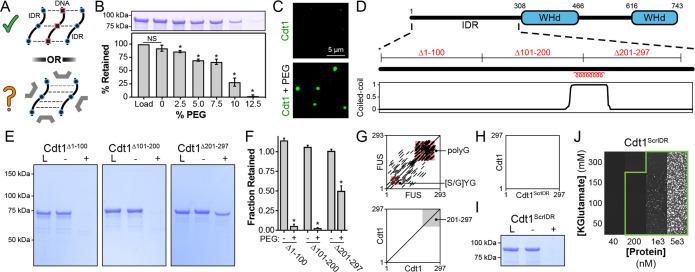
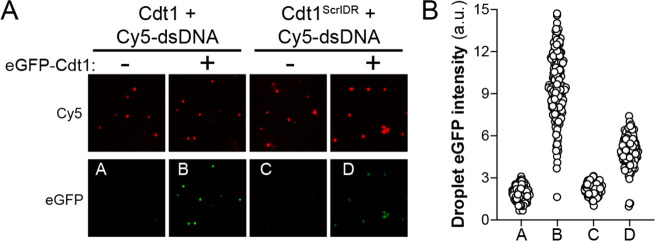
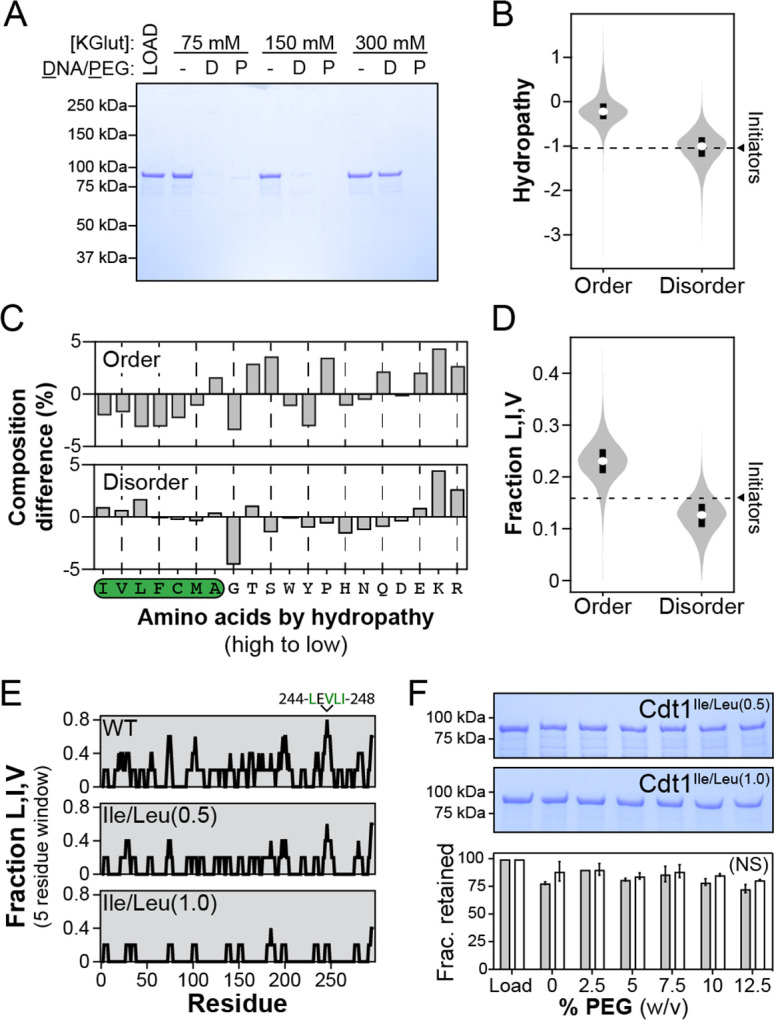
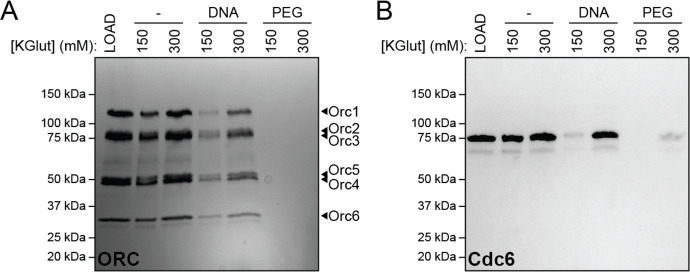
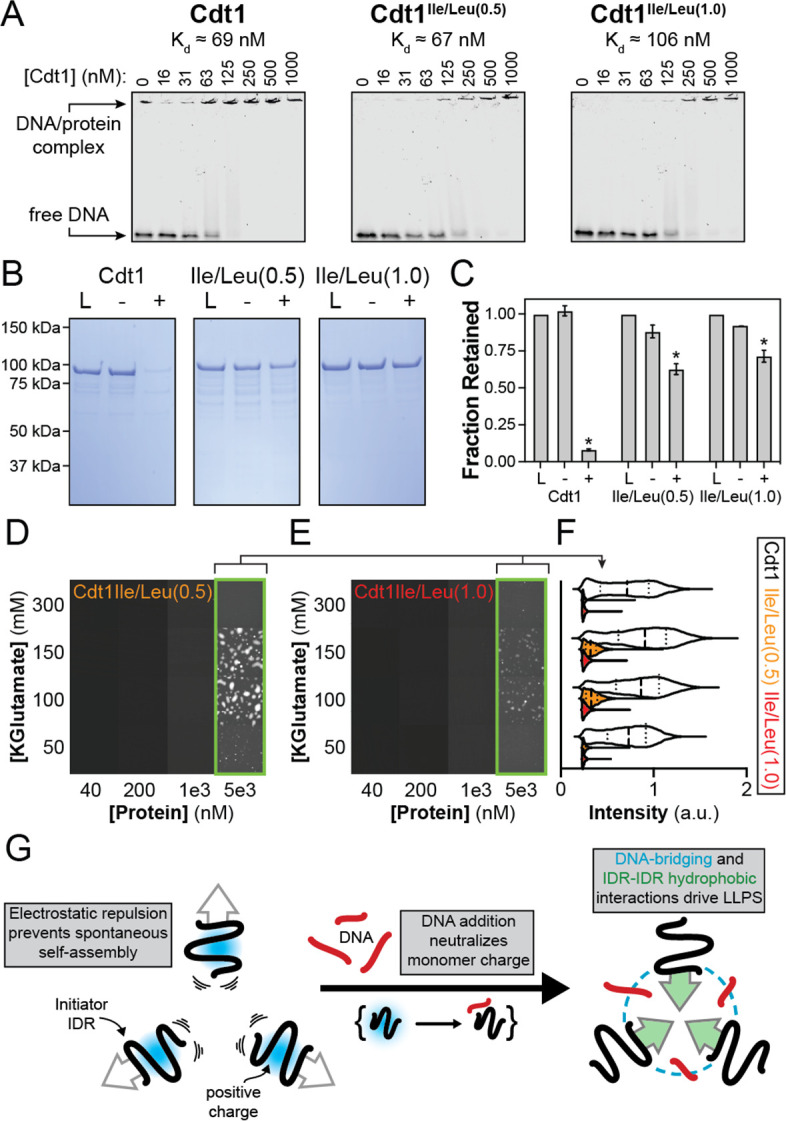
Liquid-liquid phase separation (LLPS) of intrinsically disordered regions (IDRs) in proteins can drive the formation of membraneless compartments in cells. Phase-separated structures enrich for specific partner proteins and exclude others. Previously, we showed that the IDRs of metazoan DNA replication initiators drive DNA-dependent phase separation in vitro and chromosome binding in vivo, and that initiator condensates selectively recruit replication-specific partner proteins (Parker et al., 2019). How initiator IDRs facilitate LLPS and maintain compositional specificity is unknown. Here, using Drosophila melanogaster (Dm) Cdt1 as a model initiation factor, we show that phase separation results from a synergy between electrostatic DNA-bridging interactions and hydrophobic inter-IDR contacts. Both sets of interactions depend on sequence composition (but not sequence order), are resistant to 1,6-hexanediol, and do not depend on aromaticity. These findings demonstrate that distinct sets of interactions drive condensate formation and specificity across different phase-separating systems and advance efforts to predict IDR LLPS propensity and partner selection a priori.

Keywords: D. melanogaster; DNA binding proteins; DNA replication; biochemistry; chemical biology; intrinsically disordered proteins; liquid phase condensates.


Conflict of interest statement

MP, JK, AH No competing interests declared, JB, MB Reviewing editor, eLife

Figures

Figure 1.
Figure 1.. Initiator phase separation is insensitive to 1,6-hexanediol (1,6-HD) and does not require aromatic residues.
(A) Heatmap representation of the amino acid composition of the three Drosophila initiation factors (Cdt1, Orc1, and Cdc6) compared to other phase-separating disordered sequences. (B) Confocal fluorescence microscopy images of condensates formed with 5 µM Cy5-double-stranded DNA (dsDNA) and 5 µM Cdt1 in the absence (top) and presence (bottom) of 1,6-hexanediol. (C) 2 µM Cdt1 was combined with 2 µM dsDNA and phase separation was assessed with a depletion assay in the presence of increasing concentrations (wt/vol) of 1,6-HD. Phase separation is indicated by protein loss. (D) Aromatic residues contribute to the phase separation of many condensate systems through their ability to participate in π–π and π–cation interactions. (E) Schematic of the D. melanogaster Cdt1 protein (top). Cdt1 contains two winged-helix domains (WHd, blue) and an N-terminal disordered domain (black line). The N-terminal intrinsically disordered region (IDR) contains multiple aromatic residues distributed throughout its length (bottom). (F) Depletion assay results assessing phase separation of the Cdt1 aromatic mutant, Cdt1Phe→Leu. For this construct, all phenylalanine residues have been mutated to leucine. ‘L’ is a load control, ‘-’ is in the absence of DNA, and ‘+’ is in the presence of DNA. (G) Confocal fluorescence microscopy images of condensates formed with 5 µM Cy5-dsDNA and either Cdt1Phe→Leu (top) or Cdt1Phe→Ala (bottom). Gel and microscopy images are representative from three independent experiments.
Figure 1—figure supplement 1.
Figure 1—figure supplement 1.. Heatmap analysis and complexity calculations for phase-separating disordered domains.
(A) Heatmap analysis of the amino acid composition of various phase-separating disordered sequences. Initiator IDRs are listed first and the remaining sequences are ordered according to their complexity score. (B) Theoretical sequences with the maximum and minimum complexity score. (C) Complexity scores for all predicted ordered (gray) and disordered (red) domains across the D. melanogaster proteome were calculated and plotted as a histogram. These visualizations are expanded in the right panels with the initiator complexity scores indicated by a dashed line.
Figure 1—figure supplement 2.
Figure 1—figure supplement 2.. D. melanogaster origin recognition complex (ORC) and Cdc6 phase separation is resistant to treatment with 1,6-hexanediol.
(A) 2.5 µM ORC was combined with 2.5 µM Cy5-double-stranded DNA (dsDNA) and phase separation assessed by confocal fluorescence microscopy in the absence (left) and presence (right) of 10% 1,6-hexanediol. (B) 5 µM Cdc6 was combined with 5 µM Cy5-dsDNA and phase separation assessed by confocal fluorescence microscopy in the absence (left) and presence (right) of 10% 1,6-hexanediol.
Figure 2.
Figure 2.. DNA contributes adhesive interactions to Cdt1 liquid–liquid phase separation (LLPS) by acting as a counterion bridge.
(A) DNA-induced phase separation was assessed by the depletion assay in buffer containing 75, 150, or 300 mM potassium glutamate (KGlut). Cdt1 LLPS was observed at 75 and 150 mM KGlut, but not at 300 mM KGlut. (B) Multiple anionic polyelectrolytes were assessed for their ability to induce Cdt1 phase separation by the depletion assay. ‘L’ indicates a load control and ‘-’ is in the absence of any anion polymer. Double-stranded DNA (dsDNA), single-stranded DNA (ssDNA), dsRNA, heparin, and poly-Glutamate (poly-Glu) all effectively induced Cdt1 LLPS. A t-test was used to calculate whether a significant change in pelleting resulted from the addition of each polyanion compared to the negative (‘-’) control. (C) Two models explaining the ability of DNA to induce Cdt1 phase separation. (Top) DNA (black/red) functions as a counterion bridge to facilitate inter-IDR (blue/red) interactions. (Bottom) DNA neutralizes inter-IDR electrostatic repulsion to drive self-assembly. (D) Monovalent (KH2PO4) and multivalent (K2HPO4 and K3PO4) phosphate counterions were assessed for the ability to induce Cdt1 phase separation by the depletion assay and fluorescence microscopy. For the line plot (left), the fraction of Cdt1 retained in the depletion assay was quantitated and plotted against counterion concentration (mM). For the microscopy experiment (right), 5 µM eGFP-Cdt1 was combined with 2 M KCl, 625 mM KH2PO4, 625 mM K2HPO4, or 625 mM K3PO4 (top to bottom) and assessed for droplet formation by confocal fluorescence microscopy. Concentrated and highly networked species were observed only in the presence of K3PO4. (E) Plot of the net charge per residue (NCPR) over a 5-residue sliding window for Cdt1 and the charged residue variant, Cdt1Uniform. (F-G) Phase diagrams for stoichiometric combinations of Cy5-dsDNA and Cdt1 (F) or Cdt1Uniform (G) at different protein and KGlutamate concentrations. Tiles bordered in green show conditions where phase separation was observed. Each tile is 75 × 75 µm. The mean signal intensity for Cy5-dsDNA within each droplet was quantitated for 5 µM Cdt1 (gray) and Cdt1Uniform (red) across the four salt concentrations. All pairwise comparisons are significantly different (p < 0.05 as determined by t-test). (H) Analytical size exclusion chromatography analysis of Cdt1 and Cdt1Uniform. Cdt1Uniform adopts a more extended conformation in solution as evidenced by a lower retention volume and copurifies with nucleic acid (260/280 = 0.56 and 0.79 for Cdt1 and Cdt1Uniform, respectively). *p < 0.05, t-test. Gel and microscopy images are representative from three independent experiments.
Figure 2—figure supplement 1.
Figure 2—figure supplement 1.. Quantitative comparison of DNA enrichment in condensates formed by 5 µM wild-type and variant Cdt1s at 50, 100, 150, and 300 mM KGlutamate concentrations.
Images from phase diagram experiments were used to calculate the mean Cy5-double-stranded DNA (dsDNA) signal in condensates and individual condensate values were plotted as a scatter plot for each experimental condition. Each dot represents a different condensate. Red horizontal bars indicate mean intensity overall.
Figure 3.
Figure 3.. Inter-intrinsically disordered region (IDR) cohesive interactions drive Cdt1 phase separation in the absence of DNA.
(A) (Top) DNA (black/red) can induce Cdt1 (black/blue) phase separation by acting as a counterion bridge. (Bottom) To what extent homotypic inter-IDR interactions affect phase separation was unknown. (B) Depletion assay to assess phase separation of 8 µM Cdt1 in the presence of increasing concentrations of PEG-3350 (0–12%, wt/vol). (C) Phase separation of 5 µM eGFP-labeled Cdt1 was assessed by confocal fluorescence microscopy in the absence (top) and presence (bottom) of 4% PEG-3350. (D) Schematic representation of the domain architecture of D. melanogaster Cdt1 (top) with coiled-coil domain prediction for the Cdt1 N-terminal IDR (bottom). The position of the three approximately 100 amino acid deletions used in (E) are indicated. (E) Cdt1∆1–100 (left), Cdt1∆101–200 (middle), and Cdt1∆201–297 (right) were assayed for the ability to undergo PEG-induced phase separation by the depletion assay. ‘L’ is a load control, ‘-’ is in the absence of PEG, and ‘+’ is in the presence of PEG. (F) Quantitation of depletion assay results presented in (E). A t-test was used to calculate whether a significant change in pelleting occurred in the presence compared to the absence of PEG. (G) Dotplot analysis (EMBOSS Dotmatcher; Madeira et al., 2019) of repetitive elements in the human Fused in Sarcoma (FUS) intrinsically disordered domain (top) and Cdt1 N-terminal IDR (bottom). The region representing Cdt1 amino acids 201–297 are highlighted with a gray background. The main diagonal represents sequence homology with itself and diagonals off the main diagonal represent repetitive motifs. Many repetitive motifs are apparent in FUS but are lacking in Cdt1. (H) Dotplot analysis of the Cdt1ScrIDR, a Cdt1 variant with N-terminal IDR residues randomly scrambled, versus the wild-type Cdt1 IDR. (I) Depletion assay to assess phase separation of Cdt1ScrIDR. ‘L’ is a load control, ‘-’ is in the absence of PEG, and ‘+’ is in the presence of PEG. (J) Phase diagram for stoichiometric amounts of Cdt1ScrIDR and Cy5-double-stranded DNA (dsDNA) at variable protein and KGlutamate concentrations. Tiles bordered in green show conditions where phase separation was observed. Each tile is 75 × 75 µm. *p < 0.05, t-test. Gel and microscopy images are representative from three independent experiments.
Figure 3—figure supplement 1.
Figure 3—figure supplement 1.. Depletion assay analysis of PEG-induced phase separation propensity for a Cdt1 variant lacking a predicted coiled-coil region.
‘L’ is a load control, ‘-’ is in the absence of PEG, and ‘+’ is in the presence of PEG.
Figure 3—figure supplement 2.
Figure 3—figure supplement 2.. Dotplot analysis of various phase-separating intrinsically disordered regions (IDRs) to identify the presence of repetitive motifs.
EMBOSS Dotmatcher (Madeira et al., 2019) was used to assess the presence of repetitive elements in the IDRs of (A) Laf1, (B) Ddx4, (C) hnRNPA1, (D) RPB1, (E) MED1, and (F) BuGZ. All proteins analyzed contain short repetitive motifs.
Figure 3—figure supplement 3.
Figure 3—figure supplement 3.. Cdt1ScrIDR condensates can recruit wild-type Cdt1.
(A) Droplets were prepared with 5 µM Cy5-double-stranded DNA (dsDNA) and either 5 µM wild-type Cdt1 (left two columns) or 5 µM Cdt1ScrIDR (right two columns) and 1 µM eGFP-tagged Cdt1 was subsequently added to each reaction. Samples were imaged by fluorescence microscopy. (B) Quantitation of panel (A). The level of eGFP-Cdt1 recruitment was assessed by calculating green signal intensity within the droplets containing Cy5-dsDNA and either Cdt1 or Cdt1ScrIDR.
Figure 4.
Figure 4.. Branched hydrophobic residues underlie Cdt1 homotypic inter-intrinsically disordered region (IDR) interactions.
(A) The depletion assay was used to assess the salt-sensitivity of PEG-induced phase separation side-by-side with DNA-induced phase separation. ‘LOAD’ is a load control, ‘-’ is in the absence of DNA and PEG, ‘D’ indicates the addition of DNA, and ‘P’ indicates the addition of PEG-3350. Cdt1 phase separation was assessed at 75, 150, and 300 mM KGlutamate (‘KGlut’). (B) Comparison of initiator IDR hydropathy (dashed line indicates the average hydropathy of the Orc1, Cdc6, and Cdt1 IDRs) to the hydropathy of predicted ordered domains (‘Order’) and disordered domains (‘Disorder’) proteome wide. (C) Percent difference in initiator IDR amino acid composition relative to all predicted ordered (top) and disordered (bottom) domains proteome wide. The amino acids are ordered from high to low hydropathy (left to right) and those with a positive hydropathy value are indicated by a green background. (D) Comparison of initiator IDR fraction Leu, Ile, and Val (dashed line indicates the average fraction-L,I,V of the Orc1, Cdc6, and Cdt1 IDRs) to the fraction-L,I,V of all predicted ordered domains (‘Order’) and disordered domains (‘Disorder’) proteome wide. (E) To assess the distribution of branched hydrophobic residues, the fraction-L,I,V was calculated over a 5-residue sliding window for the Cdt1 IDR (top). Two mutants were made with either half (Cdt1Ile/Leu(0.5)) or all (Cdt1Ile/Leu(1.0)) of Leu and Ile residues mutated to Ala, and the distribution of L,I,V was calculated for each (middle and bottom, respectively). (F) The depletion assay was used to assess the phase separation capacity of Cdt1Ile/Leu(0.5) (top gel) and Cdt1Ile/Leu(1.0) (bottom gel) in the presence of increasing concentrations of PEG-3350 (0–12%, wt/vol). The fraction of protein retained at each concentration of PEG-3350 was quantitated. A t-test was used to calculate whether the different PEG concentrations resulted in a significant change in pelleting relative to the no PEG control. No significant (‘NS’) dose-dependent trend was identified for the effect of PEG on Cdt1Ile/Leu(0.5) (grey bars) or Cdt1Ile/Leu(1.0) (white bars) phase separation. Gel images are representative from three independent experiments.
Figure 4—figure supplement 1.
Figure 4—figure supplement 1.. DNA-induced phase separation of origin recognition complex (ORC) and Cdc6 is sensitive to salt but PEG-induced liquid–liquid phase separation (LLPS) is not.
The depletion assay was used to assess the salt-sensitivity of PEG-induced phase separation side-by-side with DNA-induced phase separation. (A) Phase separation of ORC (2 µM) and (B) Cdc6 (4 µM) was assessed at 150 and 300 mM KGlutamate (‘KGlut’). ‘LOAD’ is a load control, ‘-’ is in the absence of DNA and PEG.
Figure 5.
Figure 5.. Homotypic inter-intrinsically disordered region (IDR) interactions underlie DNA-induced initiator phase separation.
(A) An electrophoretic mobility shift assay (EMSA) was used to assess the binding affinity of Cdt1 (left), Cdt1Ile/Leu(0.5) (middle) and Cdt1Ile/Leu(1.0) (right) for double-stranded DNA (dsDNA). Binding was assessed with 10 nM IRDye800-labeled dsDNA and a titration of Cdt1 from 16 to 1000 nM. Each variant showed comparable affinity to wild-type Cdt1. (B) Depletion assay results assessing DNA-induced phase separation of Cdt1 (left), Cdt1Ile/Leu(0.5) (middle), and Cdt1Ile/Leu(1.0) (right). ‘L’ is a load control, ‘-’ is in the absence of DNA, and ‘+’ is in the presence of DNA. (C) Quantitation of the depletion assay results presented in (B). (D-E) Phase diagram for stoichiometric amounts of Cdt1Ile/Leu(0.5) (D) or Cdt1Ile/Leu(1.0) (E) and Cy5-dsDNA at variable protein and KGlutamate concentrations. Tiles bordered in green show conditions where phase separation was observed. Each tile is 75 × 75 µm. (F) Violin plot representation of the mean droplet intensity of Cy5-dsDNA at 5 µM protein concentration and variable KGlutamate concentrations for wild-type (white), Cdt1Ile/Leu(0.5) (orange), or Cdt1Ile/Leu(1.0) (red). (G) Our data support a model where, in the absence of DNA, inter-IDR electrostatic repulsion prevents spontaneous phase separation. The addition of DNA and resulting IDR-DNA interactions neutralize the initiator IDR charge which drives self-assembly through synergistic heteromeric DNA-bridging interactions and homomeric IDR-IDR hydrophobic interactions. *p < 0.05, t-test. Gel and microscopy images are representative from three independent experiments.
Figure 5—figure supplement 1.
Figure 5—figure supplement 1.. Heparin-binding propensity of Cdt1 and the Cdt1 branched hydrophobic residue variants, Cdt1Ile/Leu(0.5) and Cdt1Ile/Leu(1.0).
Cdt1 (top) and Cdt1 variants (middle and bottom) were applied to a heparin column and eluted off with a linear gradient of 150 mM to 1 M NaCl. All three proteins elute off at similar salt concentrations.
Figure 5—figure supplement 2.
Figure 5—figure supplement 2.. Analysis of Cdt1 intrinsically disordered region (IDR) conservation among Drosophilidaes and metazoans.
(A) Domain architecture of D. melanogaster Cdt1. (B) Sequence identity analysis for eleven metazoan Cdt1 orthologs. The blue regions correspond to the globular, winged-helix domains (WHd) of the protein. (C) Sequence identity analysis for forty Drosophilidae Cdt1 orthologs. (D) Scatter plot analysis of the number of minimal ([S/T]P) or full ([S/T]PX[R/K]) CDK/Cyc consensus motifs in metazoan IDRs versus IDR length. (E) Scatter plot analysis of the number of minimal ([S/T]P) or full ([S/T]PX[R/K]) CDK/Cyc consensus motifs in Drosophilidae IDRs versus IDR length.
Figure 5—figure supplement 3.
Figure 5—figure supplement 3.. Heatmap analysis of the amino acid composition of initiator intrinsically disordered regions (IDRs; Cdt1, Orc1, and Cdc6) and of an internal intrinsically disordered region (IDR) from Chiffon, the fly homolog of Dbf4.
These four proteins have similar amino acid sequence signatures, suggesting that Chiffon may undergo a similar DNA-dependent phase separation reaction or may copartition into initiator condensates.
Author response image 1.

References

    1. Babinchak WM, Haider R, Dumm BK, Sarkar P, Surewicz K, Choi JK, Surewicz WK. The role of liquid-liquid phase separation in aggregation of the TDP-43 low-complexity domain. The Journal of Biological Chemistry. 2019;294:6306–6317. doi: 10.1074/jbc.RA118.007222. - DOI - PMC - PubMed
    1. Baldinger T, Gossen M. Binding of Drosophila ORC proteins to anaphase chromosomes requires cessation of mitotic cyclin-dependent kinase activity. Molecular and Cellular Biology. 2009;29:140–149. doi: 10.1128/MCB.00981-08. - DOI - PMC - PubMed
    1. Banani SF, Lee HO, Hyman AA, Rosen MK. Biomolecular condensates: organizers of cellular biochemistry. Nature Reviews. Molecular Cell Biology. 2017;18:285–298. doi: 10.1038/nrm.2017.7. - DOI - PMC - PubMed
    1. Banjade S, Rosen MK. Phase transitions of multivalent proteins can promote clustering of membrane receptors. eLife. 2014;3:e04123. doi: 10.7554/eLife.04123. - DOI - PMC - PubMed
    1. Batty P, Gerlich DW. Mitotic Chromosome Mechanics: How Cells Segregate Their Genome. Trends in Cell Biology. 2019;29:717–726. doi: 10.1016/j.tcb.2019.05.007. - DOI - PubMed

Publication types

MeSH terms

Substances

LinkOut - more resources