. 2022 Feb 14;40(2):185-200.e6.
doi: 10.1016/j.ccell.2021.12.001. Epub 2021 Dec 23.

Reuterin in the healthy gut microbiome suppresses colorectal cancer growth through altering redox balance

Affiliations

Reuterin in the healthy gut microbiome suppresses colorectal cancer growth through altering redox balance

Hannah N Bell et al. Cancer Cell. .

Abstract

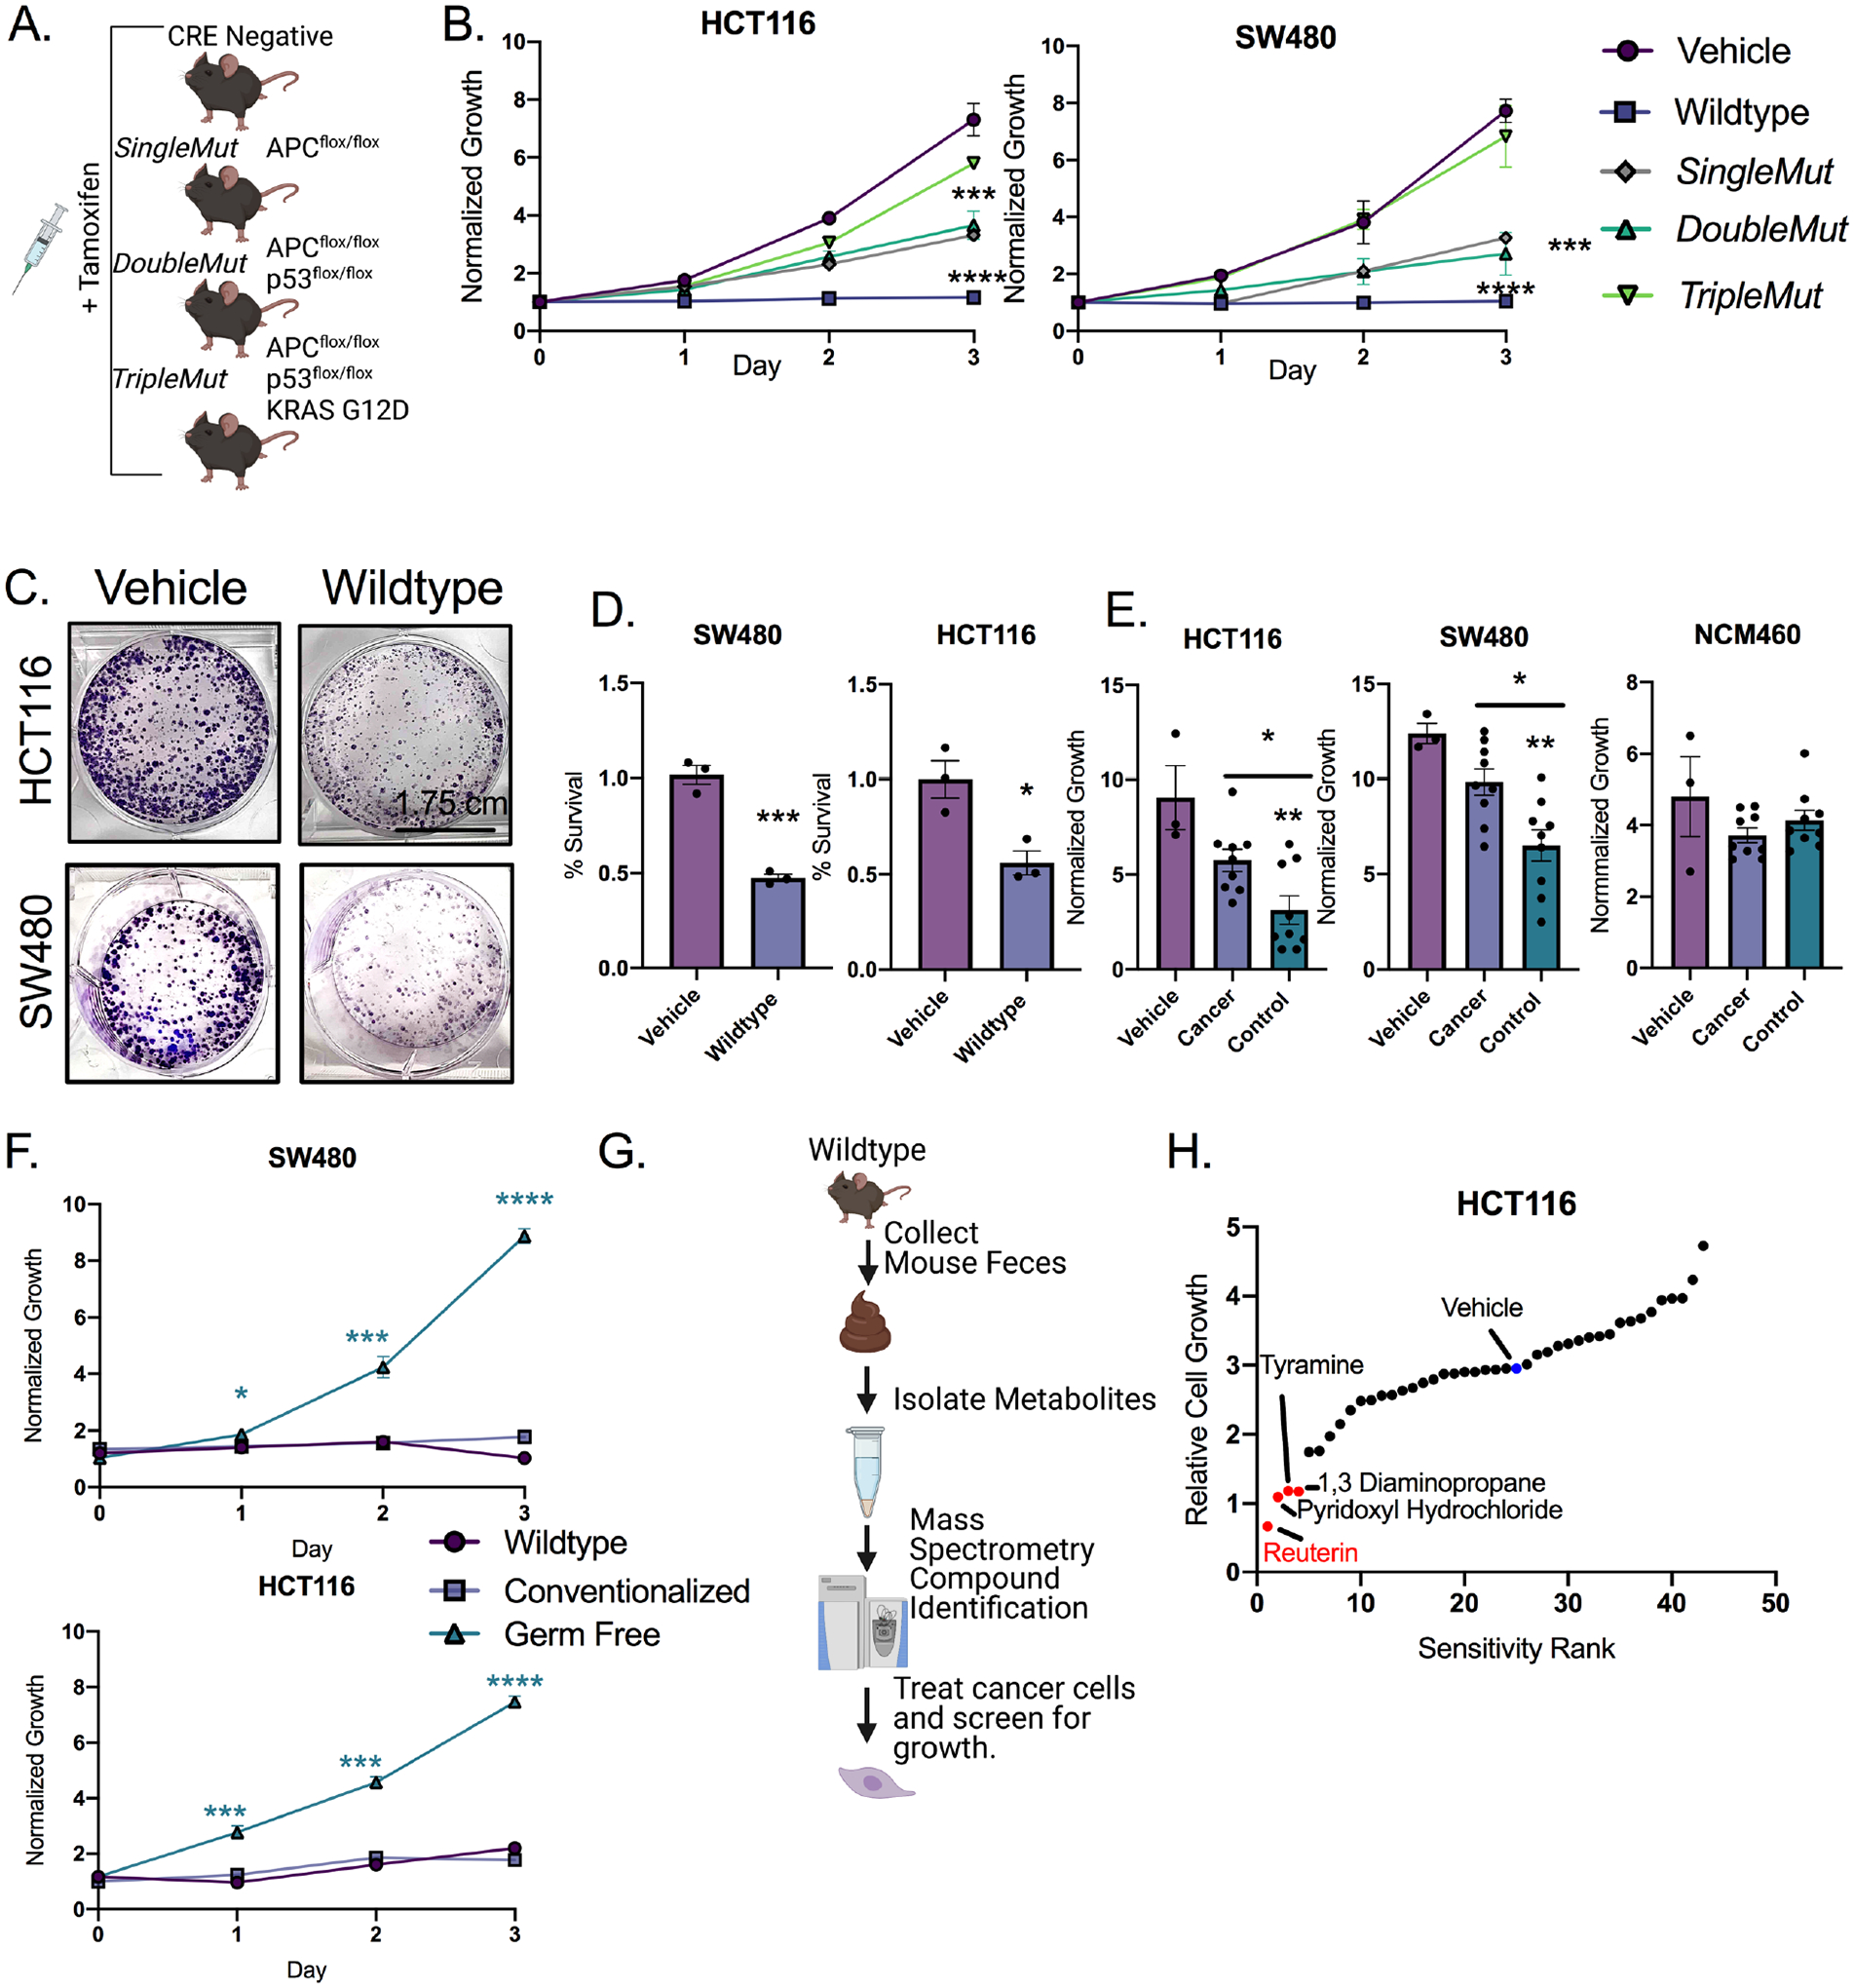
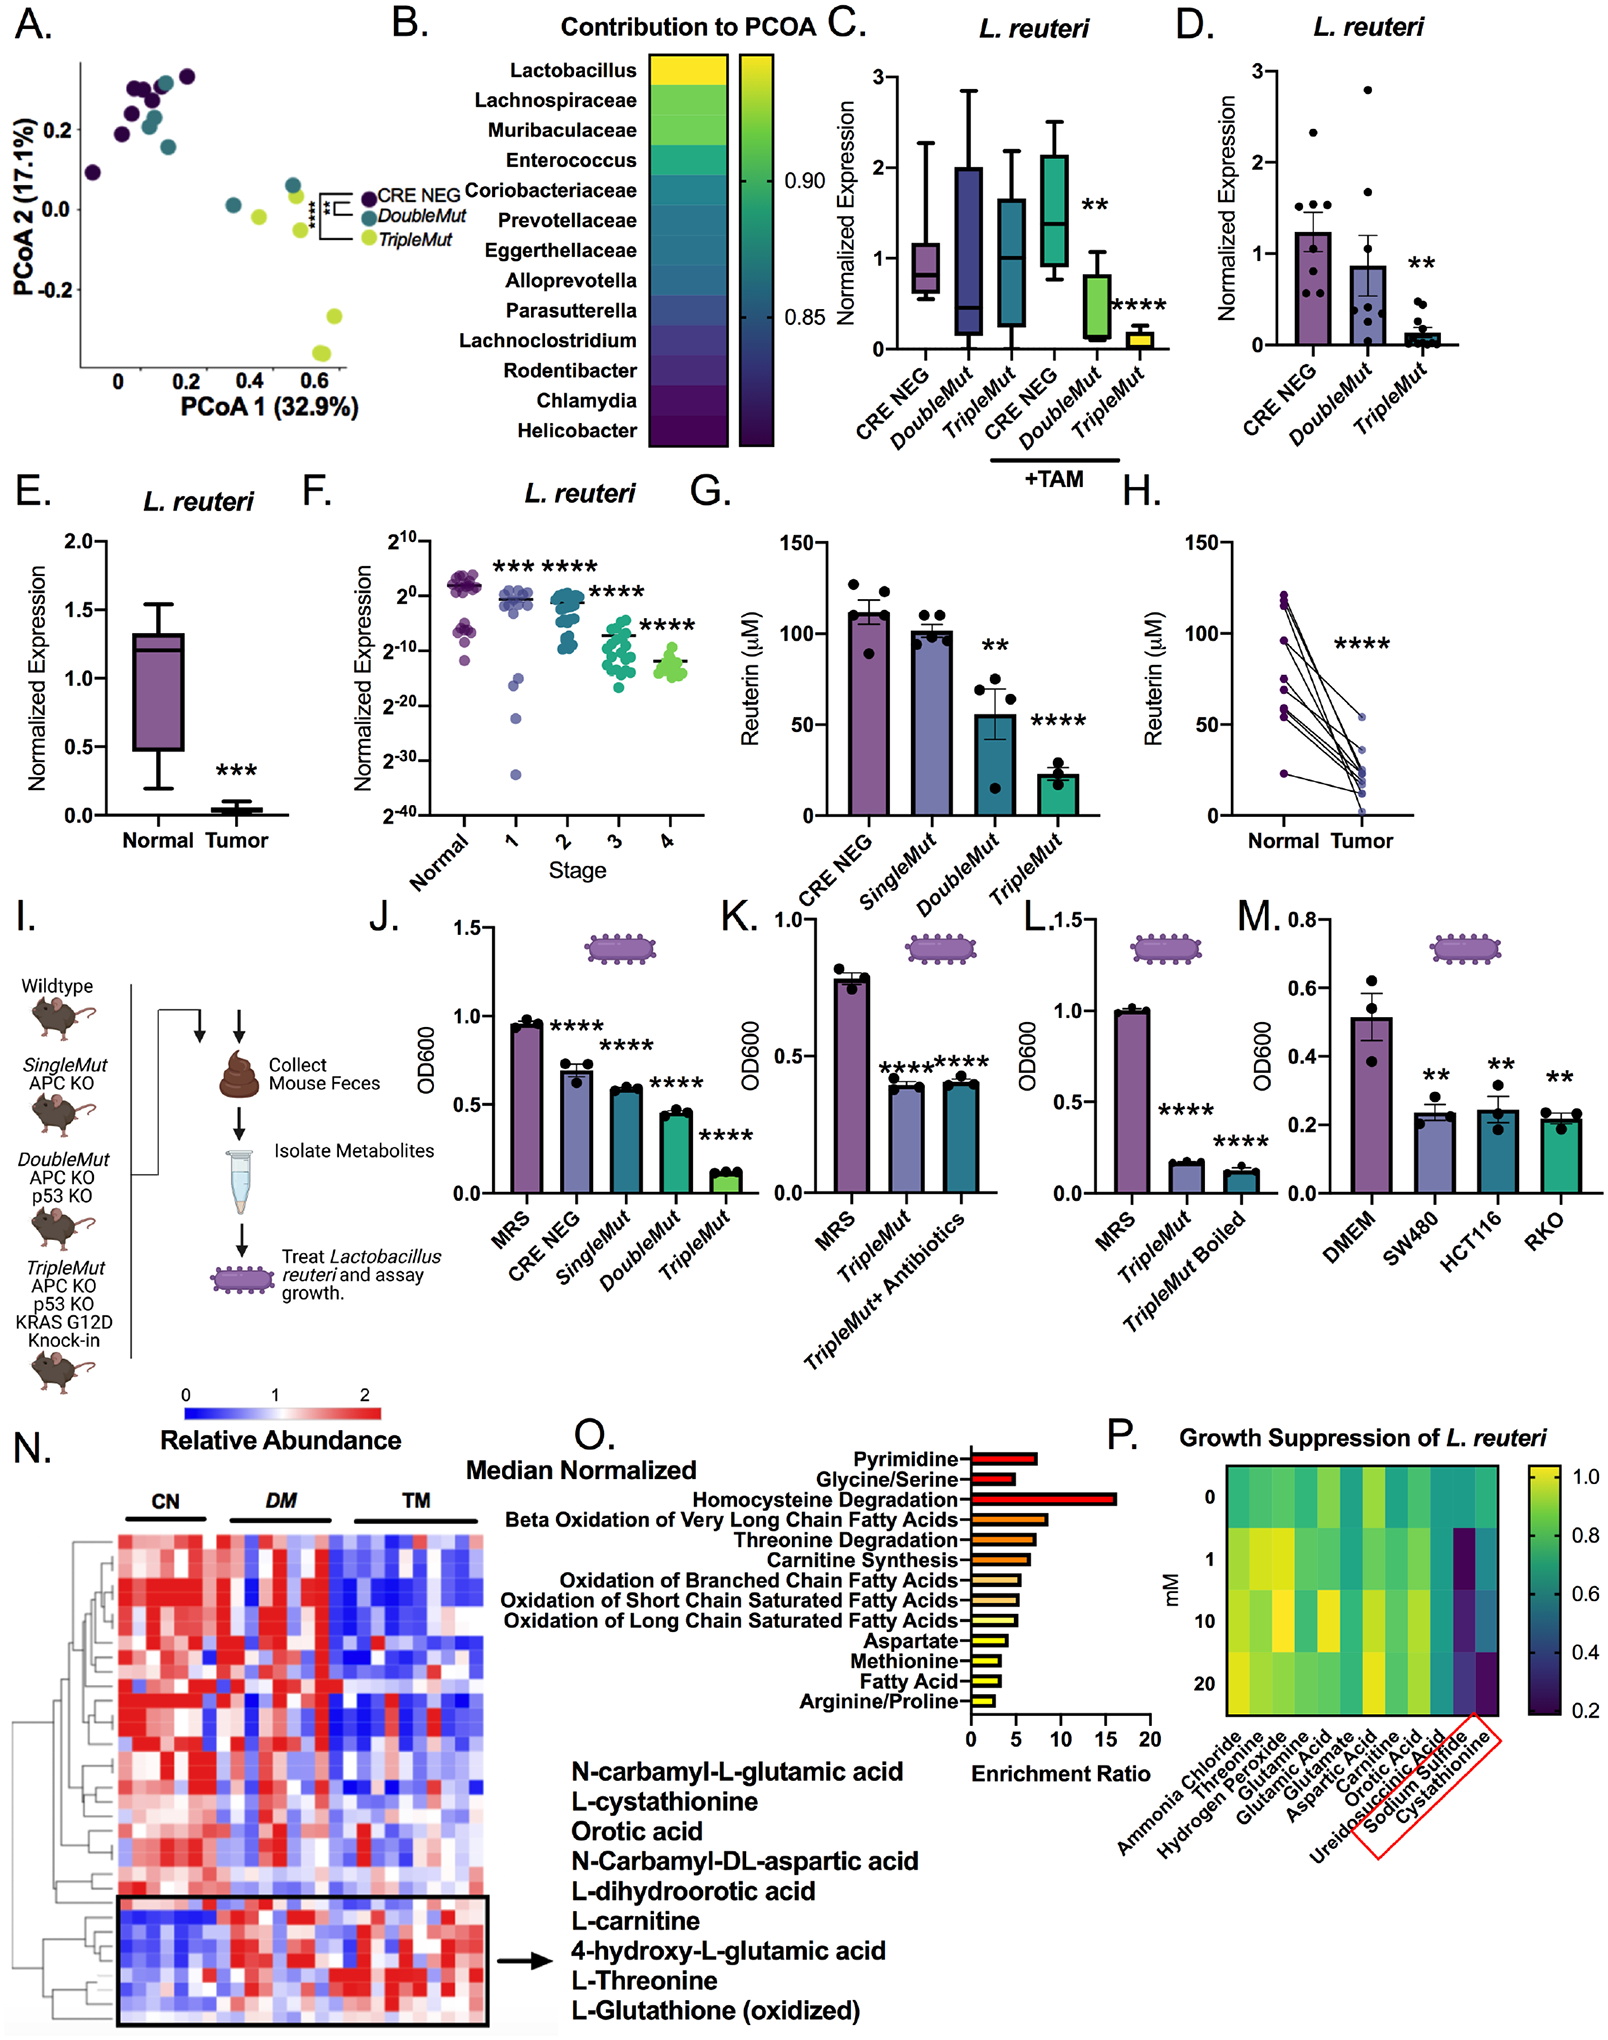
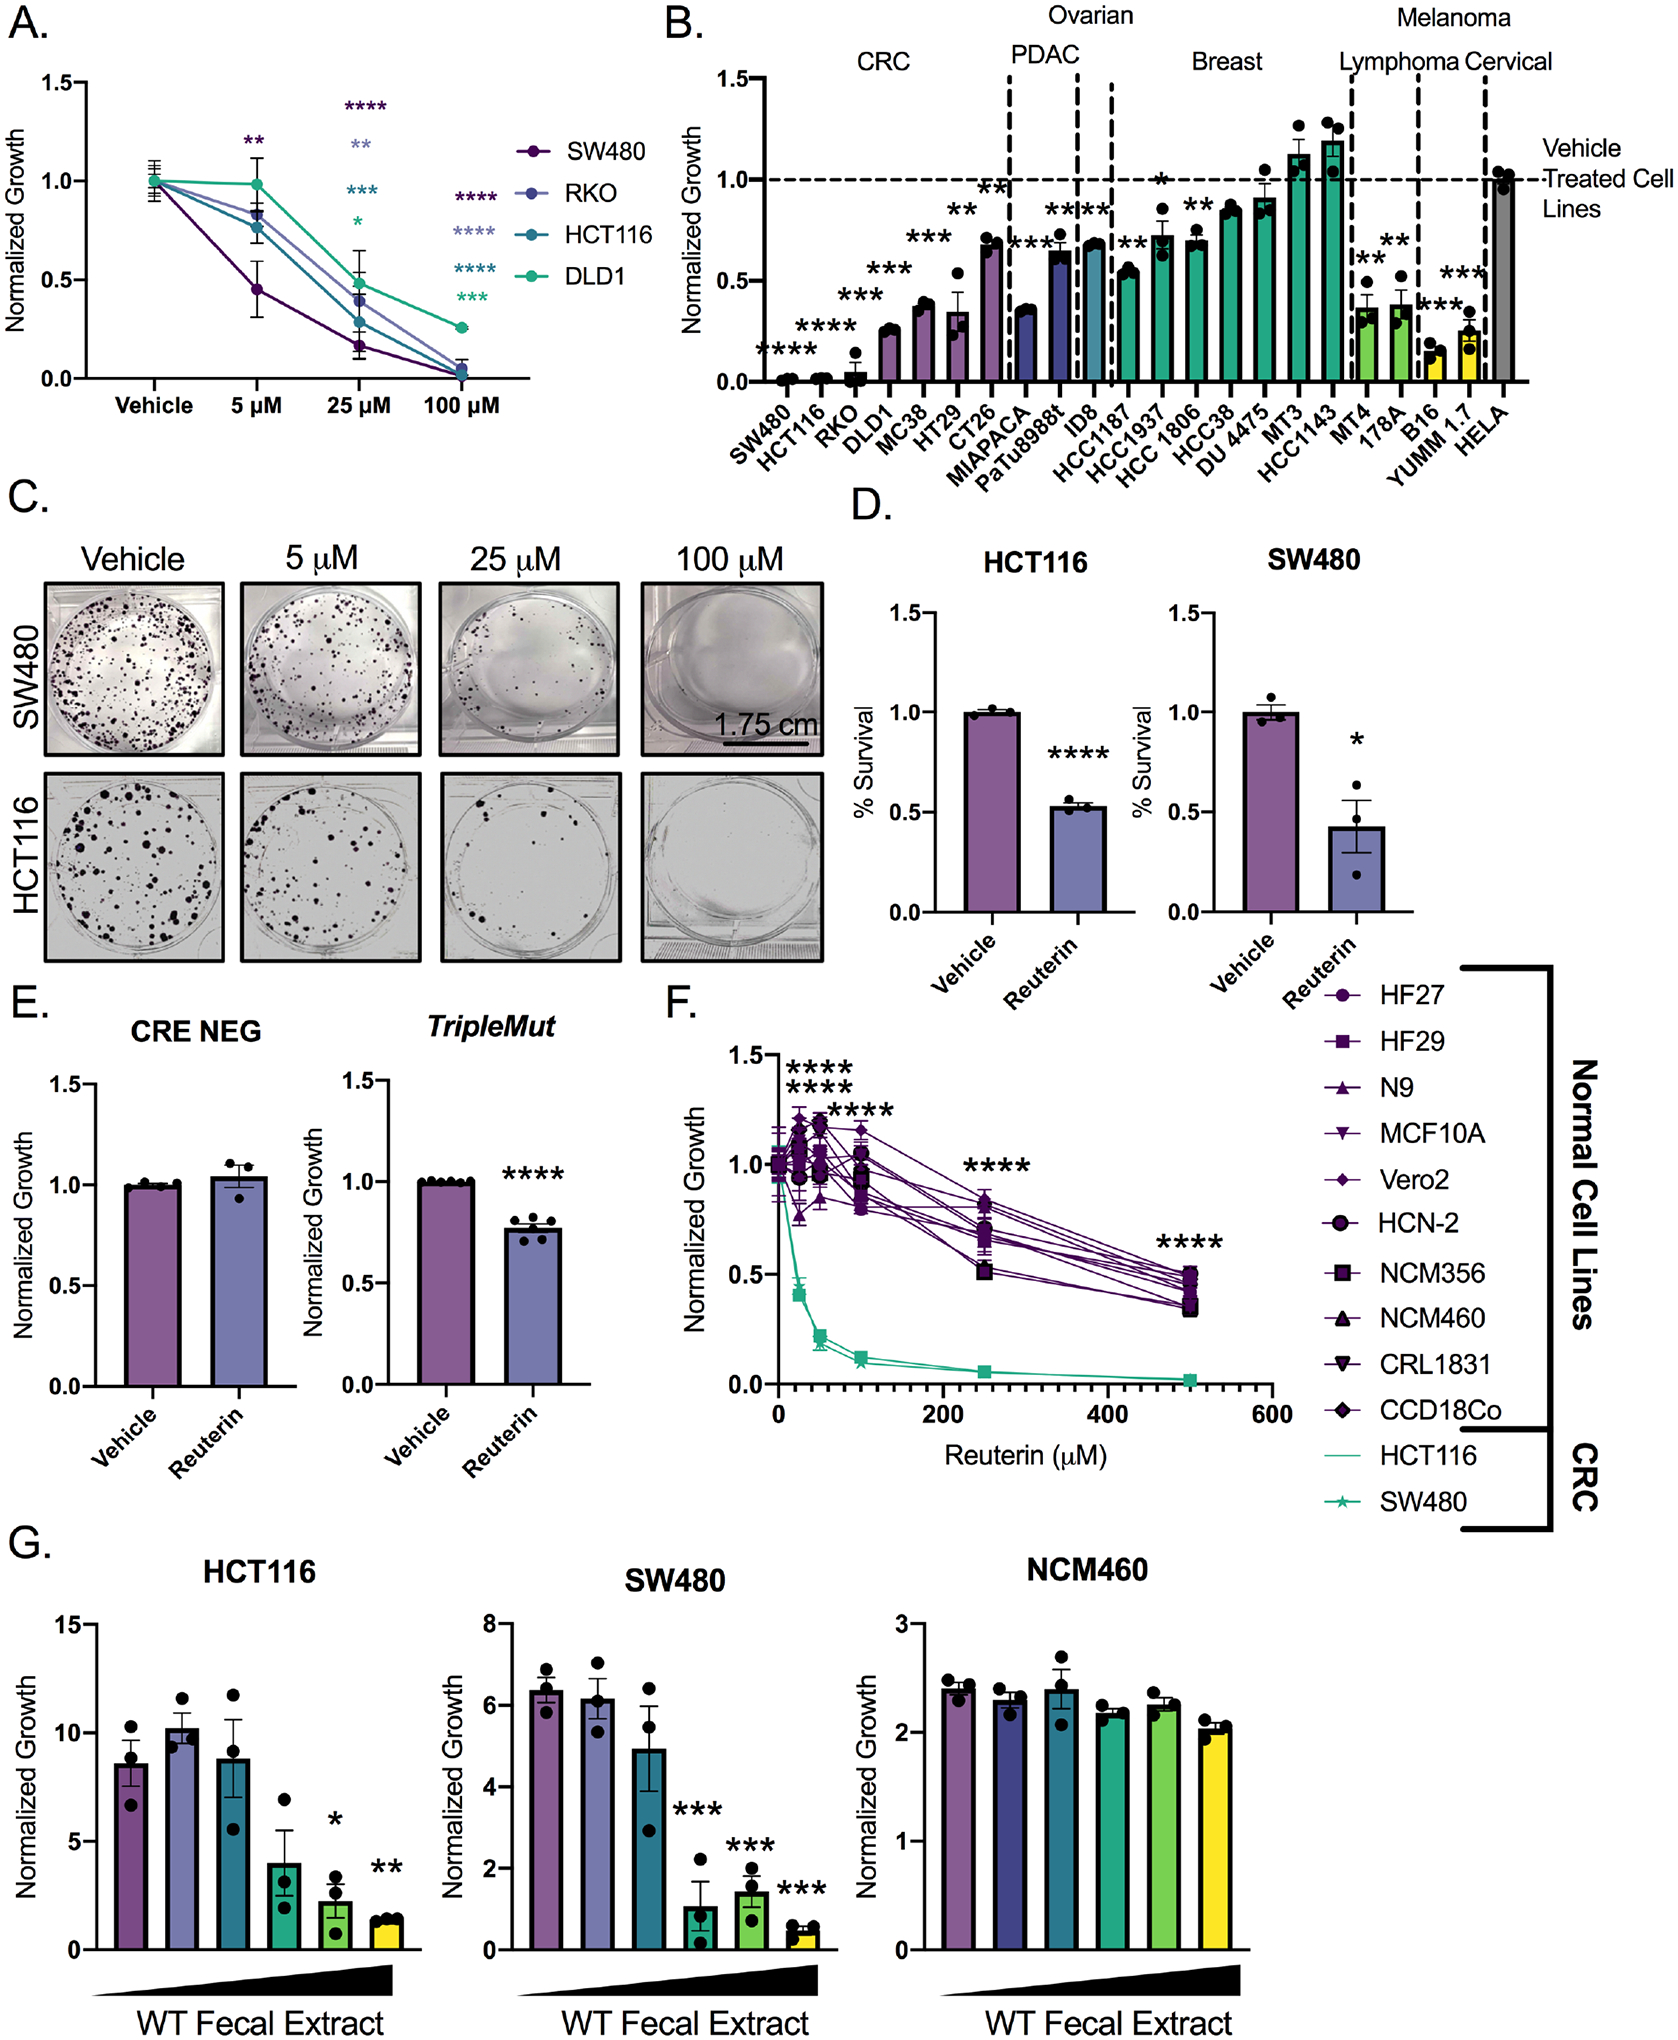
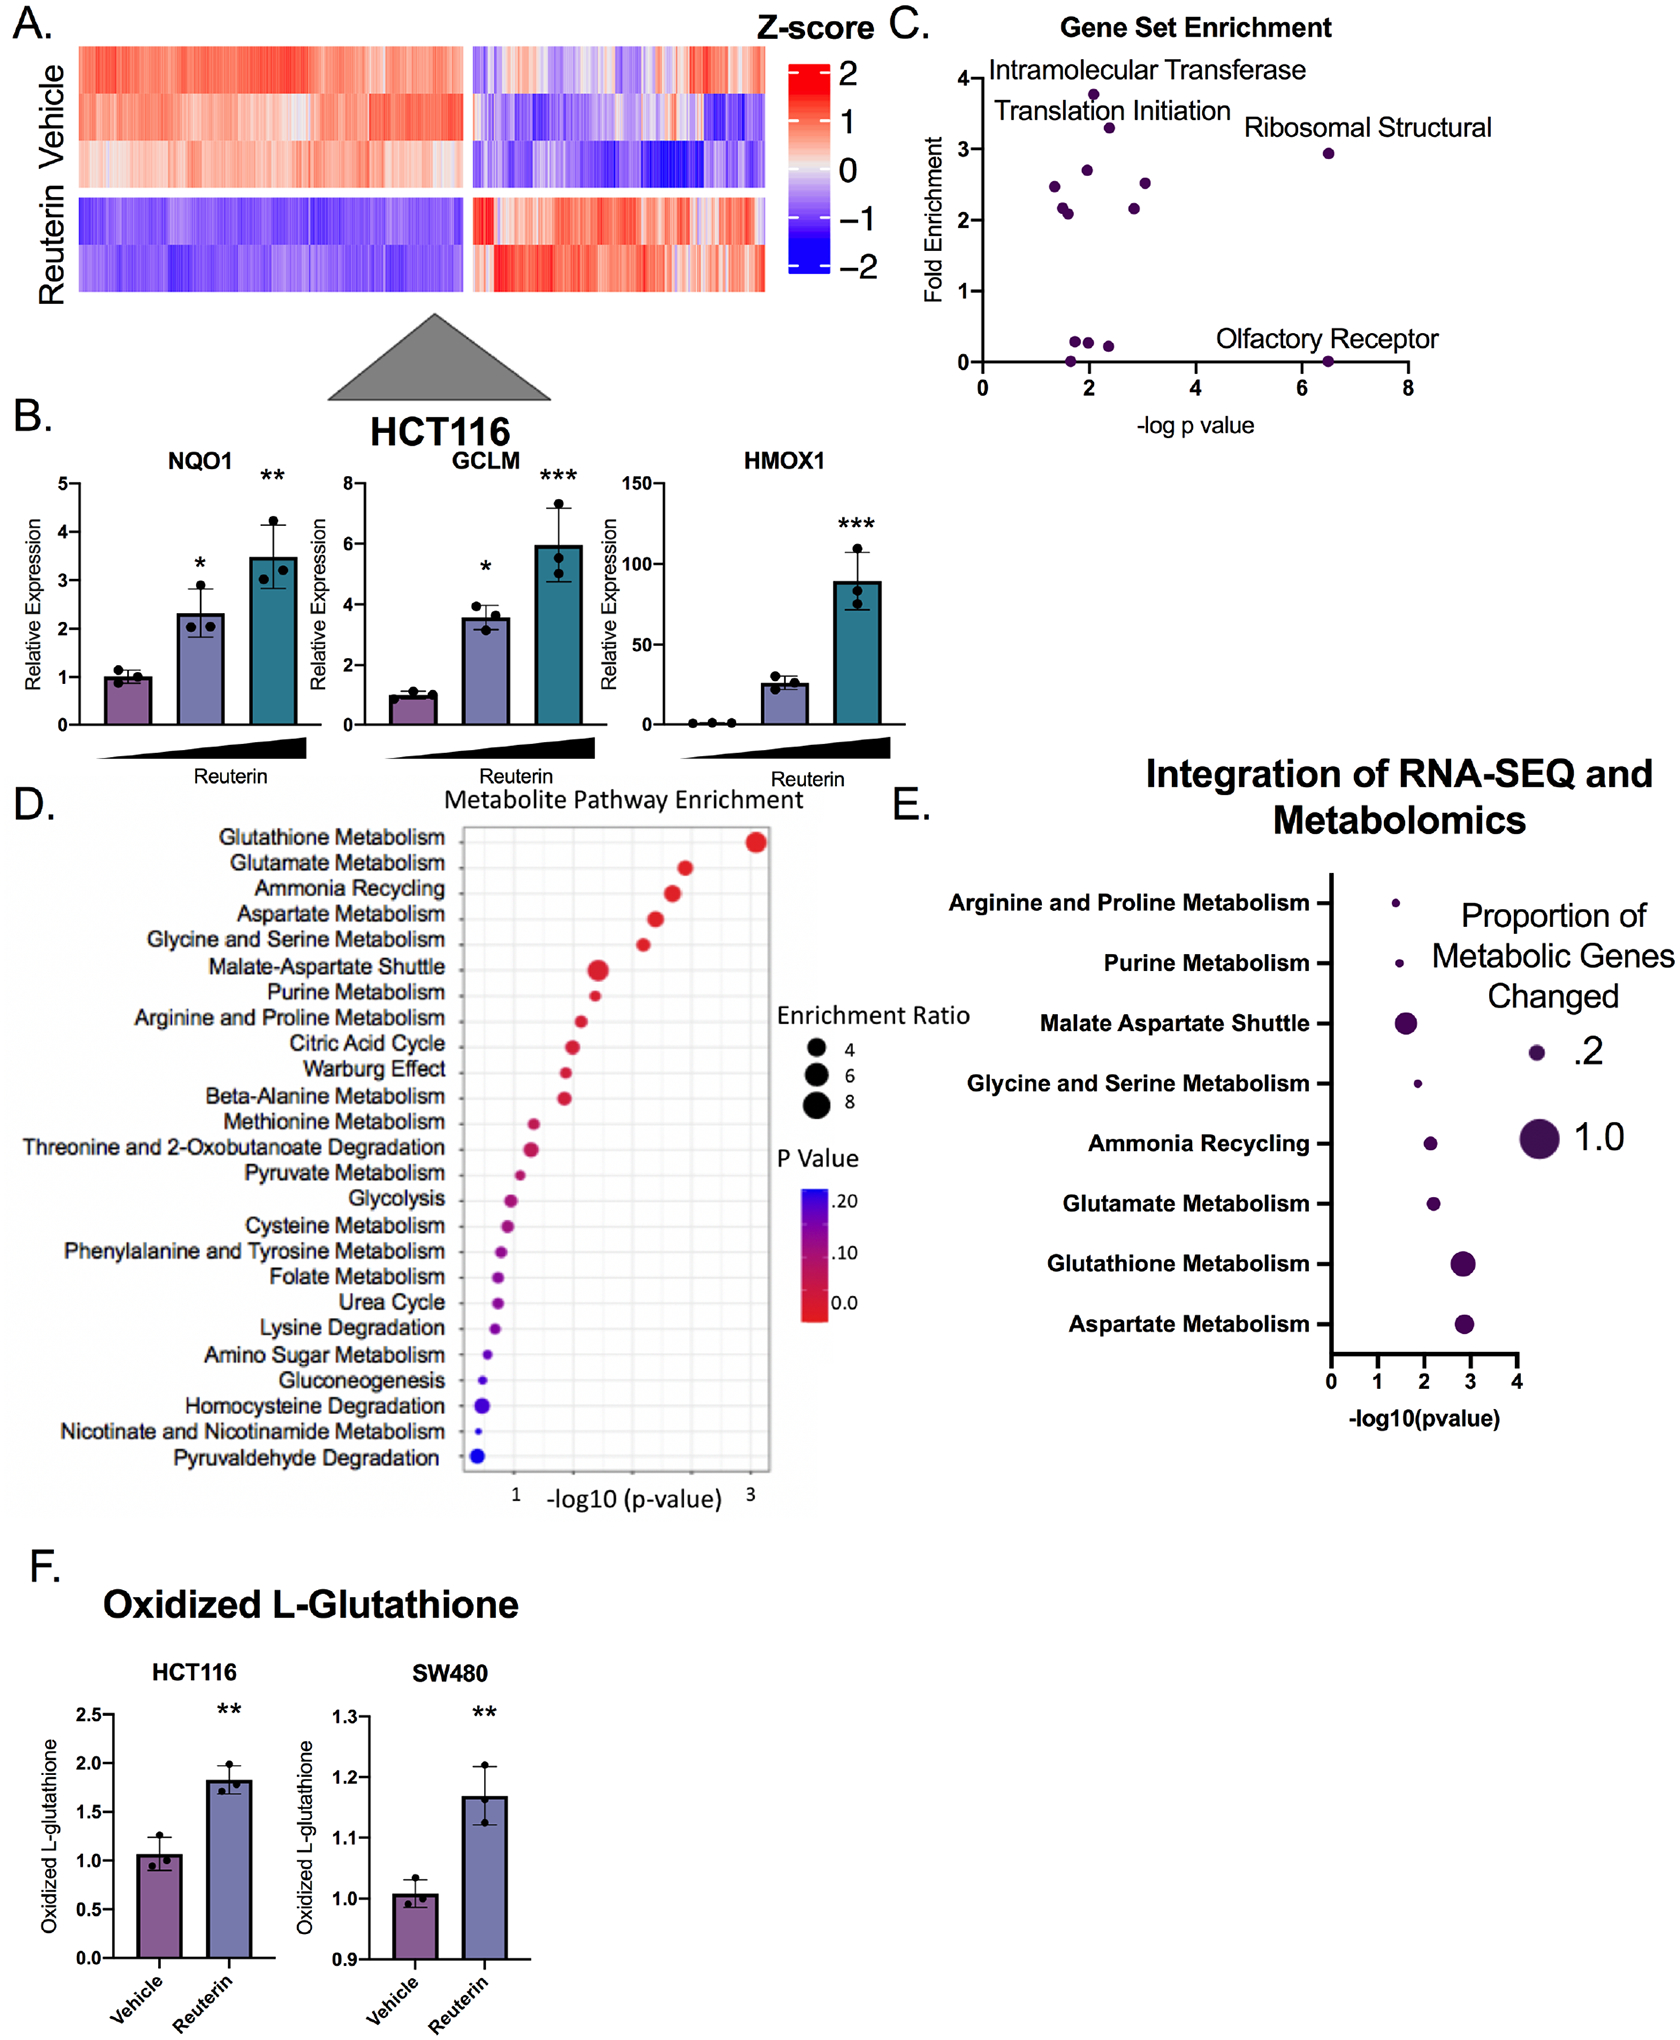
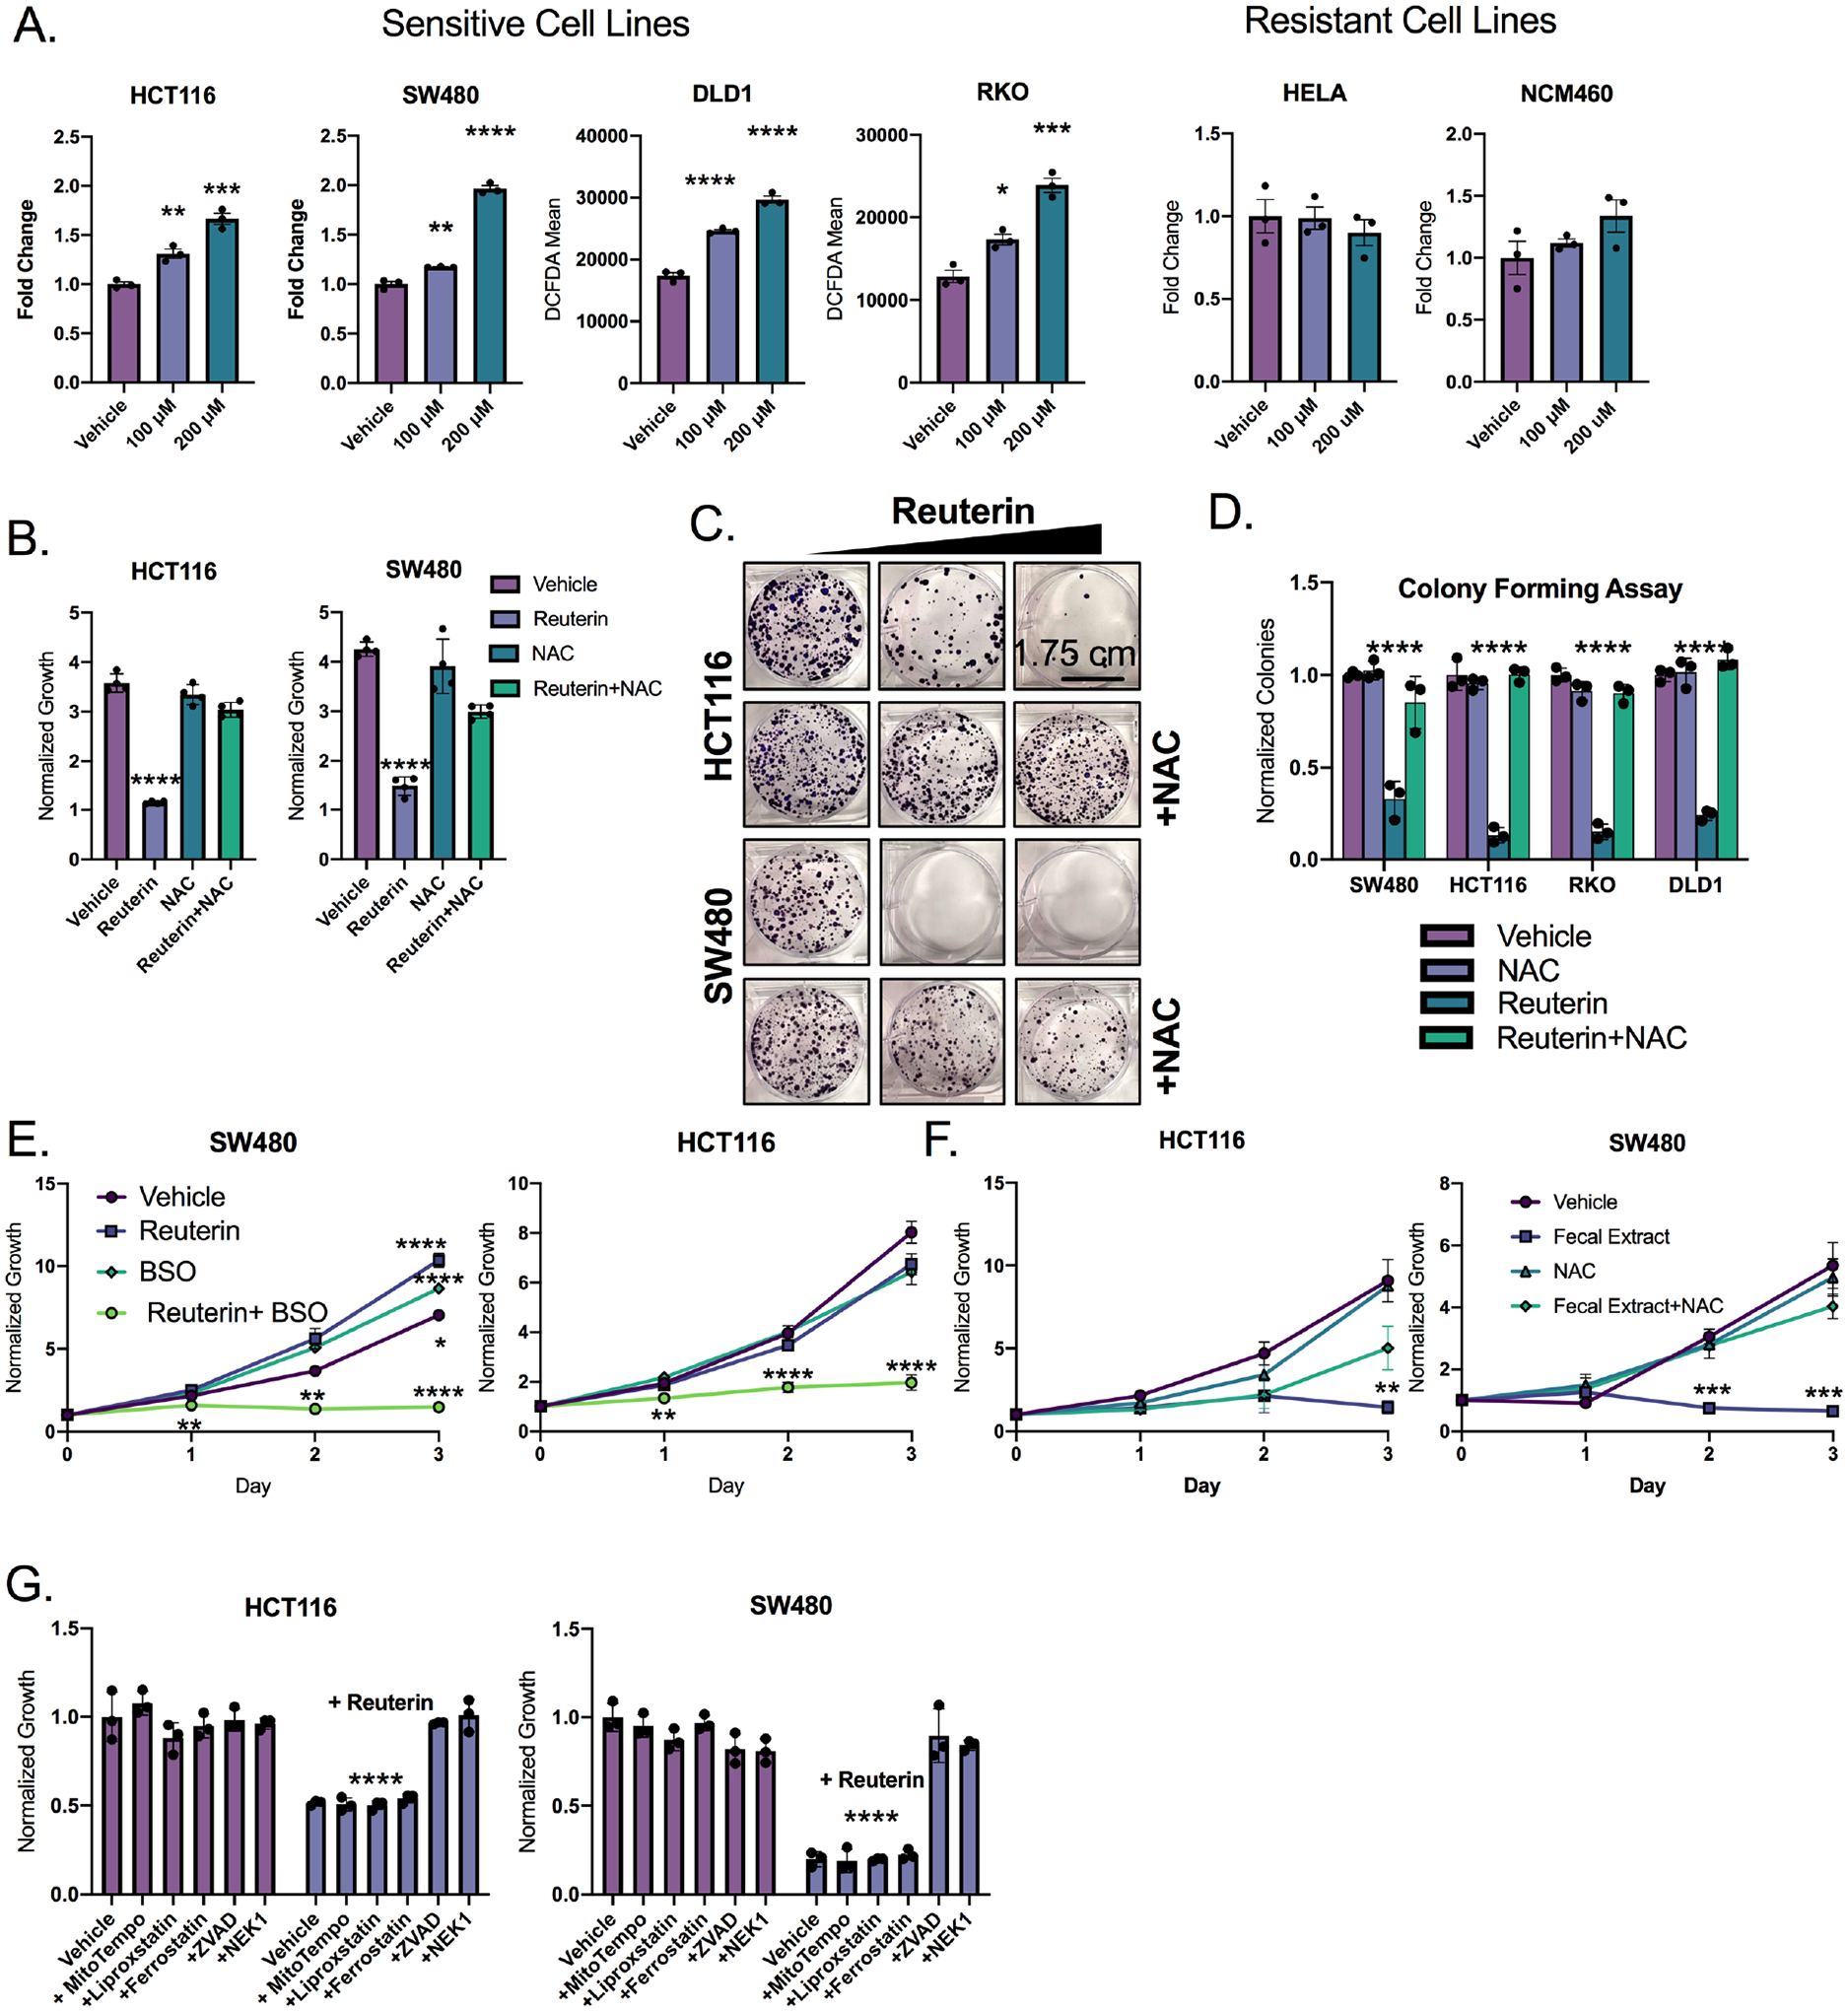
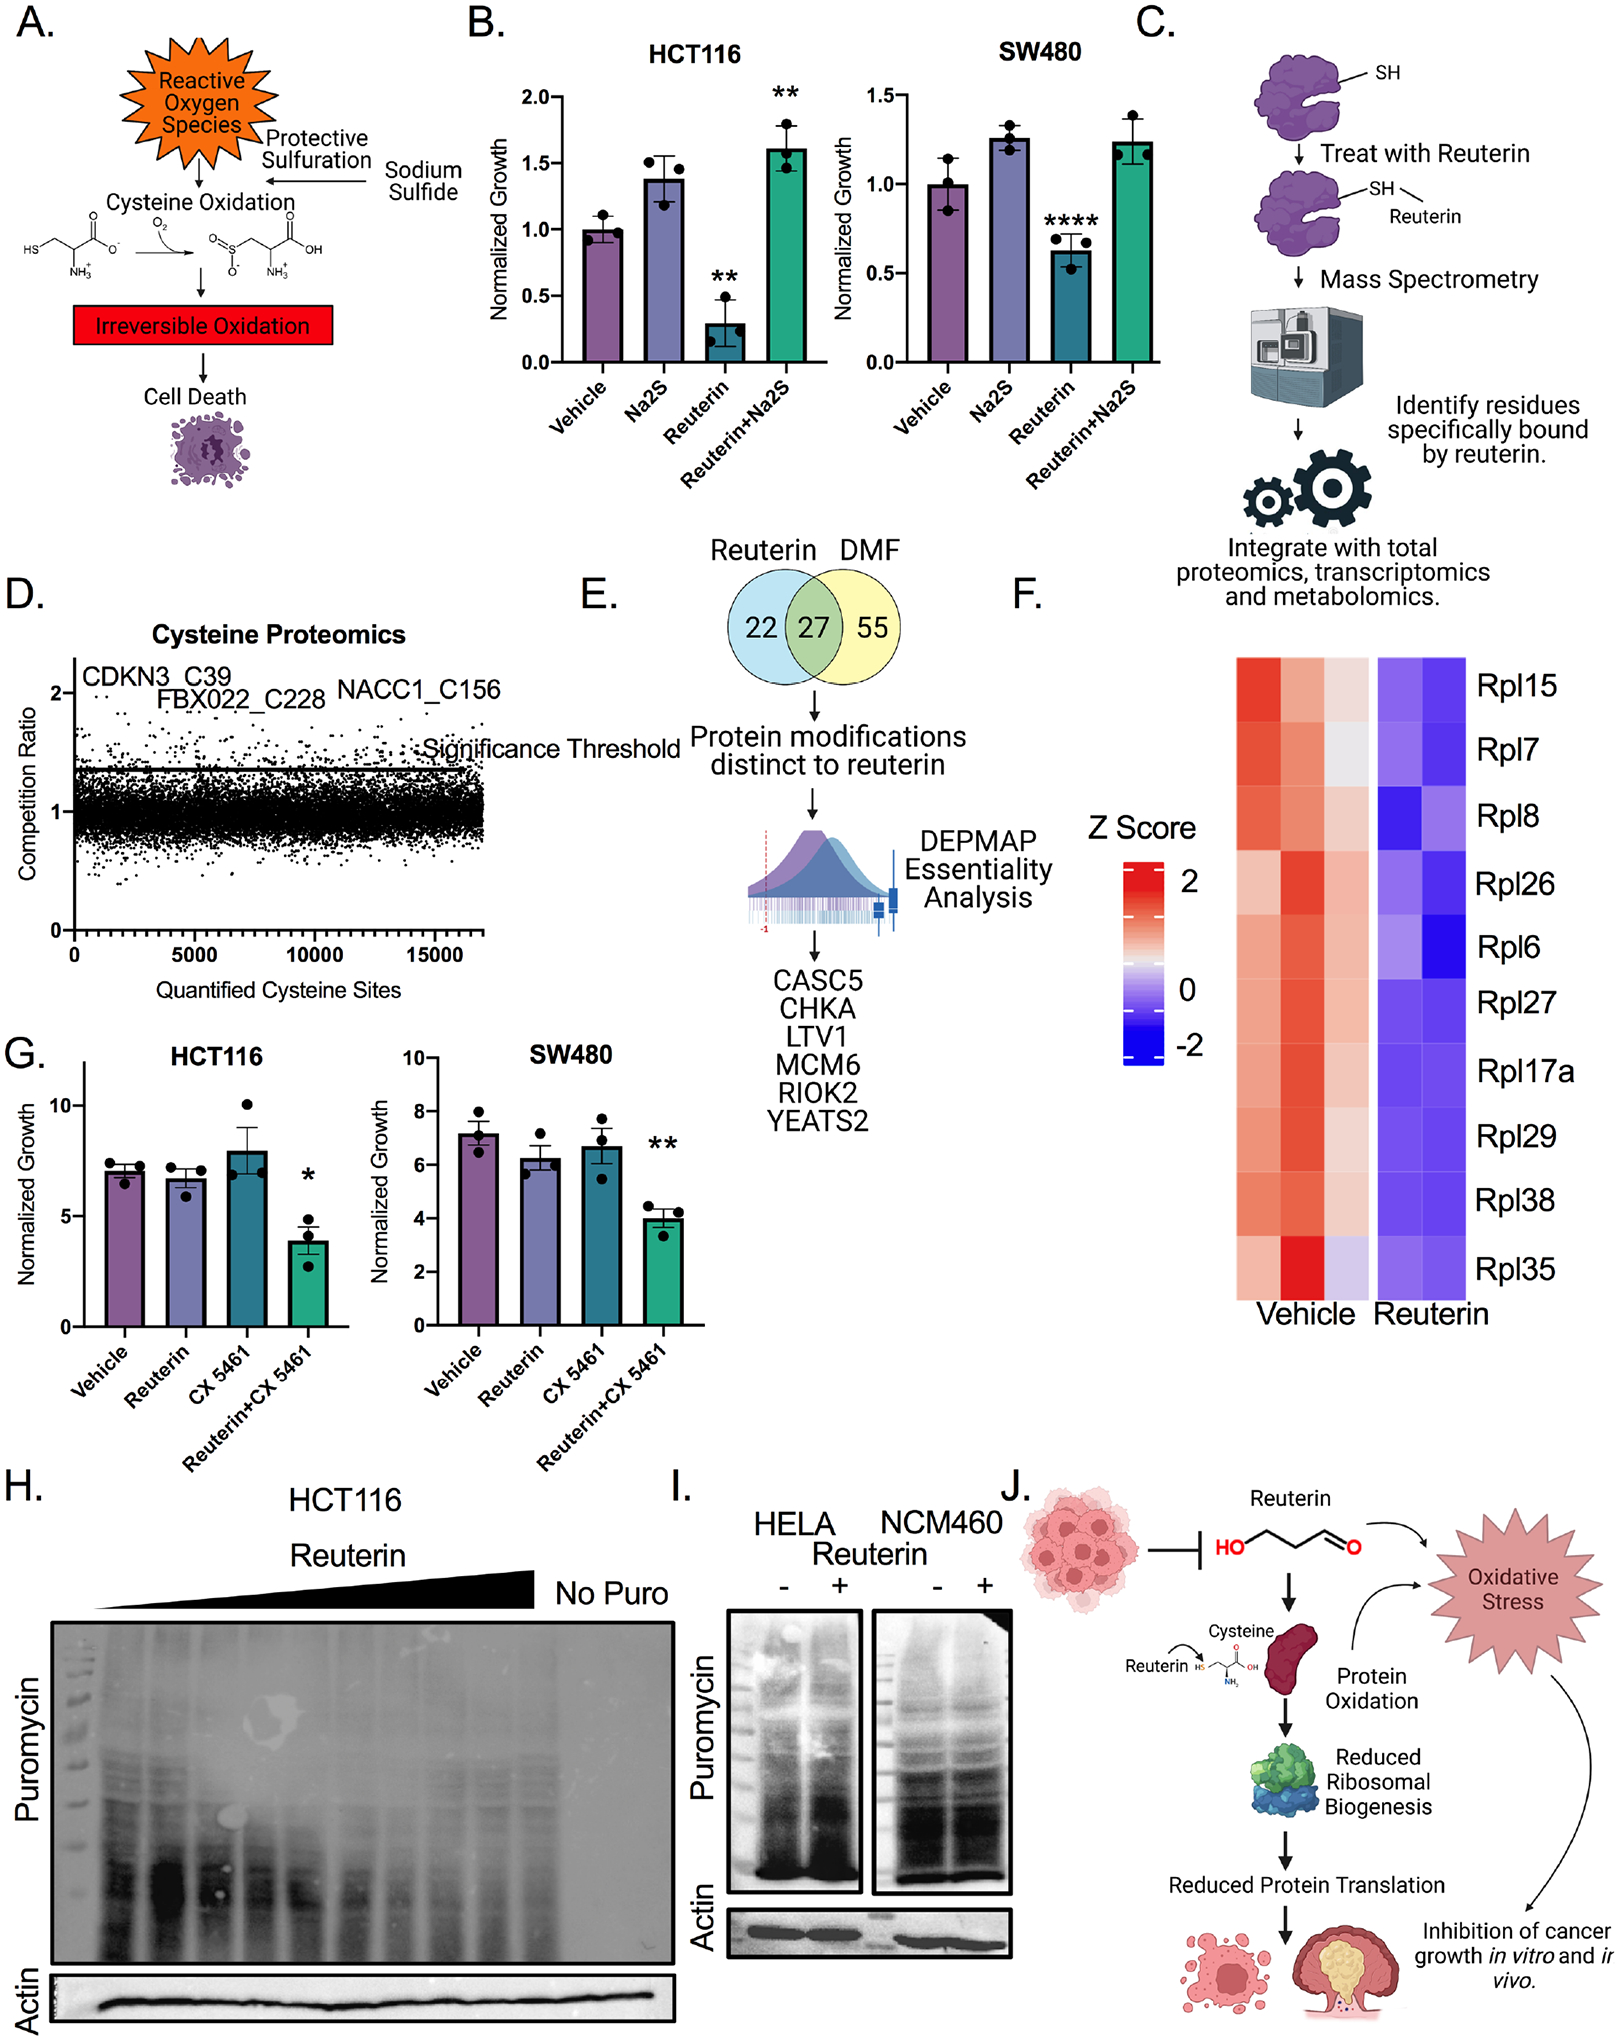
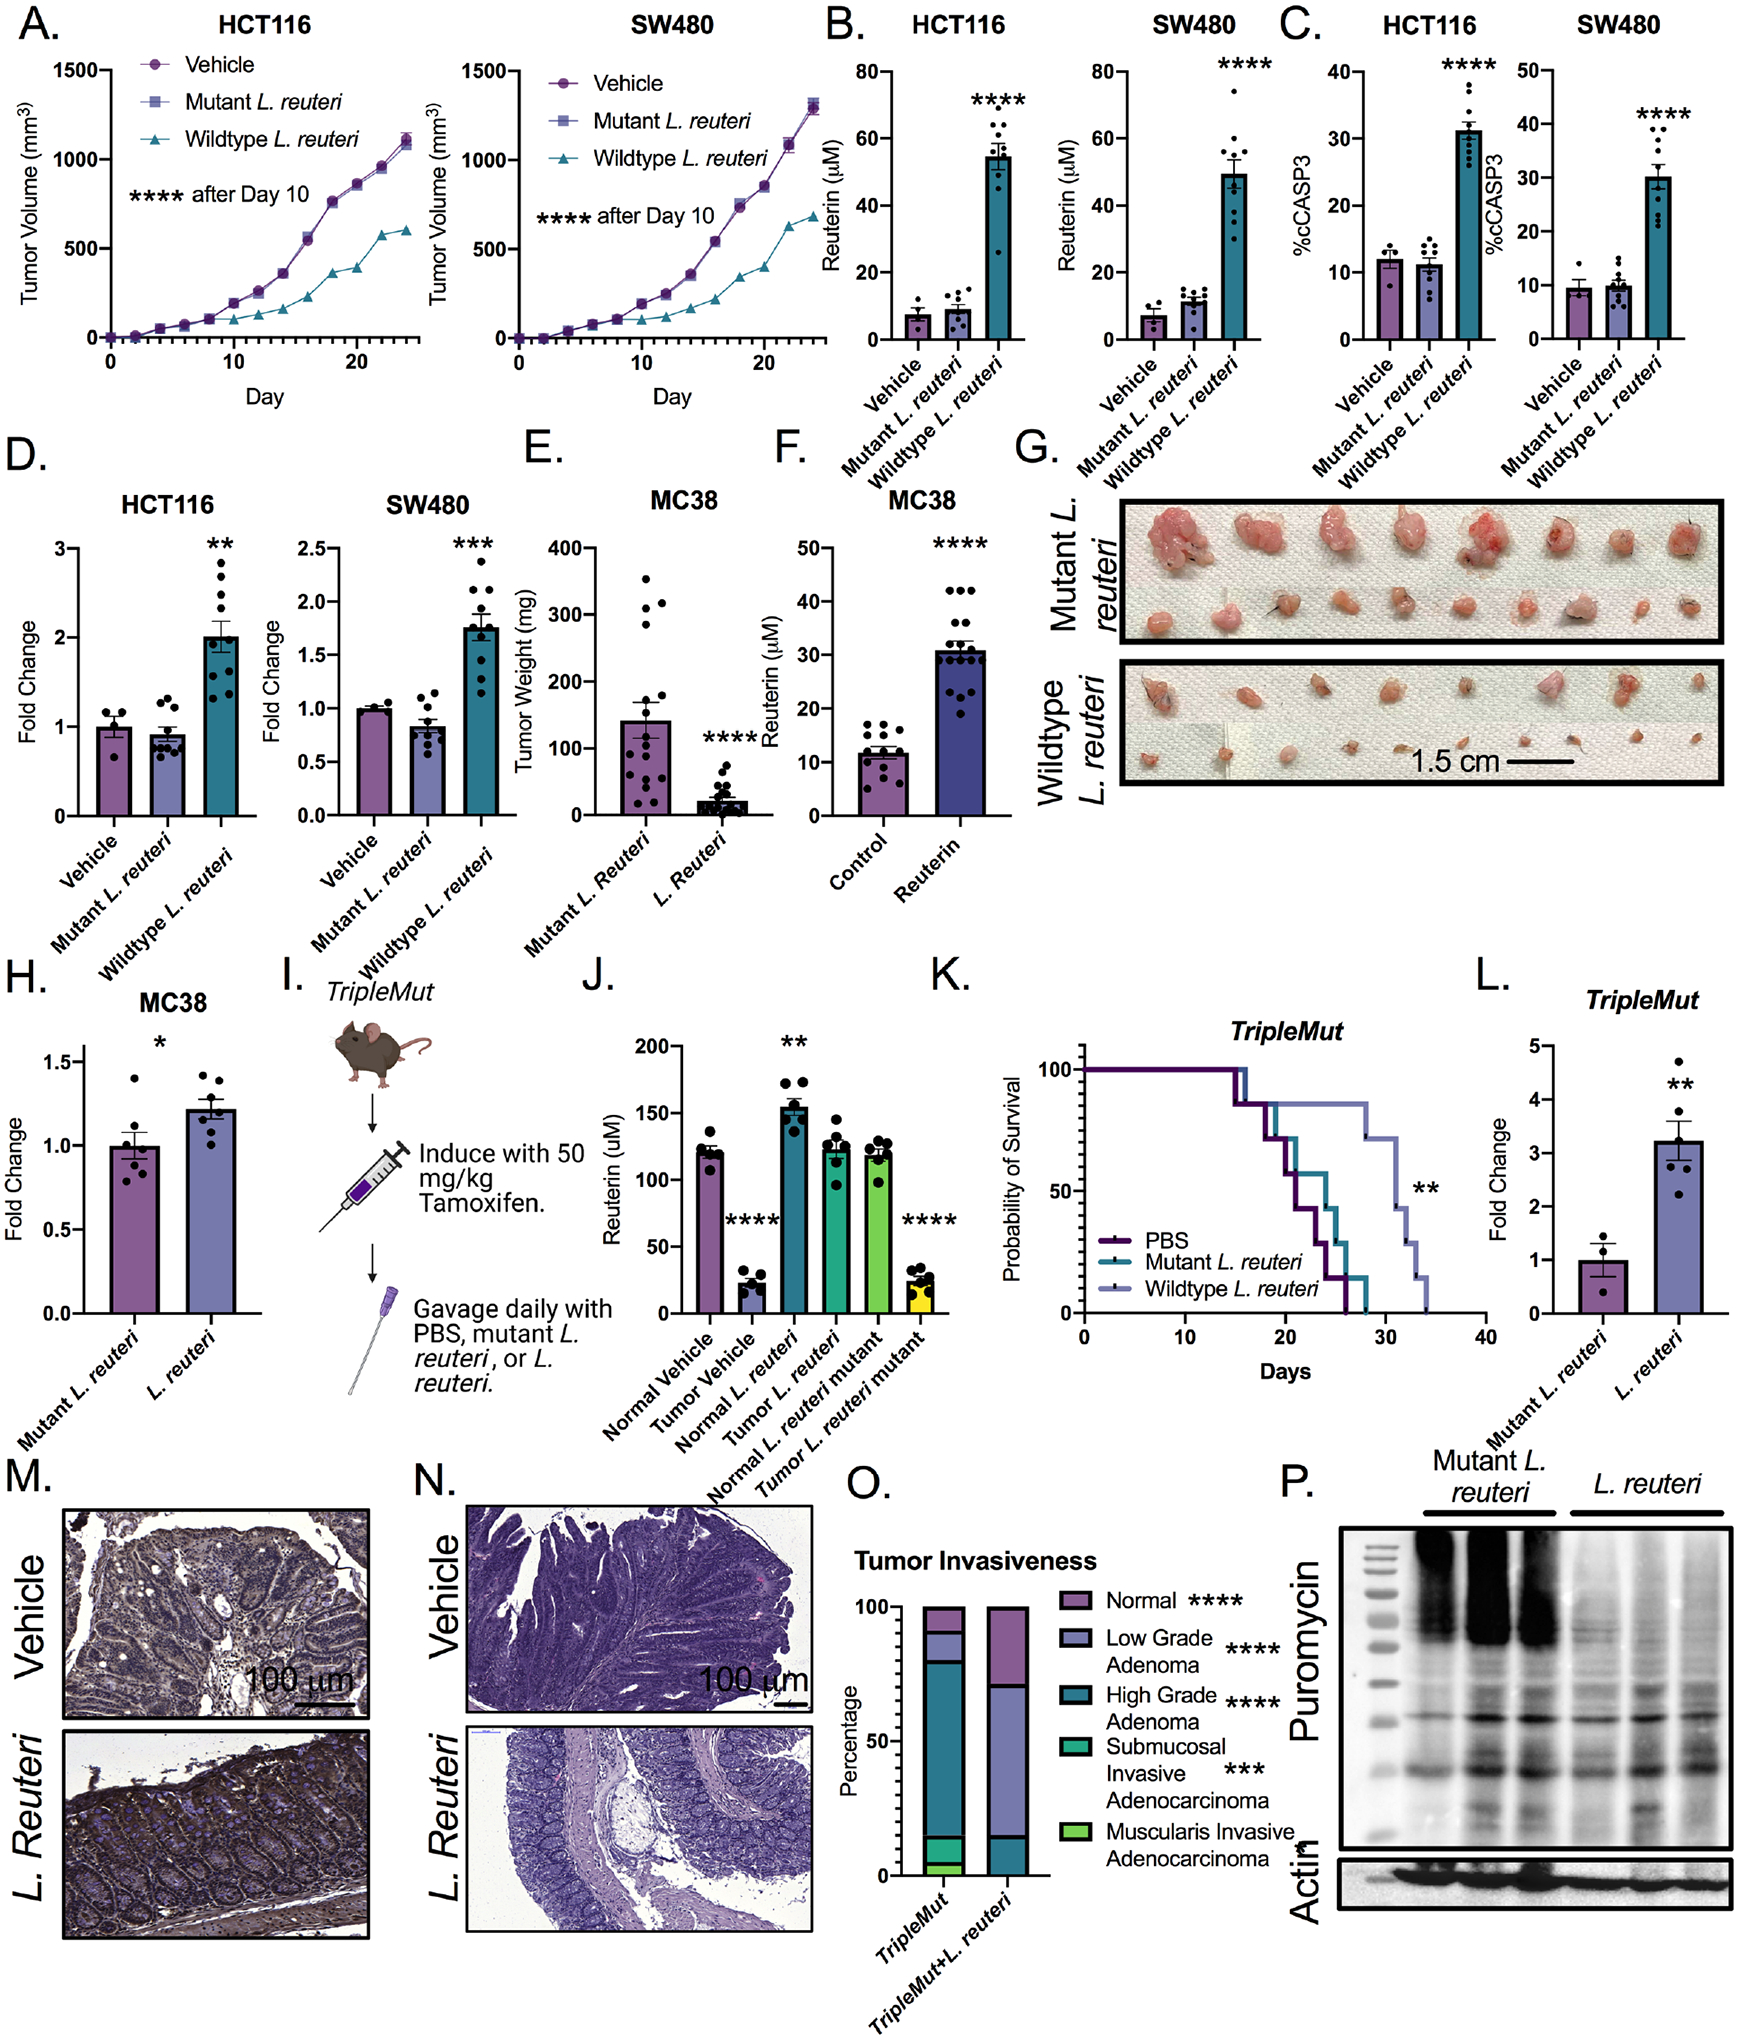
Microbial dysbiosis is a colorectal cancer (CRC) hallmark and contributes to inflammation, tumor growth, and therapy response. Gut microbes signal via metabolites, but how the metabolites impact CRC is largely unknown. We interrogated fecal metabolites associated with mouse models of colon tumorigenesis with varying mutational load. We find that microbial metabolites from healthy mice or humans are growth-repressive, and this response is attenuated in mice and patients with CRC. Microbial profiling reveals that Lactobacillus reuteri and its metabolite, reuterin, are downregulated in mouse and human CRC. Reuterin alters redox balance, and reduces proliferation and survival in colon cancer cells. Reuterin induces selective protein oxidation and inhibits ribosomal biogenesis and protein translation. Exogenous Lactobacillus reuteri restricts colon tumor growth, increases tumor reactive oxygen species, and decreases protein translation in vivo. Our findings indicate that a healthy microbiome and specifically, Lactobacillus reuteri, is protective against CRC through microbial metabolite exchange.

Keywords: Lactobacillus reuteri; Microbiome; Reuterin; colorectal cancer; metabolites; protein oxidation.


Conflict of interest statement

Declaration of interests The authors declare no competing interests.

Figures

Figure 1:
Figure 1:. Fecal metabolites from wild-type mice suppress colorectal cancer cell growth in vitro.
A) Mouse models and treatment strategy employed. B) Dried, organic, metabolite pellets were resuspended in DMSO and treated at 100X concentration and growth was assessed by live cell imaging. (n=9). Error bars are standard error of the mean +/− the mean C) Colony forming assay of cells treated with 100X wild-type fecal metabolites for 14 days. (n=3). D) LDH assay of cells treated with 100X fecal metabolites at 24 hours. (n=3). Mean +/− the standard error of the mean. E) Growth assays from organic fecal metabolites from age matched controls and cancer patients. Each human sample was assayed in triplicate. Mean +/− the standard error of the mean. F) Growth assays from fecal metabolites from wild-type, germ-free mice, and recolonized germfree. (n=3 per group). G) Schematic representation of the screen to identify inhibitory compounds. H) Sensitivity rank graph of cell growth after 72 hours of treatment at 1 mM for each indicated compound. (n=3). Statistical significance was measured by a one-way ANOVA (Panels B, E, and F) or T-test (Panel D) *p < 0.05, ** p < 0.01, *** p < 0.001, **** p < 0.0001. Data is presented as mean +/− the standard error of the mean. All experiments were performed in triplicates at least three times.
Figure 2:
Figure 2:. L. reuteri abundance and host metablotes are altered in mouse colon tumor models and human colorectal cancer.
A) PCoA plots of 16S rRNA sequencing of fecal DNA from the induced (50 mg/kg tamoxifen) mice(n=6–8). Significance is compared to the Cre-negative control mice. B) Length of the vector of the PCoA plot by the indicated species. (n=6–8). C) qPCR of L. reuteri in fecal DNA of indicated mouse model induced with 50 mg/kg tamoxifen. (n=6–8). D) qPCR of indicated mouse strain from colon mucosal scrapes 14 days after induction (same animals as used for tissue 16s sequencing). (n=6–8). E) qPCR of human colon tumor and normal samples. (n=7–8). F) qPCR for L. reuteri of human colon tumor tissue isolated from patients with different stages of cancer. (n=96). One way ANOVA compared to normal human colon tissue. G) Reuterin quantification from colon samples by mass spectrometry. (n=3–5). H) Reuterin quantification from human whole colon normal and tumor paired sections. (n=9). I) Schematic representation of studies of metabolite extracts and treatment of L. reuteri. J) Treatment of L. reuteri with fecal extracts isolated from indicated mice for 24 hours at a 100X concentration. Control is grown in MRS broth. (n=3). K) Treatment of L. reuteri with fecal extracts isolated from TripleMut mice treated with a broad-spectrum antibiotic. (n=3). L) Treatment of L. reuteri with fecal extracts isolated from TripleMut mice which were boiled for 10 minutes. (n=3). M) Cells were grown in DMEM and 10% FBS for 48 hours, then media was supplemented with 20% MRS broth before incubation with L. reuteri. (n=3). N) Unsupervised clustering of metabolite extracts from colon scrapes from induced indicated mouse models (n= 7–8). Metabolites significantly different in the TripleMut compared to the CRE negative are shown, and metabolites that are upregulated in the TripleMut are boxed. O) Metaboanalyst pathway analysis of significantly upregulated metabolites listed by p value. P) L. reuteri incubated with indicated metabolite for 24 hours, then growth assessed by reading at 600 nm. Statistical significance measured by one way ANOVA (A, C, F, F, G, J, K, L, M) or t-test (E, H). Statistical significance was measured by a one-way ANOVA or T-test compared to vehicle control at Day 3, ** p < 0.01, *** p < 0.001, **** p < 0.0001. Data is presented as mean +/− the standard error of the mean. Microbial 16 sequencing experiments, metabolomics, and human tissue analysis were performed once, all other assays were performed in triplicates at least three times.
Figure 3:
Figure 3:. Reuterin preferentially inhibits the growth of colorectal cancer cells over normal colon epithelial cells.
A) Dose curve of panel of cell lines treated reuterin for 72 hours. (n=3). B) Cell growth following 100μM reuterin treatment. (n=3). C) Colony forming assay of cells treated with indicated concentration of reuterin. (n=3, representative shown). D) LDH assay of cells treated with 100μM reuterin for 24 hours. (n=3). E) Epithelial cell death in indicated mouse models 14 days after induction. (n=3). F) Cell growth in normal and cancer cells. Purple: normal cell lines; green: colon cancer cell lines. Data was collected at 72 hours. (n=3). G) Dose curve of wild-type fecal extracts on indicated cell line. (n=3). Statistics were calculated with one-way ANOVA (A, B, F, and G) or t-test (D and E). *p < 0.05, ** p < 0.01, *** p < 0.001, **** p < 0.0001. Data is presented as mean +/− the standard error of the mean. All experiments were performed in triplicates at least three times with the exception of panel F which was performed in triplicate a single time.
Figure 4:
Figure 4:. Multi-omics approach reveals Reuterin induces oxidative stress.
A) Heat map of altered genes treated with 100 μM reuterin for 24 hours. (n=2–3). B) qPCR of NRF2 target genes with vehicle control, 25μm and 100μm reuterin treatment for 24 hours. (n=3). C) KEGG pathway enrichment for genes differentially expressed between vehicle and reuterin treated cells. D) Metabolomics pathway enrichment of significantly altered metabolites in SW480 cells. E) Proportion of genes altered in the RNA-SEQ of metabolic pathway associated genes. The size of the dot represents the percentage of genes altered transcriptionally in the indicated metabolic pathway. The p value is the significance of the metabolic pathway enrichment. F) Quantification of oxidized L-glutathione. (n=3). Statistics were calculated with one-way ANOVA (B) or t-test (F). *p < 0.05, ** p < 0.01, *** p < 0.001, **** p < 0.0001. Data is presented as mean +/− the standard error of the mean. Metabolomics and RNA-SEQ experiments were performed a single time in triplicate, all other experiments were performed at least three times in triplicate.
Figure 5:
Figure 5:. Reuterin induces oxidative stress in a GSH-dependent manner.
A) Cells were treated with indicated reuterin concentration for 24 hours, then stained with DCFDA ROS dye and analyzed by flow cytometry. Values are MFI. (n=3). B) Cells were pretreated with NAC for 24 hours, then treated with reuterin for 72 hours, then analyzed by live cell imaging. (n=3). C) Representative colony forming assay (CFA) at 14 days for cells pretreated with NAC for 12 hours. (n=3, representative shown). D) Quantification of CFA of cells treated as in panel C. (n=3). E) Cells were cotreated with 10μm Reuterin and 100μm BSO. (n=3). F) Cells were pretreated with NAC for 12 hours then treated with wild-type organic fecal extract. (n=3). G) Cells were pretreated with mitotempo (1 mM), liproxstatin (10μM), ferrostatin (10μM), ZVAD(50μM) or necrostatin-1 (50μM) then treated with 100μm reuterin for 3 days, growth was assessed via live cell imaging. (n=3). Statistics were calculated with one-way ANOVA (A, B, D, E,F, and G). *p < 0.05, ** p < 0.01, *** p < 0.001, **** p < 0.0001. Data is presented as mean +/− the standard error of the mean. All experiments were performed in triplicates at least three times.
Figure 6:
Figure 6:. Reuterin induces protein oxidation and inhibits ribosomal biogenesis.
A) Schematic of protective persulfidation from protein oxidation. B). Cells were pretreated with 50μm reuterin for 12 hours, then media was washed out, and cells were treated with 200μm sodium sulfide for 24 hours before LDH assay. (n=3). C) Schematic for integrated proteomics, transcriptomics and metabolomics. D) Competition ratio of average of three separate samples for cysteine sites bound by reuterin. (n=3, repeated twice). E) Analysis of cysteine proteomics data with DepMap. F) Heat map of YEATS2 target genes in cells treated with reuterin. (n=5). G) Growth assays of cells co-treated with 2μm of CX5461 and 10μm of reuterin for 72 hours. (n=3). H) Puromycin western blot of cells treated with doses increasing from 1 to 150μm reuterin for 24 hours. I) Puromycin western blot of cells treated with 100μm reuterin for 24 hours. J) Schematic of proposed mechanism of action for reuterin. Statistics were calculated with one-way ANOVA (Panels B and G). *p < 0.05, ** p < 0.01, *** p < 0.001, **** p < 0.0001. Data is presented as mean +/− the standard error of the mean. Cysteine proteomics was performed in triplicate two times, RNA-SEQ experiment was performed in triplicate once. All other experiments were performed in triplicates at least three times.
Figure 7:
Figure 7:. Reuterin inhibits colorectal cancer growth in vivo.
A) Quantification of tumor size of implanted HCT116 and SW480 cells in nude mice followed by daily gavage with wildtype or mutant L. reuteri or PBS (n=4–10). B) Quantification of reuterin in tumor from panel A. C) Percent cleaved caspase 3 cells (cCASP3) in tumors from panel A. D) Fold change of DCFDA ROS signal in tumors from panel A. E) End point weight of tumors of MC38 in mice gavaged daily with L. reuteri (n=8–9). F) Quantification of reuterin in MC38 tumors from E. G) Picture of representative tumors from D. H) Fold change of DCFDA ROS measurements from MC38 tumors. I) Schematic for treatment of the TripleMut. J) Quantification of reuterin in whole colon from indicated treatment groups. (n=4–6). K) Survival curve of mice gavaged daily by either wild-type or mutant L. reuteri. (n=7). L) DCFDA ROS measurements from the colons of induced TripleMut mice treated with either mutant or wildtype L. reuteri.(n=3–6). M) Representative 4HNE immunohistochemistry in induced TripleMut mice. (n=3–6, representative shown). N) H and E of PBS treated or L. reuteri treated TripleMut mice. (n=3–6, representative shown). O). Pathological score of TripleMut mice treated with wild-type or mutant L. reuteri. (n=4–5). P) Puromycin western blot of induced TripleMut mice sacrificed on Day 10 and treated with daily gavage of either wild-type or mutant L. reuteri. Colons were washed, homogenized, and stained with puromycin ex vivo for thirty minutes. (n=3–6, representative shown). Statistics were calculated with one-way ANOVA (Panels A, B, C, D, J, K, and O) or t-test (panels E, F, H and L). *p < 0.05, ** p < 0.01, *** p < 0.001, **** p < 0.0001. Data is presented as mean +/− the standard error of the mean. Xenograft experiments were performed once. MC38 syngeneic experiments were performed two times with the indicated mouse numbers.

Comment in

References

    1. Anderson ER, Taylor M, Xue X, Ramakrishnan SK, Martin A, Xie L, Bredell BX, Gardenghi S, Rivella S, and Shah YM (2013). Intestinal HIF2α promotes tissue-iron accumulation in disorders of iron overload with anemia. Proc National Acad Sci 110, E4922–E4930. - PMC - PubMed
    1. Angeli JPF, Schneider M, Proneth B, Tyurina YY, Tyurin VA, Hammond VJ, Herbach N, Aichler M, Walch A, Eggenhofer E, et al. (2014). Inactivation of the ferroptosis regulator Gpx4 triggers acute renal failure in mice. Nat Cell Biol 16, 1180–1191. - PMC - PubMed
    1. Arnold M, Sierra MS, Laversanne M, Soerjomataram I, Jemal A, and Bray F (2017). Global patterns and trends in colorectal cancer incidence and mortality. Gut 66, 683. - PubMed
    1. Asare PT, Zurfluh K, Greppi A, Lynch D, Schwab C, Stephan R, and Lacroix C (2020). Reuterin Demonstrates Potent Antimicrobial Activity Against a Broad Panel of Human and Poultry Meat Campylobacter spp. Isolates. Microorg 8, 78. - PMC - PubMed
    1. Belcheva A, Irrazabal T, Robertson SJ, Streutker C, Maughan H, Rubino S, Moryama EH, Copeland JK, Surendra A, Kumar S, et al. (2014). Gut microbial metabolism drives transformation of MSH2-deficient colon epithelial cells. Cell 158(2):288–299. - PubMed

Publication types

MeSH terms