. 2022 Jan;7(1):169-179.
doi: 10.1038/s41564-021-01011-w. Epub 2021 Dec 24.

Integrating cultivation and metagenomics for a multi-kingdom view of skin microbiome diversity and functions

Collaborators, Affiliations

Integrating cultivation and metagenomics for a multi-kingdom view of skin microbiome diversity and functions

Sara Saheb Kashaf et al. Nat Microbiol. 2022 Jan.

Abstract

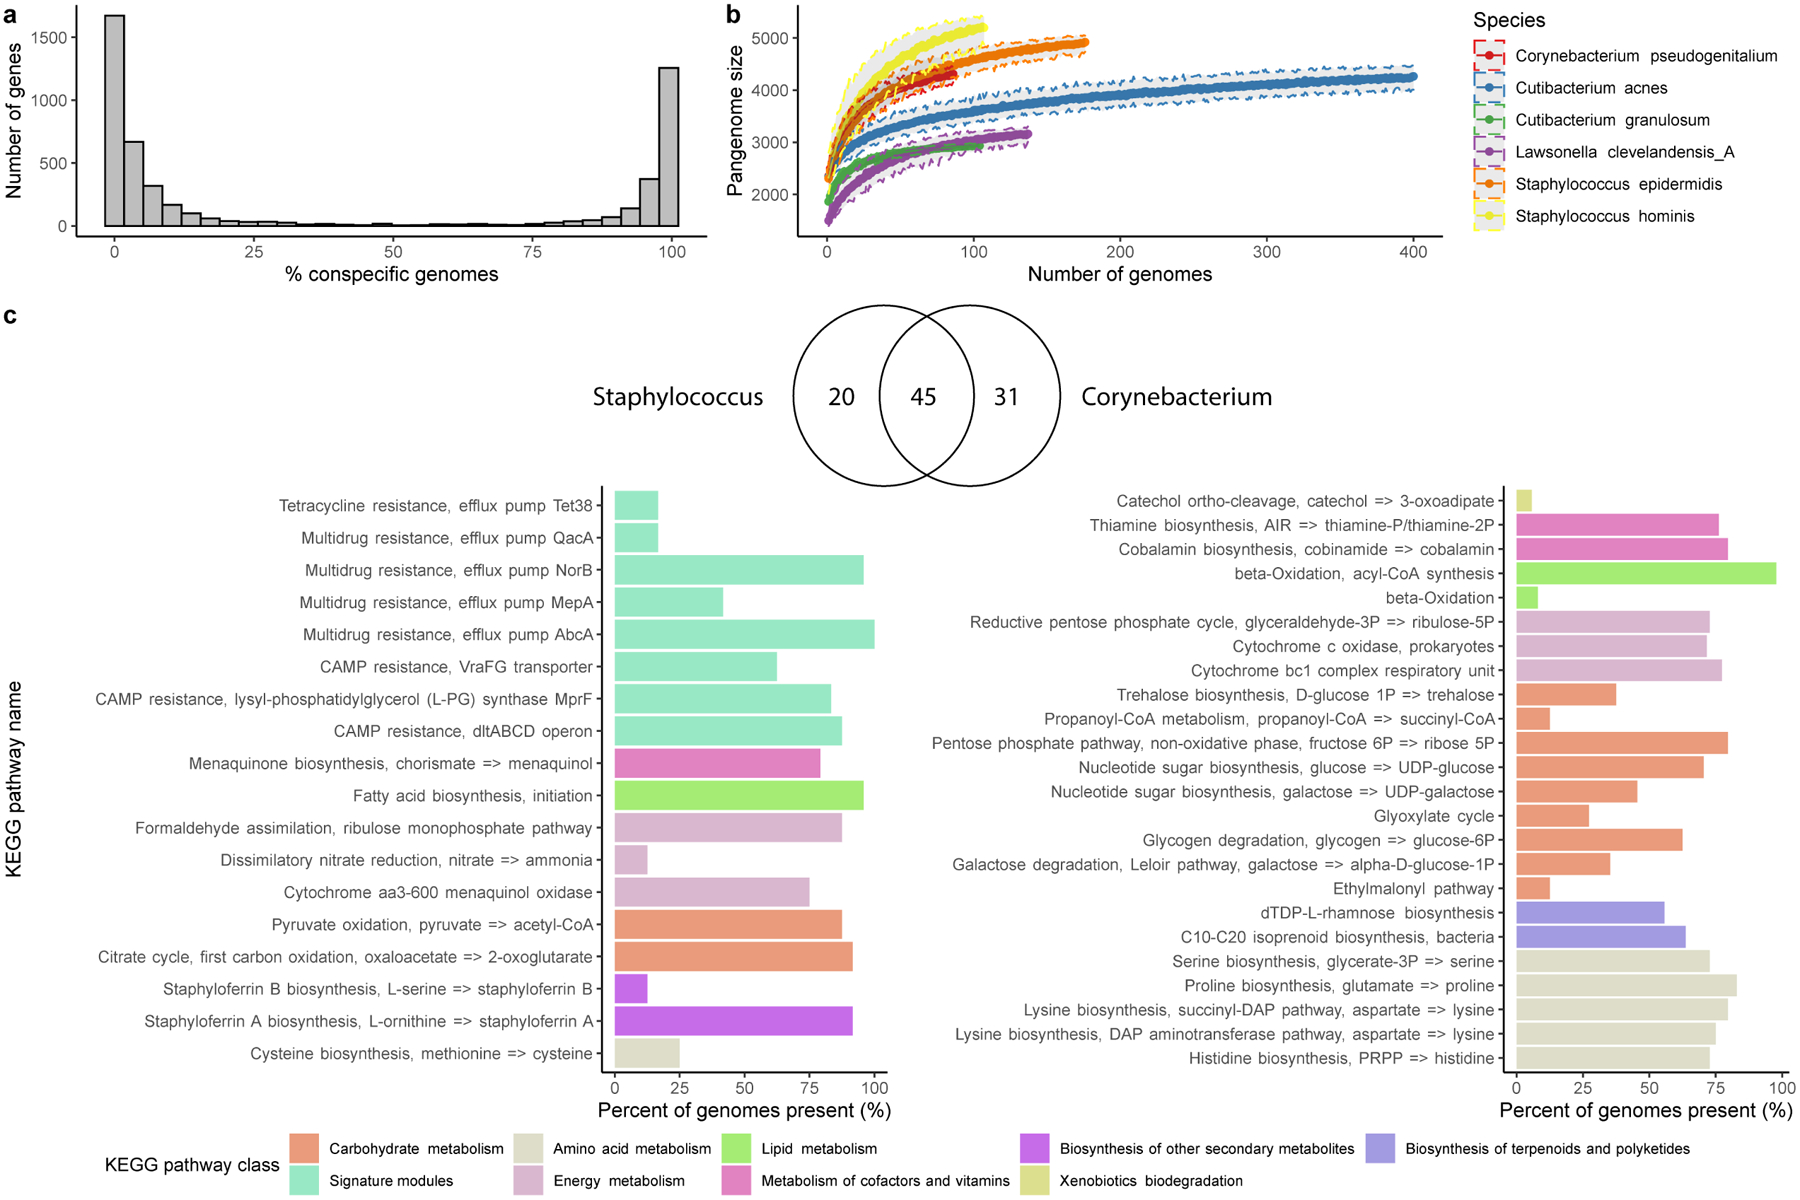
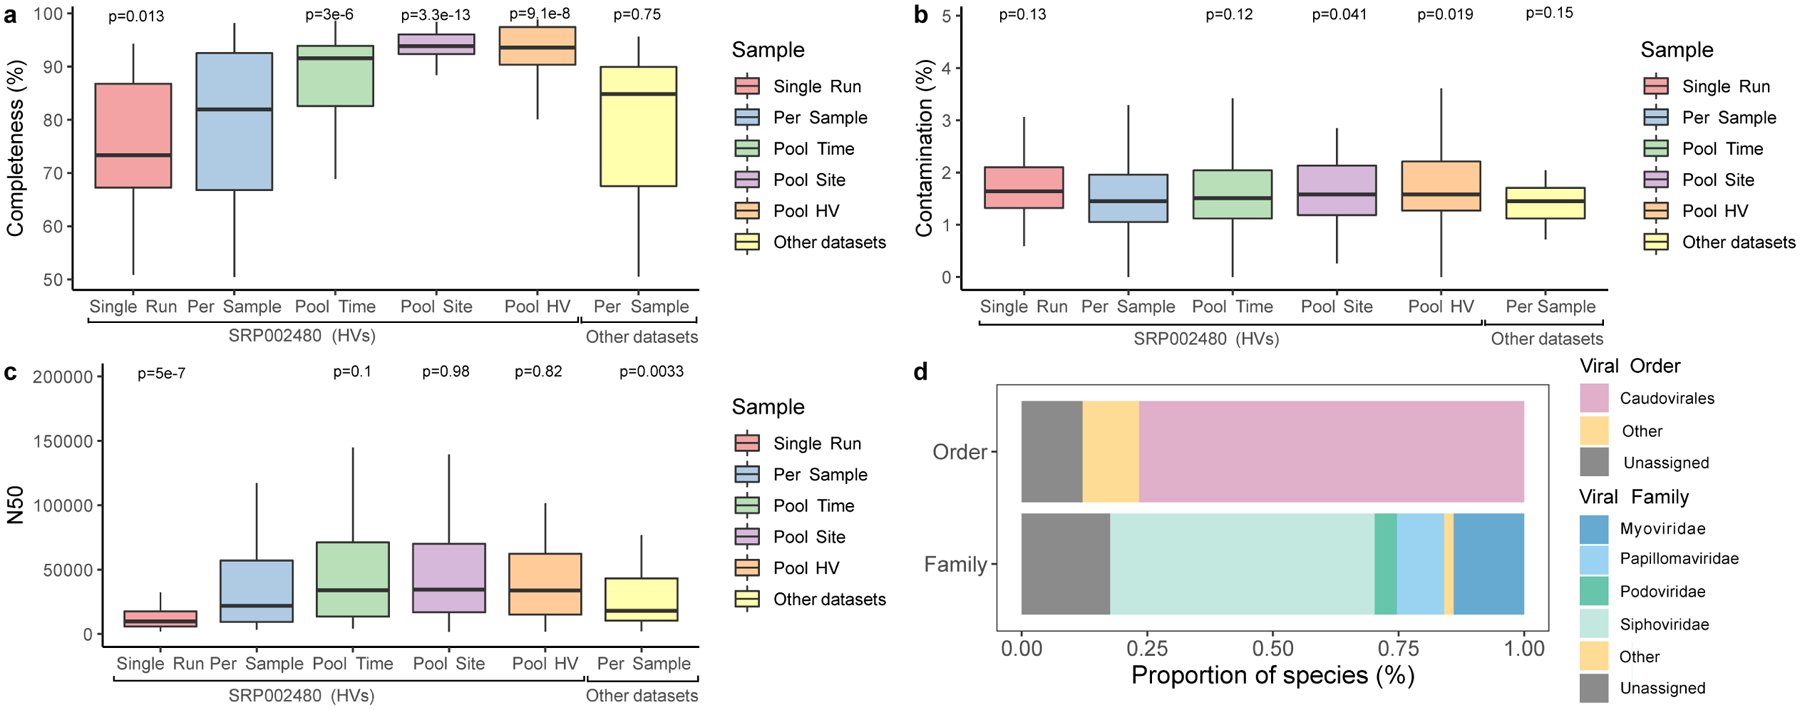
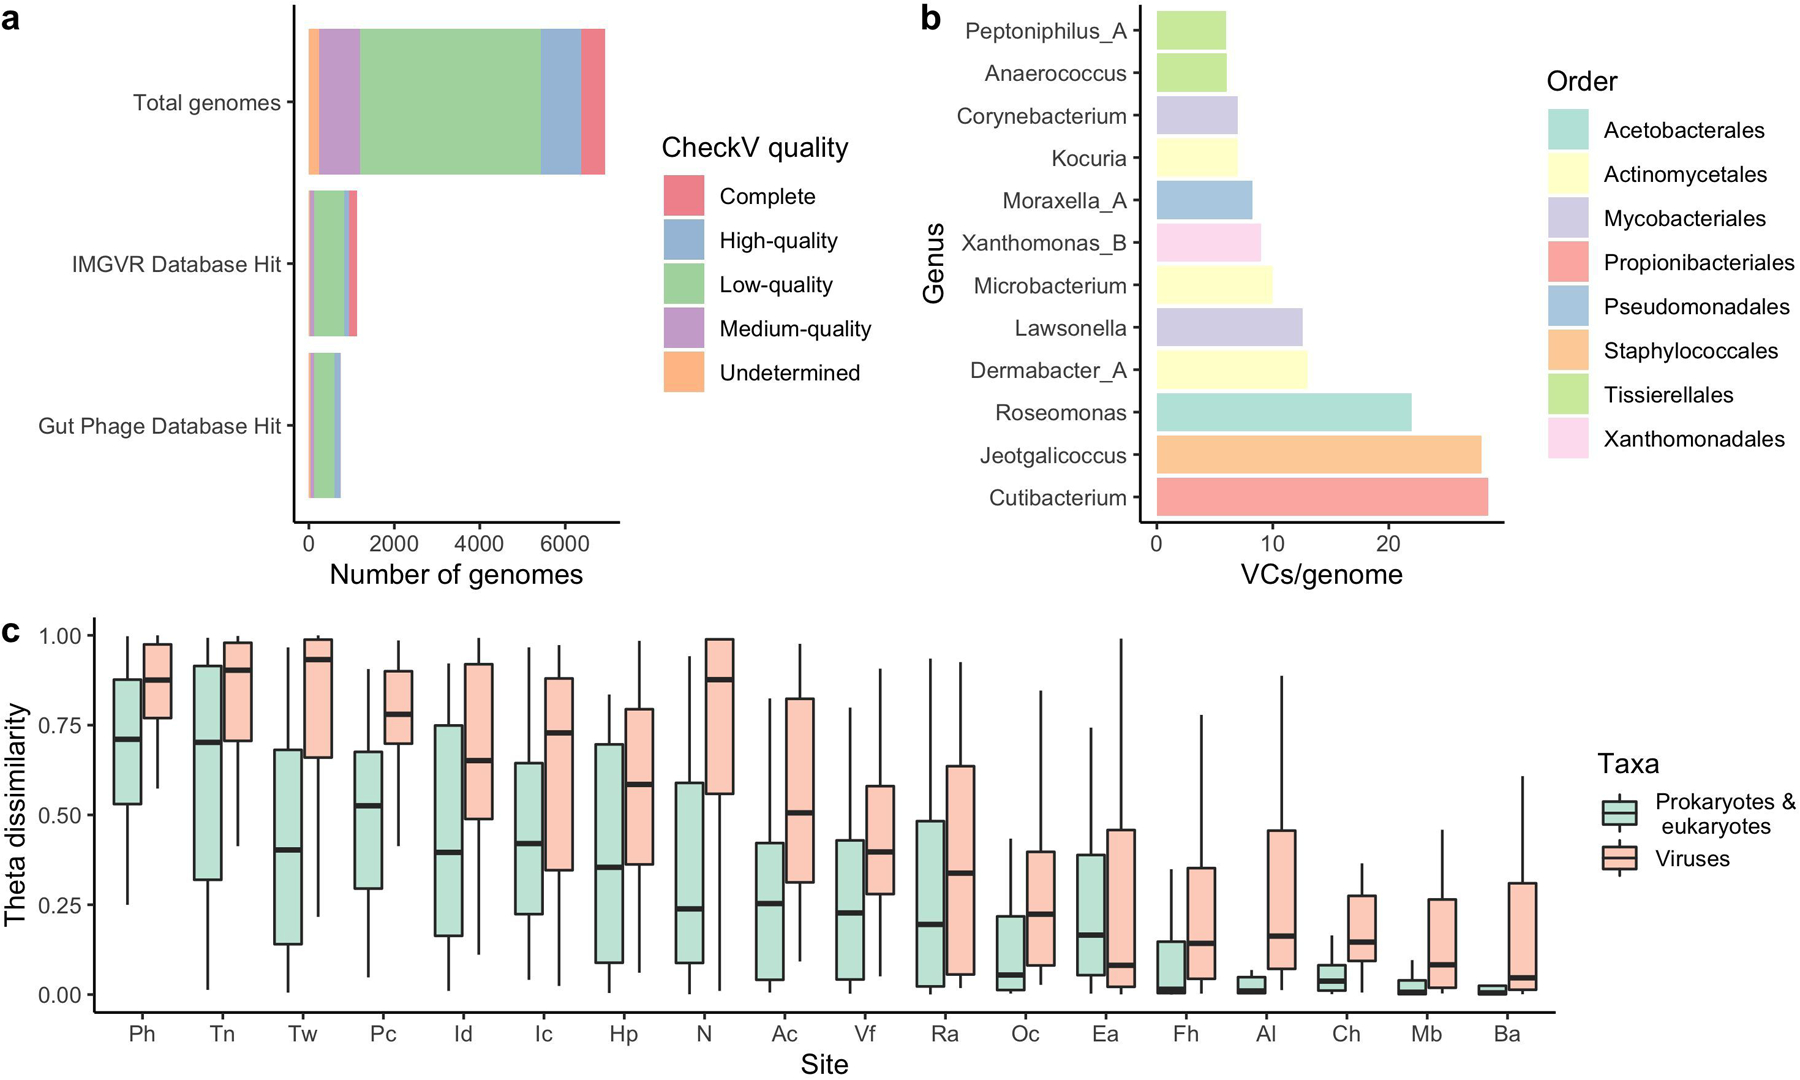
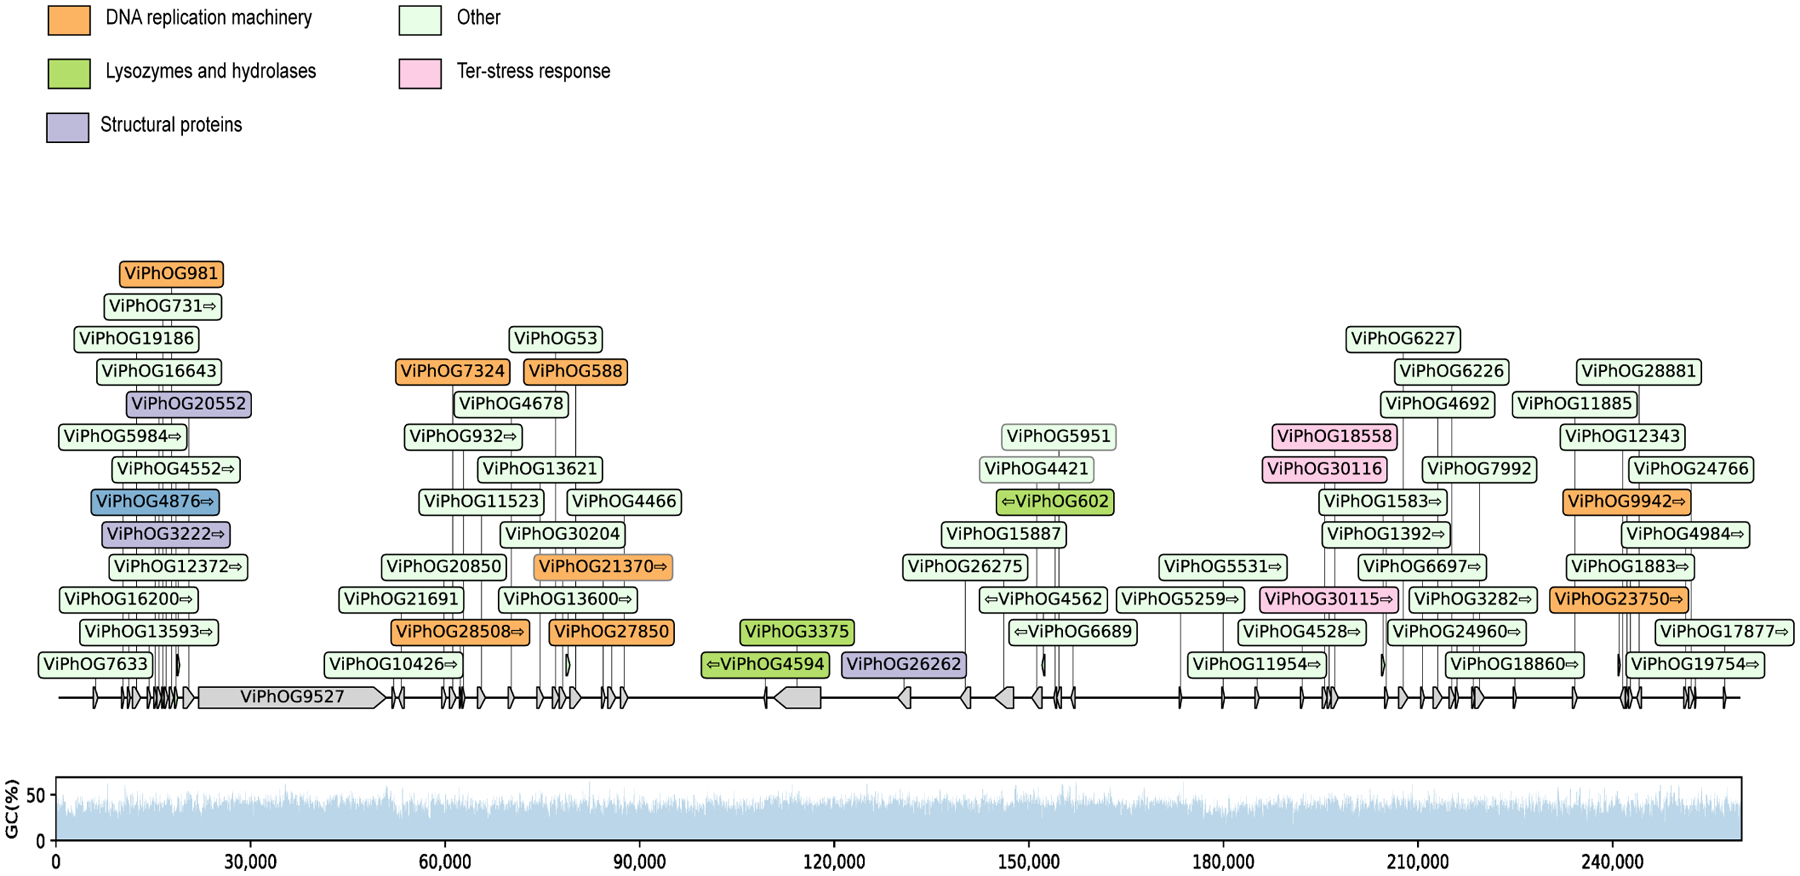
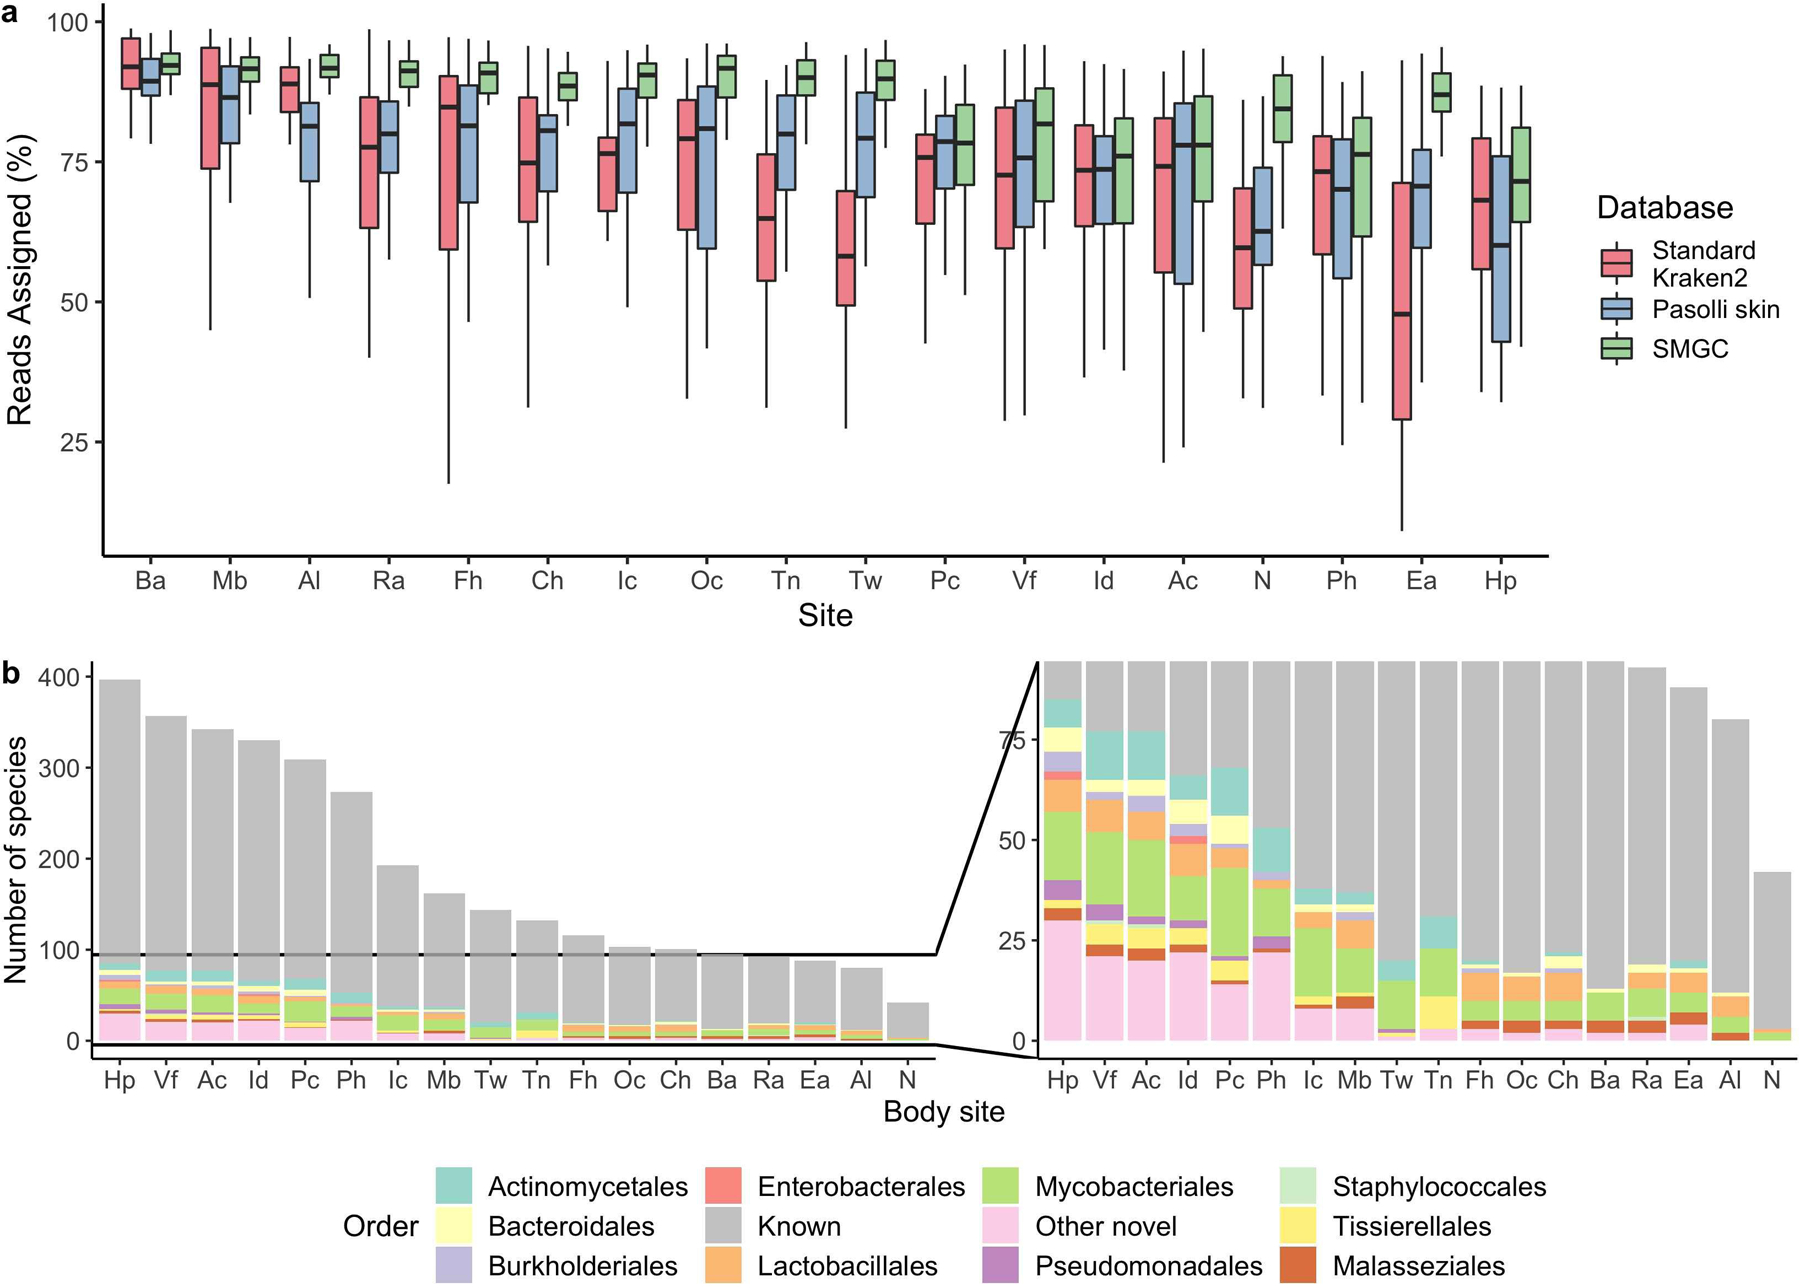
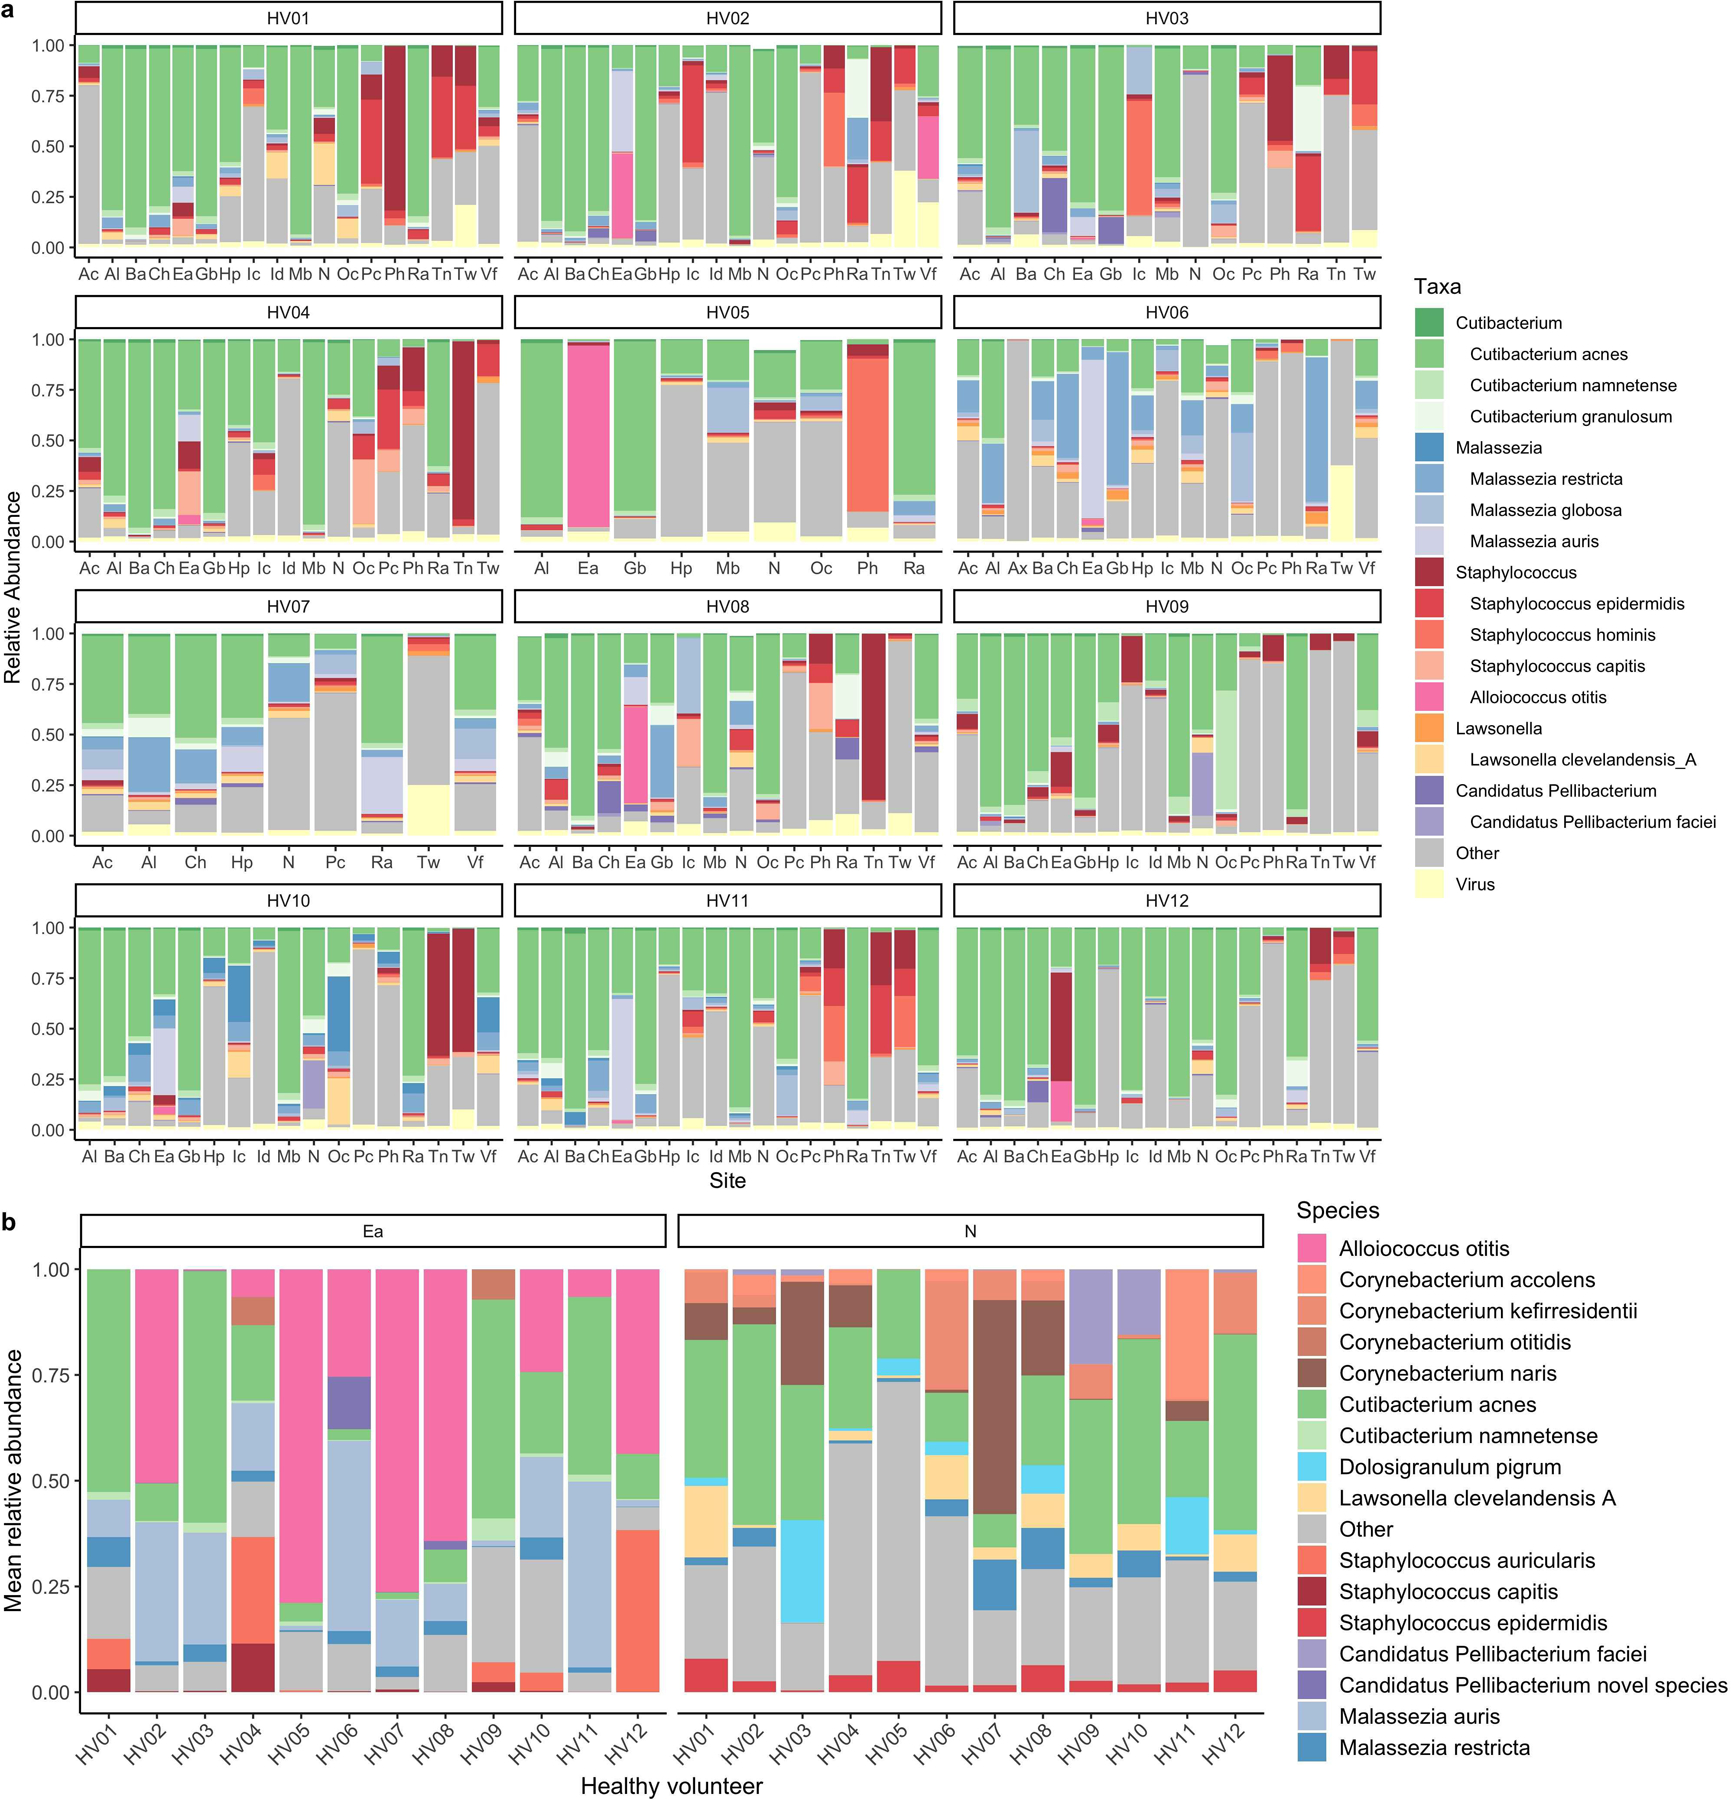
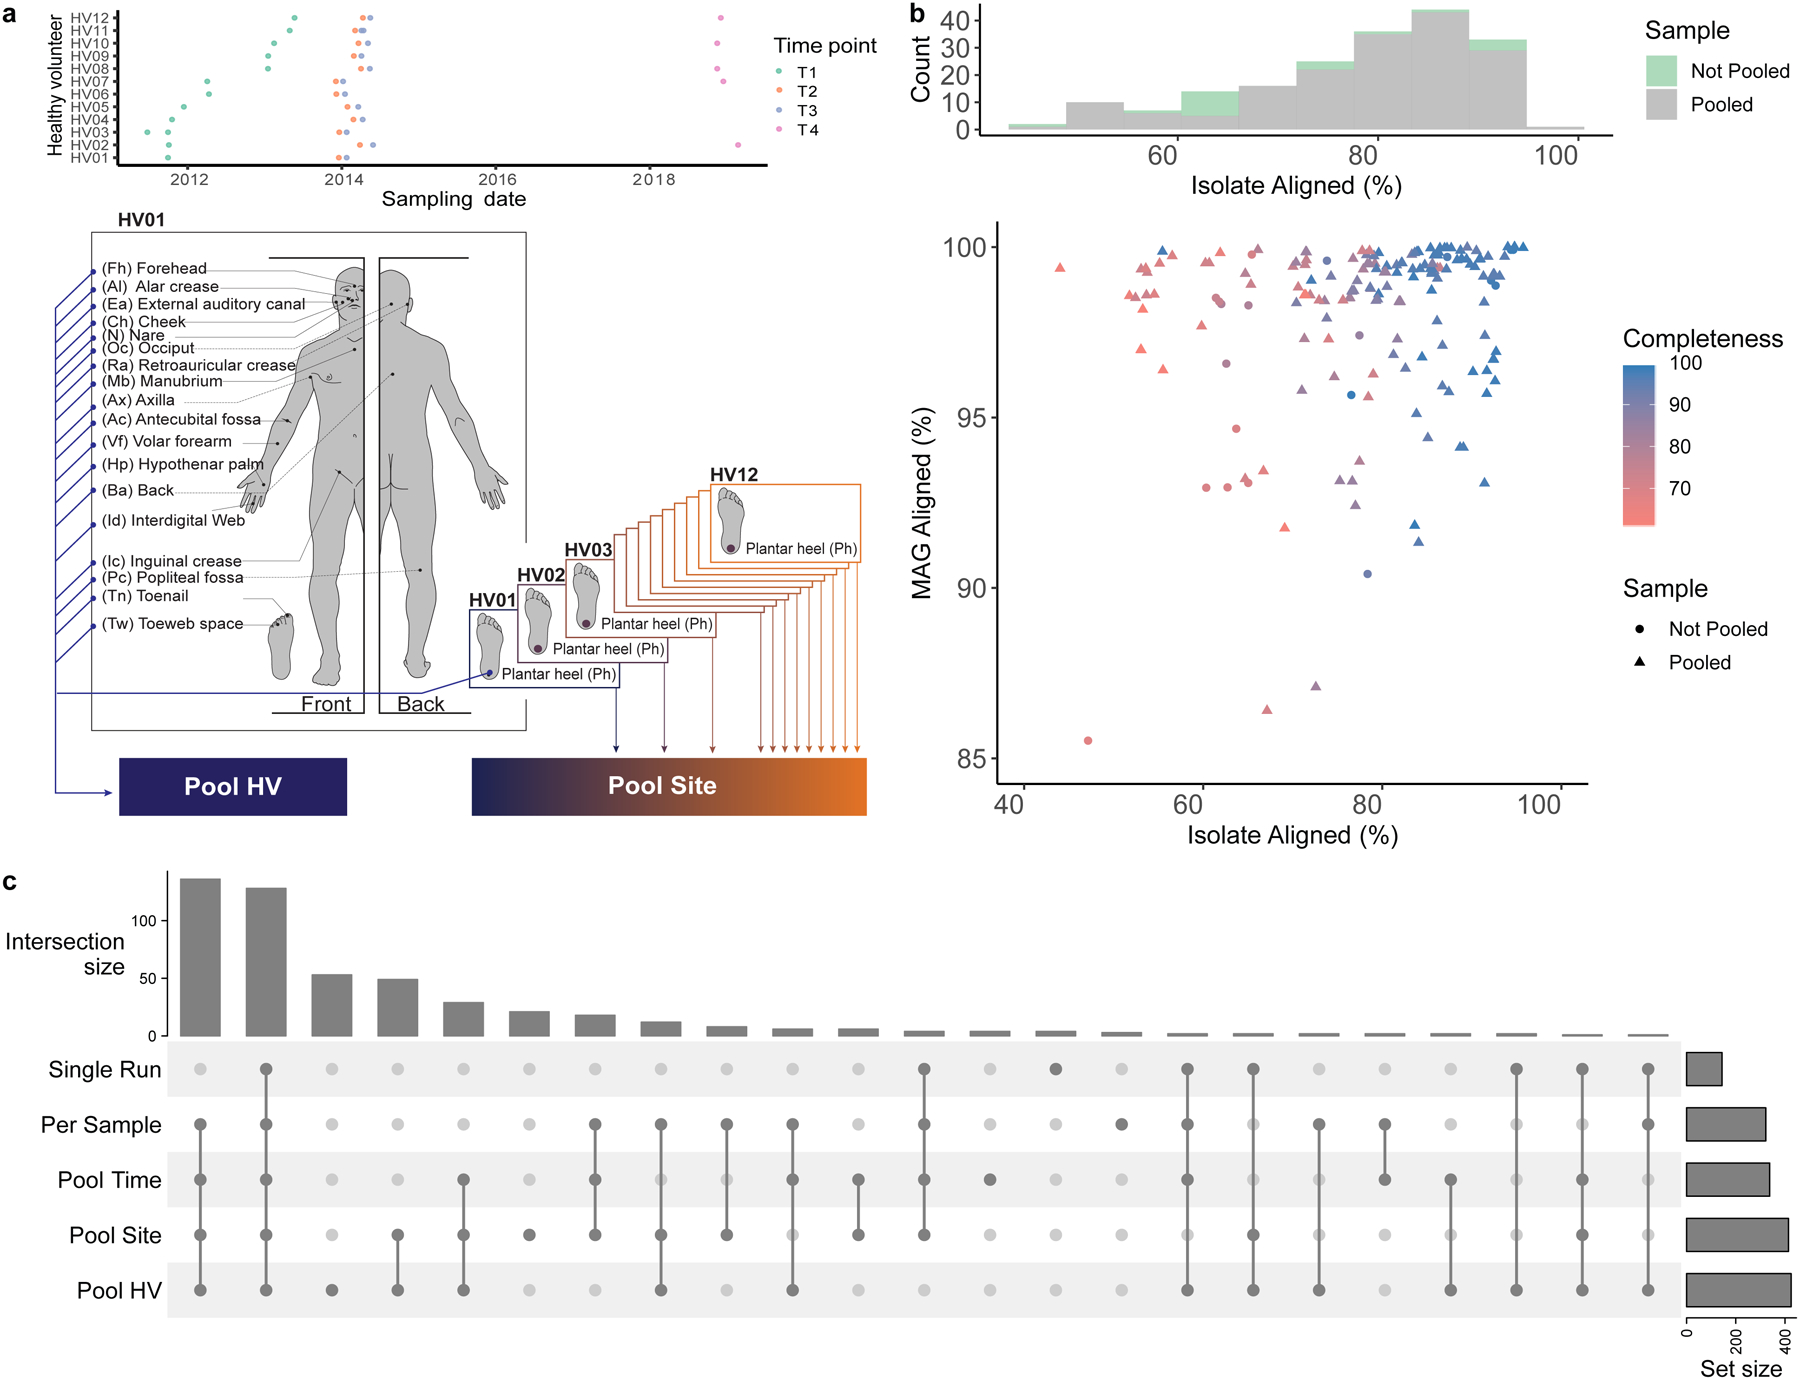
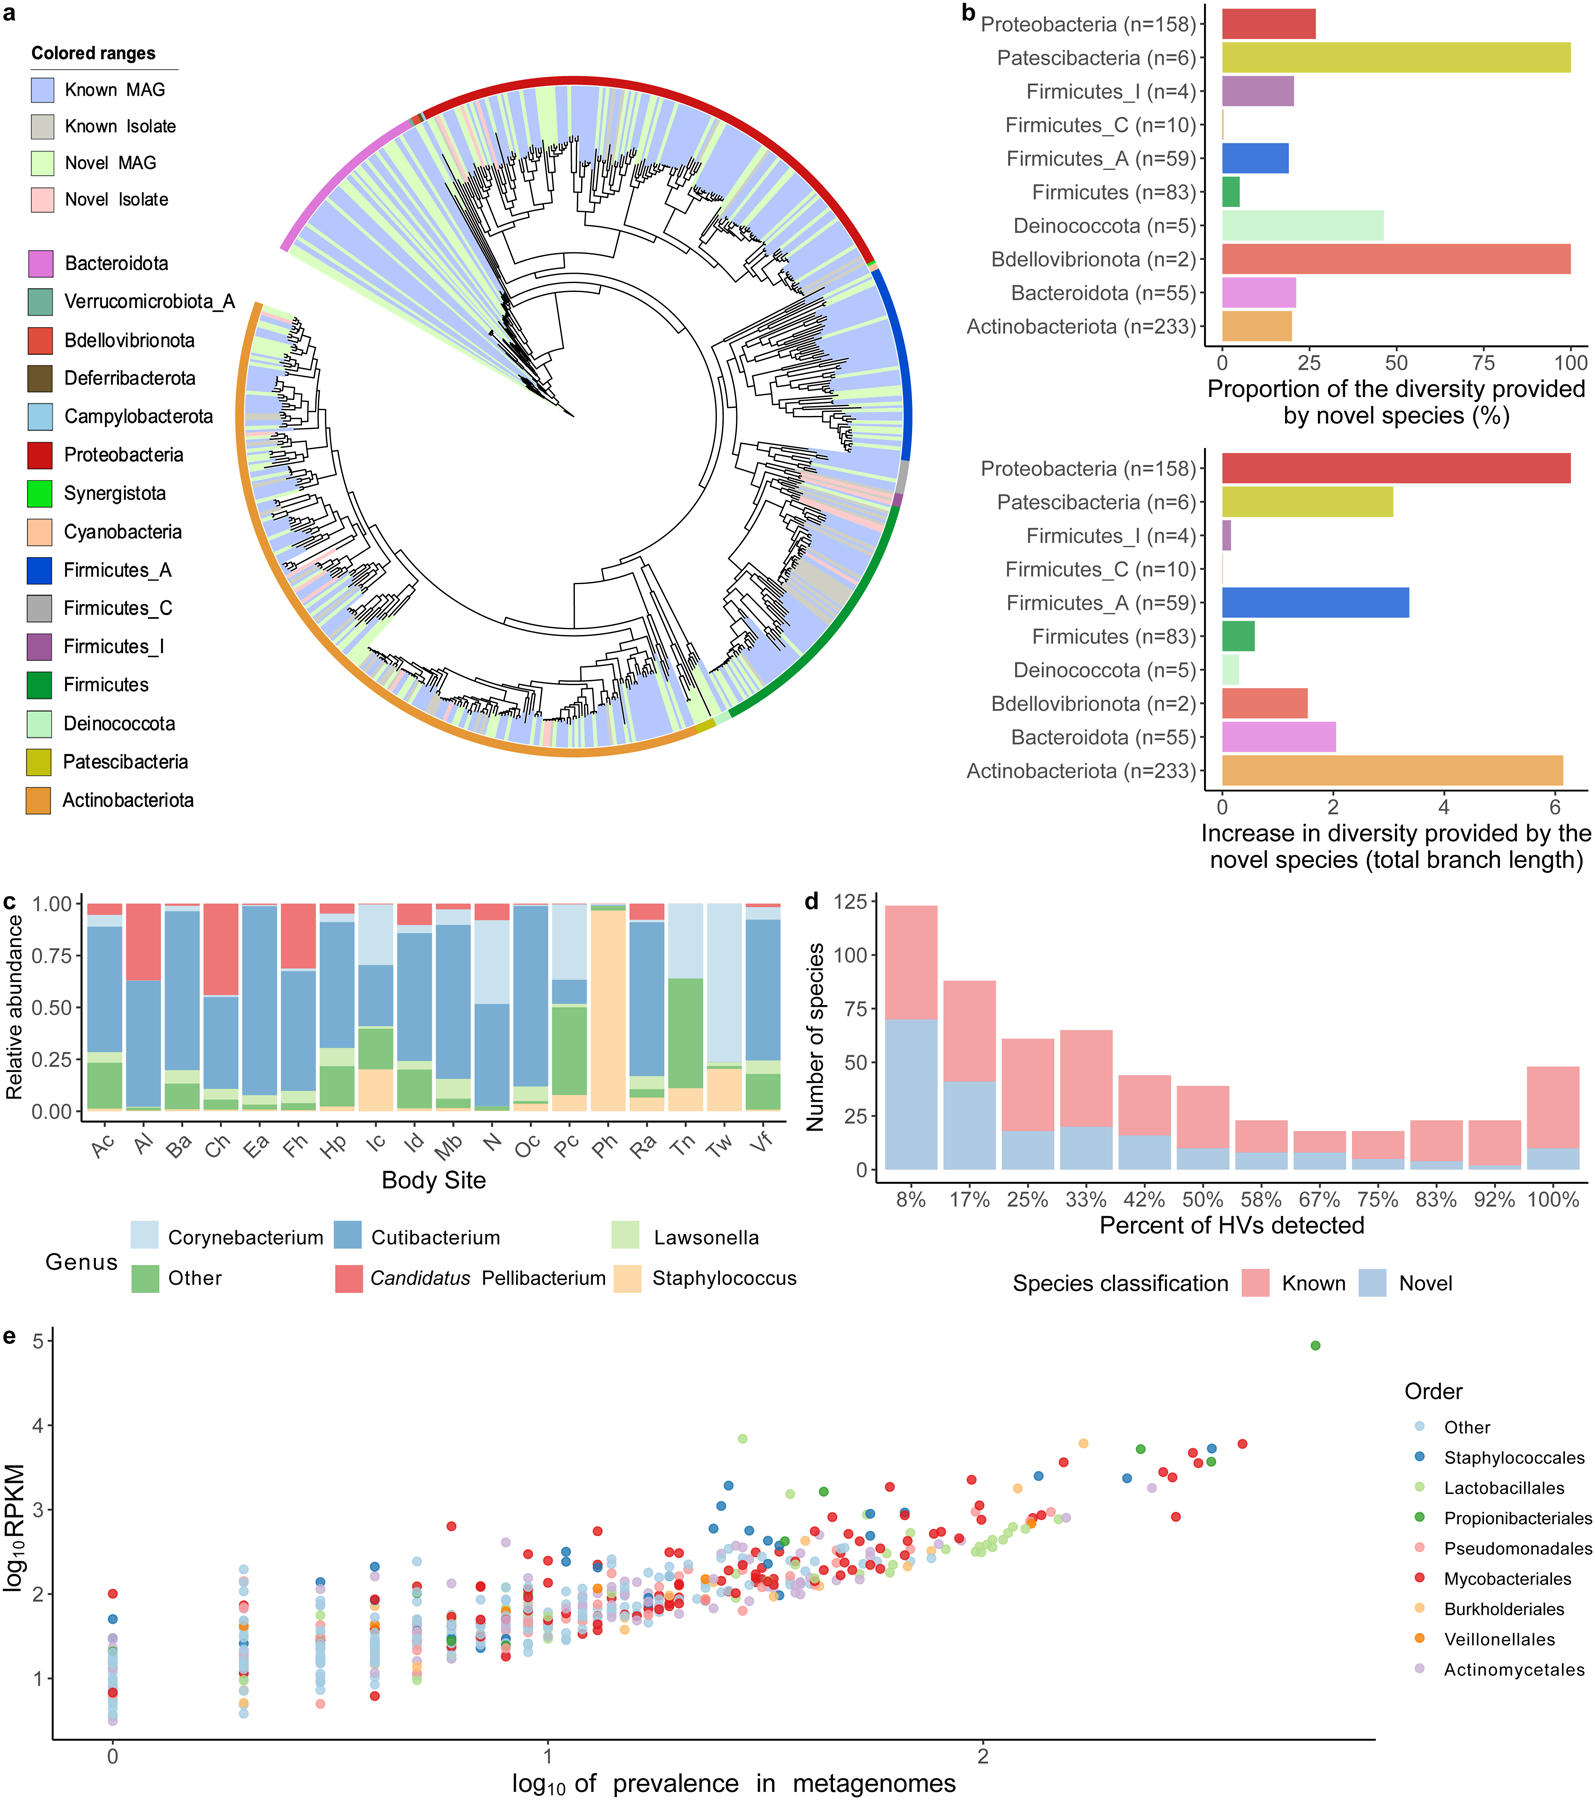
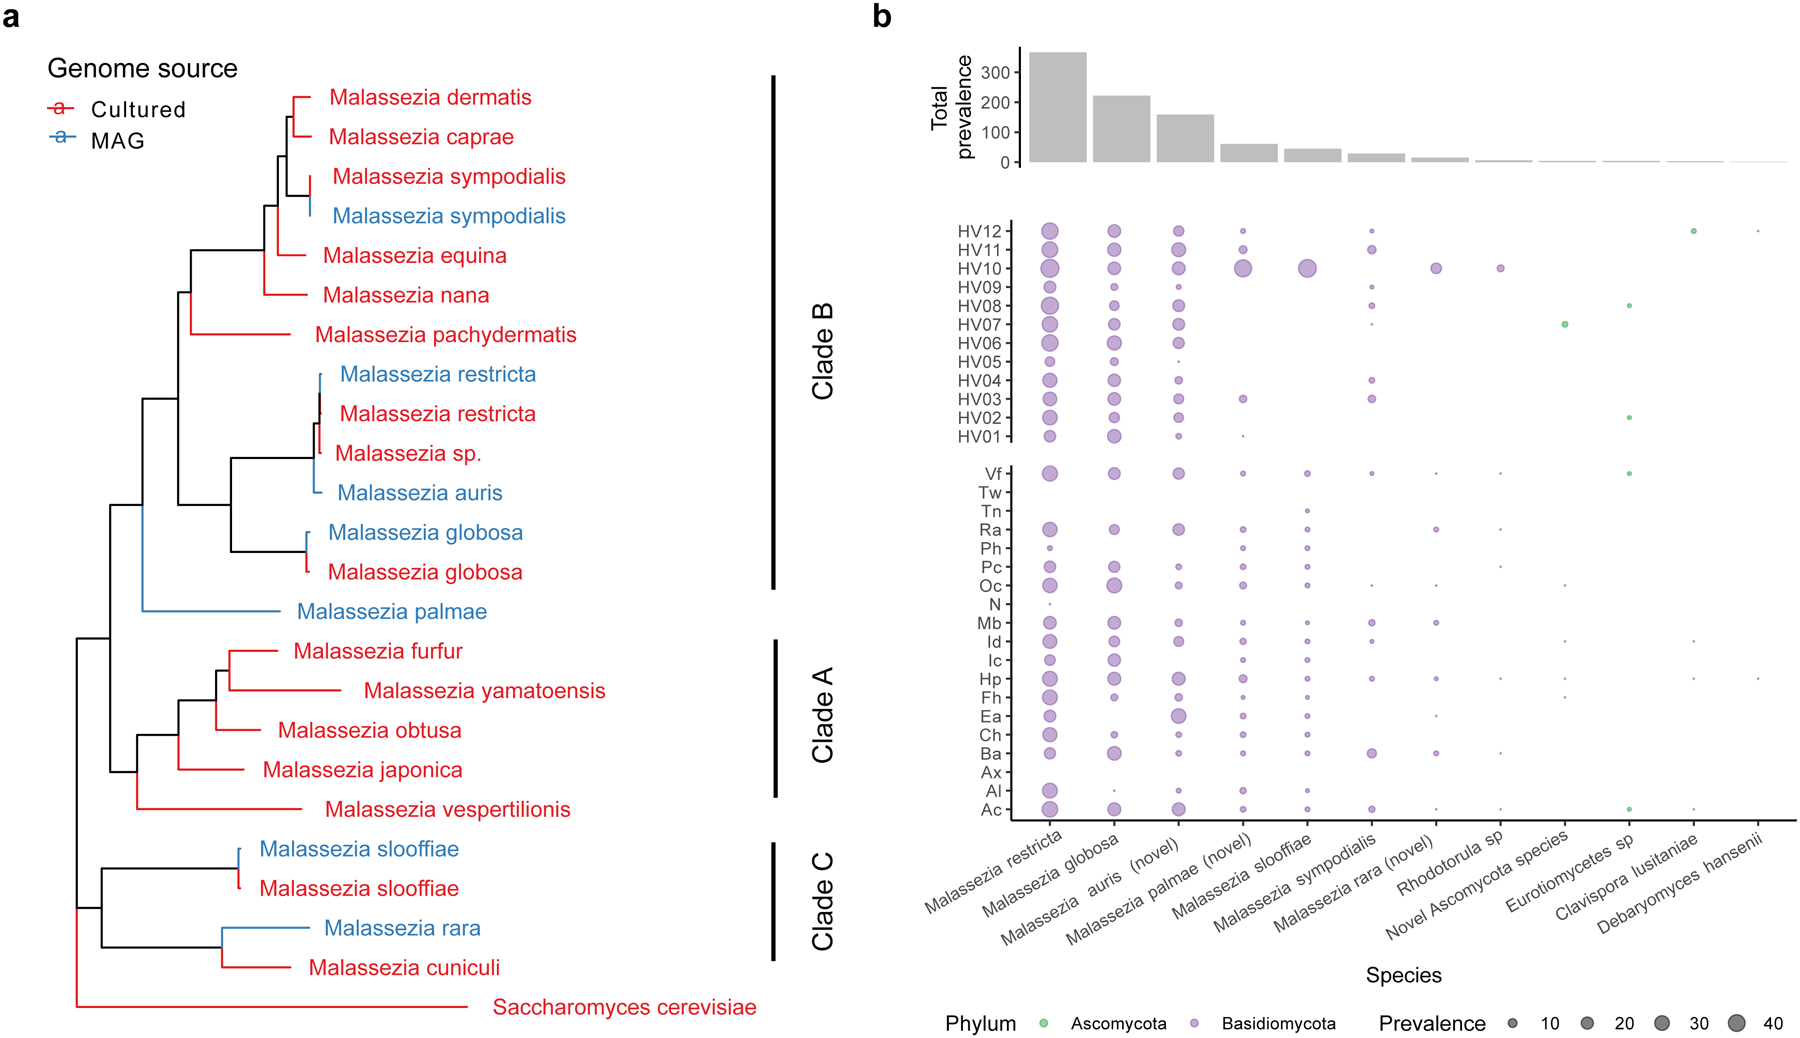
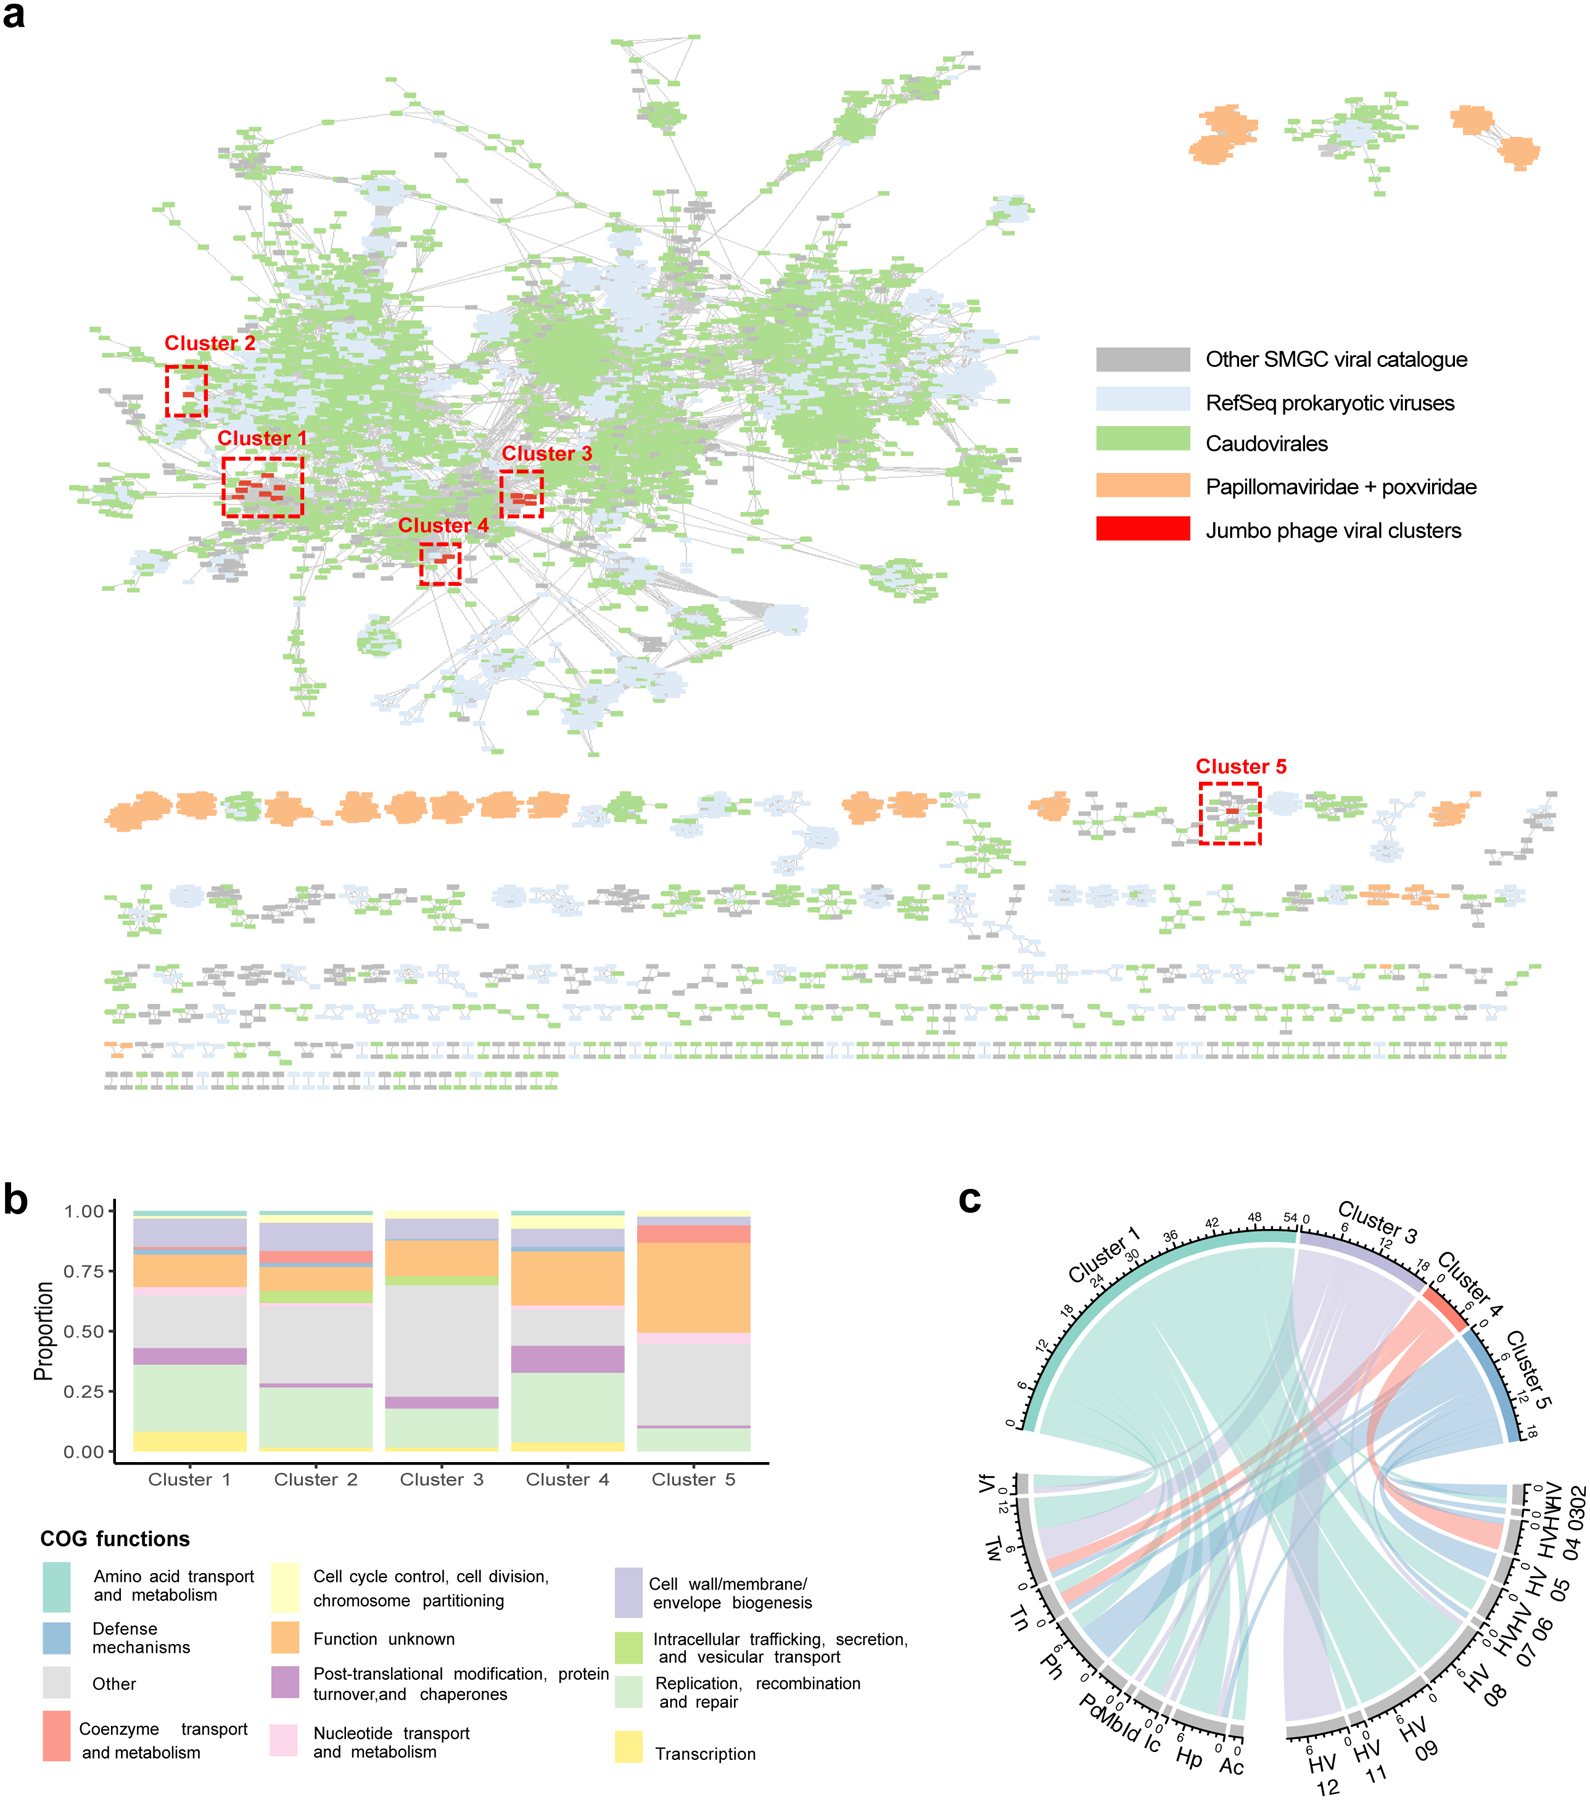
Human skin functions as a physical barrier to foreign pathogen invasion and houses numerous commensals. Shifts in the human skin microbiome have been associated with conditions ranging from acne to atopic dermatitis. Previous metagenomic investigations into the role of the skin microbiome in health or disease have found that much of the sequenced data do not match reference genomes, making it difficult to interpret metagenomic datasets. We combined bacterial cultivation and metagenomic sequencing to assemble the Skin Microbial Genome Collection (SMGC), which comprises 622 prokaryotic species derived from 7,535 metagenome-assembled genomes and 251 isolate genomes. The metagenomic datasets that we generated were combined with publicly available skin metagenomic datasets to identify members and functions of the human skin microbiome. The SMGC collection includes 174 newly identified bacterial species and 12 newly identified bacterial genera, including the abundant genus 'Candidatus Pellibacterium', which has been newly associated with the skin. The SMGC increases the characterized set of known skin bacteria by 26%. We validated the SMGC metagenome-assembled genomes by comparing them with sequenced isolates obtained from the same samples. We also recovered 12 eukaryotic species and assembled thousands of viral sequences, including newly identified clades of jumbo phages. The SMGC enables classification of a median of 85% of skin metagenomic sequences and provides a comprehensive view of skin microbiome diversity, derived primarily from samples obtained in North America.


Conflict of interest statement

Competing Interests

The authors declare no competing interests.

Figures

Extended Data Fig. 1.
Extended Data Fig. 1.. Genome statistics of the prokaryotic skin MAGs.
a, The completeness and b, contamination estimates for genomes (Single Run, n=2,389; Per Sample, n=1,206; Pool Time, n=973; Pool Site, n=1,171; Pool HV, n=1,054, Other datasets, n=1,099) recovered from different metagenomic samples as determined by CheckM. ‘Other datasets’ refers to skin metagenomes excluding the healthy volunteer dataset SRP002480. c, N50 of these MAGs as determined through BBMap. Significance for a-c was determined using the two tailed t-test relative to Per Sample, with ns representing not significant. d, The mean proportion of these genomes classified as taxonomically mismatched by comparing the annotation of the bin to the annotation of each contig via the contig annotation tool (CAT). ‘No support’ indicates that no taxonomic annotation was available at the respective rank. In panels a, b and c, box lengths represent the IQR of the data, with whiskers depicting the lowest and highest values within 1.5 times the IQR of the first and third quartiles, respectively.
Extended Data Fig. 2
Extended Data Fig. 2. Comparison of MAG and SBCC isolate genomes.
a, Misassembled fraction as a proportion of the total genome length, estimated by QUAST. b, Single-nucleotide mismatches between MAGs and isolates per 100 kbp. c, percent MAG aligned, and d, percent isolate aligned for all pairwise MAG-isolate matches sharing >=99% average nucleotide identity across different pooling strategies (Single Run, n=124; Per Sample, n=91; Pool Time, n=116; Pool Site, n=134; Pool HV, n=115). e, CheckM completeness relative to percent isolate aligned for these MAGs, colored by pooling strategies. The majority of the points fall below the dashed identity line, indicating that CheckM frequently overestimates genome completeness f, Dot plot of a novel Corynebacterium MAG obtained through Pool HV and the matching isolate, cultured from the same healthy volunteer. In panels a, b, c and d, box lengths represent the IQR of the data, with whiskers depicting the lowest and highest values within 1.5 times the IQR of the first and third quartiles, respectively.
Extended Data Fig. 3.
Extended Data Fig. 3.. Comparison of the number of species recovered by each sampling strategy.
Venn diagram of the number of species recovered by single run/per sample and pooled approaches (Pool Time, Pool HV, Pool Site) as part of the study accession SRP002480 or by a per sample investigation of other publicly available metagenomic datasets (other studies).
Extended Data Fig. 4
Extended Data Fig. 4. The metabolisms of the prokaryotic SMGC MAGs and isolates.
Annotation of the prokaryotic SMGC using DRAM shows that clades largely represented by uncultured species (outlined in black) are depleted in pathways involved in aerobic respiration, suggesting that the standard skin culture conditions are not able to capture the full diversity of microbes found on human skin.
Extended Data Fig. 5.
Extended Data Fig. 5.. Gene frequency and metabolic pathway distribution of species from abundant skin genera.
a, Number of genes in relation to the number of near-complete (≥90% completeness) conspecific genomes recovered for Staphylococcus epidermidis. Other species showcased in b, showed similar distributions. b, Genome accumulation curves of the number of genes detected as a function of the number of non-redundant genomes analyzed. c, Venn diagram of the number of KEGG pathways shared by the two genera Staphylococcus and Corynebacterium. Barplot comparing the predominant KEGG pathways unique to the Staphylococcus or the Corynebacterium skin genomes only showing pathways present in at least 5% of the genomes.
Extended Data Fig. 6.
Extended Data Fig. 6.. Quality and taxonomic classification of fungal and viral genomes.
a, Genome completeness and b contamination of the 499 eukaryotic MAGs estimated by EukCC. c N50 for these MAGs determined via BBMap. The number of bins were 81 for Single Run, 123 for Per Sample, 112 for Pool Time, 87 for Pool Site, 65 for Pool HV, and 31 for Other datasets. Significance was determined using the two tailed t-test relative to Per Sample, with ns representing not significant. ‘Other datasets’ refers to skin metagenomes excluding the healthy volunteer dataset, which is a part of the study SRP002480. d, Taxonomic classification of the viral genomes according to DemoVir. In panels a, b and c, box lengths represent the IQR of the data, with whiskers depicting the lowest and highest values within 1.5 times the IQR of the first and third quartiles, respectively.
Extended Data Fig. 7.
Extended Data Fig. 7.. The human skin harbors vast viral diversity, of which the sebaceous sites remain stable over time.
a, The number of viral genomes in the SMGC colored by their assigned CheckV quality. Comparison of the putative viral genomes to IMG/VR and the Gut Phage Database reveals that only a small fraction of the virome has been previously identified. b, The number of viral sequences detected for each SMGC bacterial genus using CRISPR host analysis. c, The stability of the SMGC over time for different body sites as estimated by the theta dissimilarity metric, with a theta dissimilarity of zero indicating high similarity. When calculating the theta dissimilarity, comparisons were made between the same body site of the same healthy volunteer over time. Body sites (Ac, n=39; Al, n=36; Ba, n=33; Ch, n=35; Ea, n=35; Fh, n=34; Hp, n=35; Ic, n=34; Id, n=32; Mb, n=35; N, n=42; Oc, n=36; Pc, n=35; Ph, n=36; Ra, n=41; Tn, n=32; Tw, n=35; Vf, n=38) are defined in Figure 1a. The Ax was excluded due to limited sampling. Box lengths represent the IQR of the data, with whiskers depicting the lowest and highest values within 1.5 times the IQR of the first and third quartiles, respectively.
Extended Data Fig. 8.
Extended Data Fig. 8.. Quality assessment of the cluster 5 jumbo phage genome.
Distribution of viral protein families (ViPhOGs) and the GC (%) content along the cluster 5 jumbo phage genome reveals that viral proteins are evenly distributed and GC (%) content is consistent.
Extended Data Fig. 9.
Extended Data Fig. 9.. The SMGC improves classification of the skin microbiome.
a, Percentage of sequencing reads from different body sites classified by the SMGC as compared to the standard Kraken 2 database and the Pasolli et al skin prokaryotic MAGs. Box lengths represent the IQR of the data, with whiskers depicting the lowest and highest values within 1.5 times the IQR of the first and third quartiles, respectively. b, The species in the SMGC present at different body sites. Novelty was determined by comparison to both the GTDB database and the Pasolli et al catalogue. Body sites (Ac, n=39; Al, n=36; Ba, n=33; Ch, n=35; Ea, n=35; Fh, n=34; Hp, n=35; Ic, n=34; Id, n=32; Mb, n=35; N, n=42; Oc, n=36; Pc, n=35; Ph, n=36; Ra, n=41; Tn, n=32; Tw, n=35; Vf, n=38) are defined in Figure 1a. The Ax was excluded due to limited sampling.
Extended Data Fig. 10.
Extended Data Fig. 10.. A new multi-kingdom view of the healthy human skin microbiome.
a, Relative abundance of viruses and members from the top 6 most abundant skin genera across the healthy volunteers for the first time point. Body sites are defined in Figure 1a. b, Mean relative abundance across time of the most abundant species found in the external auditory ear canal and the nares for each healthy volunteer.
Fig. 1.
Fig. 1.. Metagenome assembly strategies for the recovery of skin microbial genomes.
a, Samples obtained from 19 body sites of 12 healthy volunteers over 4 time points were collected and sequenced. Metagenomic datasets were concatenated per healthy volunteer (Pool HV), and per body site (Pool Site). For a description of all pooling strategies, including Pool Time, see Methods. b, Assessment of the quality of the MAG aligning best to each SBCC isolate. Histogram shows the number of MAGs from Single Run and Per Sample or Pooled (Pool Time, Pool HV, Pool Site) strategies that best align to an SBCC isolate. Graph depicts the percent aligned for each SBCC isolate and its corresponding MAG. c, UpSet plot showing the number of species recovered using the different assembly approaches.
Fig. 2.
Fig. 2.. A comprehensive collection of skin microbial genomes uncovers abundant and prevalent bacterial diversity.
a, Phylogenetic tree of the 621 bacterial MAGs and cultured isolates colored by phyla and whether these are novel or known species. b, Level of phylogenetic diversity provided by the novel species relative to the complete diversity per phylum (top) and represented as absolute total branch lengths (bottom). The number of species from each phylum is depicted in brackets. c, Relative abundance of the most abundant genera found on the skin using the second time point of healthy volunteer HV03 as a representative. Body sites defined in Fig. 1a. d, The number of species shared between the 12 healthy volunteers, colored by their novelty. Presence was defined as having at least 30% of the bacterial genome covered in a sample from any time point or body site for a healthy volunteer. e, The prevalence and abundance (log10RPKM) of the SMGC colored by their taxonomic classification.
Fig. 3.
Fig. 3.. Expanded fungal diversity associated with human skin.
a, A phylogenetic tree of the 7 Malassezia MAGs and 16 reference genomes built using 452 BUSCOs with Saccharomyces cerevisiae as the outgroup. All clades had a bootstrap support of 100% using 1000 replicates. b, Prevalence of the fungal species in all clinical samples, across different healthy volunteers and body sites using 30% aligned fraction of the genome to assign presence. Body sites are defined in Figure 1a.
Fig. 4.
Fig. 4.. Jumbo phages found on the human skin are shared between individuals and body sites.
a, Clustering of viral genomes from the SMGC and RefSeq based on shared protein content. Each node in the network represents a genome and each edge indicates similarity between the corresponding genomes. Clusters with fewer than five members were excluded. Clusters of jumbo phages are boxed in red. b, Functional annotation of the viral genome clusters summarized via COG functional categories. c, Chord diagram depicting the number of samples where we detected each viral cluster across our 12 healthy volunteers and body sites with presence defined as at least 75% of the genome being covered. Body sites are defined in Figure 1a.

References

    1. Oh J, Byrd AL, Deming C, Conlan S, NISC Comparative Sequencing Program, Kong HH et al. Biogeography and individuality shape function in the human skin metagenome. Nature 2014; 514: 59–64. - PMC - PubMed
    1. Byrd AL, Belkaid Y, Segre JA. The human skin microbiome. Nat Rev Microbiol 2018; 16: 143–155. - PubMed
    1. Oh J, Byrd AL, Park M, NISC Comparative Sequencing Program, Kong HH, Segre JA. Temporal Stability of the Human Skin Microbiome. Cell 2016; 165: 854–866. - PMC - PubMed
    1. Myles IA, Reckhow JD, Williams KW, Sastalla I, Frank KM, Datta SK. A method for culturing Gram-negative skin microbiota. BMC Microbiol 2016; 16: 60. - PMC - PubMed
    1. Timm CM, Loomis K, Stone W, Mehoke T, Brensinger B, Pellicore M et al. Isolation and characterization of diverse microbial representatives from the human skin microbiome. Microbiome 2020; 8: 58. - PMC - PubMed

Publication types

MeSH terms