. 2022 Apr 1;43(5):1749-1765.
doi: 10.1002/hbm.25755. Epub 2021 Dec 24.

Rapid processing and quantitative evaluation of structural brain scans for adaptive multimodal imaging

Affiliations

Rapid processing and quantitative evaluation of structural brain scans for adaptive multimodal imaging

František Váša et al. Hum Brain Mapp. .

Abstract

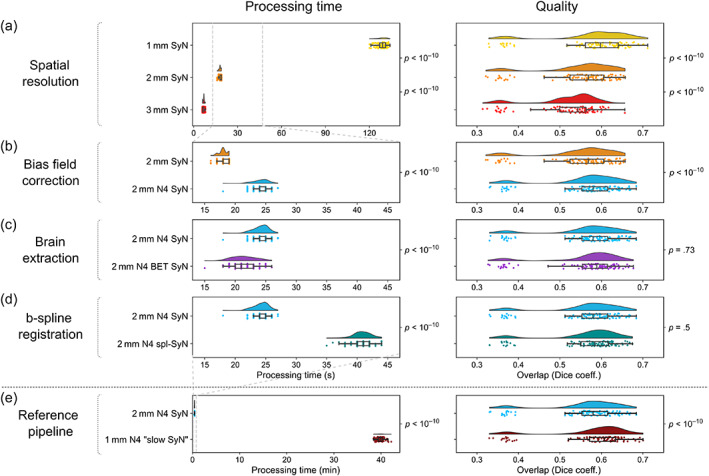
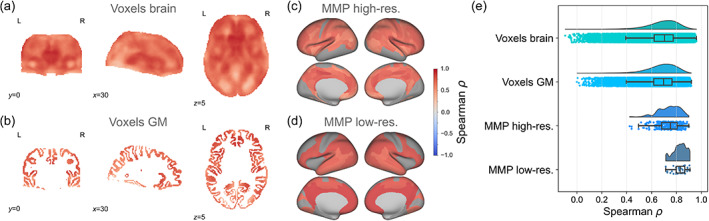
Current neuroimaging acquisition and processing approaches tend to be optimised for quality rather than speed. However, rapid acquisition and processing of neuroimaging data can lead to novel neuroimaging paradigms, such as adaptive acquisition, where rapidly processed data is used to inform subsequent image acquisition steps. Here we first evaluate the impact of several processing steps on the processing time and quality of registration of manually labelled T1 -weighted MRI scans. Subsequently, we apply the selected rapid processing pipeline both to rapidly acquired multicontrast EPImix scans of 95 participants (which include T1 -FLAIR, T2 , T2 *, T2 -FLAIR, DWI and ADC contrasts, acquired in ~1 min), as well as to slower, more standard single-contrast T1 -weighted scans of a subset of 66 participants. We quantify the correspondence between EPImix T1 -FLAIR and single-contrast T1 -weighted scans, using correlations between voxels and regions of interest across participants, measures of within- and between-participant identifiability as well as regional structural covariance networks. Furthermore, we explore the use of EPImix for the rapid construction of morphometric similarity networks. Finally, we quantify the reliability of EPImix-derived data using test-retest scans of 10 participants. Our results demonstrate that quantitative information can be derived from a neuroimaging scan acquired and processed within minutes, which could further be used to implement adaptive multimodal imaging and tailor neuroimaging examinations to individual patients.

Keywords: EPImix; MRI; fingerprinting; identifiability; morphometric similarity; reliability; structural covariance.


Figures

FIGURE 1
FIGURE 1
Overview of analysis steps. (a) A rapid processing pipeline for T1‐w scans was evaluated using the manually labelled Mindboggle dataset (Klein & Tourville, ; for details, see Figure 2). (b) The pipeline was used to process T1‐FLAIR scans derived from the rapid multicontrast EPImix sequence (Skare et al., 2018) as well as single‐contrast (IR‐FSPGR) T1‐w scans. (c) Jacobian determinants and tissue intensities derived from both types of T1‐w scan were compared using several methods, including correlation (across participants), inter‐individual identifiability, and structural covariance networks. (d) Additionally, we explored using the EPImix sequence to construct morphometric similarity networks (MSNs; Seidlitz et al., 2018). (e) Finally, we evaluated the test–retest reliability of all contrasts within the EPImix sequence, and of the derived MSNs
FIGURE 2
FIGURE 2
Using manual Desikan–Killiany–Tourville (DKT) atlas labels from the Mindboggle dataset to quantitatively evaluate the quality of registration (and pre‐processing steps). (a) The processing pipeline (up to and including registration) is applied to the native‐space T1‐w scan to transform it to MNI152 space and to estimate registration parameters. (b) The registration (calculated in step a) is applied to the native‐space DKT atlas. (c) The Dice coefficient is used to quantify the overlap, in MNI152 space, between the atlas labels which have been transformed from native space (in step b) and the manual atlas labels released with the Mindboggle dataset (Klein & Tourville, 2012)
FIGURE 3
FIGURE 3
Evaluation of processing time and quality of registration using the Mindboggle dataset. The effect of four processing steps was evaluated sequentially; for each step, both processing time and quality were taken into account to select one of the options, before proceeding to the next step. p‐values adjacent to neighbouring raincloud plots correspond to the (paired) Wilcoxon signed‐rank test between corresponding data (testing whether evaluated methods differ significantly in processing time or registration quality [H1], or whether there is no statistical difference between these values [H0]). (a) Spatial resolution. (b) Bias field correction. (c) Brain extraction. (d) B‐spline SyN registration. (e) An additional reference pipeline was evaluated, to benchmark any reduction in quality resulting from optimising steps a–d for speed. p‐values were not corrected for multiple comparisons, due to the sequential nature of evaluated steps. We note that even stringent multiple comparisons correction has no qualitative impact on the results. For Bonferroni‐corrected p‐values, as well as median differences in both processing time and quality between pairs of compared pipelines, see Table S1
FIGURE 4
FIGURE 4
Processing time for EPImix and single‐contrast T1‐w scans. The p‐value corresponds to the (unpaired) Mann–Whitney U test (testing whether processing times differ for EPImix and single‐contrast T1‐w scans [H1], or whether there is no statistical difference between these values [H0]). Note that a small amount of jitter was added to data to better distinguish the distribution of integer‐valued data‐points
FIGURE 5
FIGURE 5
Local correspondence of log‐Jacobians across participants. Spearman's correlations between log‐Jacobians of rapidly‐processed T1‐w scans from the EPImix sequence and a single‐contrast acquisition, using data of 66 participants. Correlations are depicted: at the voxel level for (a) the whole brain, and (b) cortical grey matter, as well as within ROIs of (c) the high‐resolution and (d) the low‐resolution multi‐modal parcellation atlas. (e) Distributions of correlations at each spatial resolution considered (as depicted in panels a–d). (At the regional level, median regional values were extracted prior to calculation of correlations for each region.)
FIGURE 6
FIGURE 6
Participant identifiability across EPImix and single‐contrast scans, using log‐Jacobians. Between‐participant correlations and identifiability were investigated using four types of data, at three spatial resolutions (columns in a,b, rows in d): all brain voxels, cortical grey matter voxels, regions of the high‐resolution multi‐modal parcellation (MMP) atlas, and regions of the low‐resolution MMP atlas. (a) Spearman's correlations between EPImix and single‐contrast log‐Jacobians, within and between participants. Cross‐contrast correlations at the level of ROIs were benchmarked using a null model controlling for contiguity and spatial autocorrelation (upper triangular blocks). (b) Differential identifiability of contrasts, defined as the difference between the median within‐participant correlation (right/red y‐axes) and the median between‐participant correlation (left/grey y‐axes), as illustrated in c). (d) Individual identifiability, defined as the fraction of times that the within‐participant correlation is higher than between‐participant correlations, either identifying the log‐Jacobian of a single‐contrast T1‐w scan relative to log‐Jacobians of EPImix T1‐w scans (EPImix T1‐w ref.), or vice‐versa (T1‐w ref.). p‐values correspond to the (paired) Wilcoxon signed‐rank test between neighbouring distributions (testing whether different spatial resolutions of data lead to differences in individual identifiability (H1), or whether there is no statistical difference between these values (H0))
FIGURE 7
FIGURE 7
Structural covariance networks constructed from EPImix and single‐contrast log‐Jacobians. (a) Structural covariance networks constructed using the high‐resolution MMP atlas (297 regions). The diamond plot (top) is ordered according to regional membership of the seven canonical intrinsic connectivity networks derived by Yeo et al. (2011). Network diagrams depict the strongest 0.3% correlations. (b) Structural covariance networks constructed using the low‐resolution MMP atlas (32 regions). Network diagrams depict the strongest 10% correlations. For a comparison of high‐resolution structural covariance within intrinsic connectivity networks, see Figure S10
FIGURE 8
FIGURE 8
Morphometric similarity networks (MSNs) constructed from EPImix contrasts and log‐Jacobians. (a) MSN construction. Seven maps, including six EPImix contrasts and a log‐Jacobian map (obtained from the warp of the T1‐w contrast to MNI space) were used for network construction. Median values of each map within each region of a high‐resolution and a low‐resolution atlas were calculated, before normalisation (within participants, across regions) using a non‐parametric equivalent of the Z‐score (MAD, median absolute deviation; Md, median). Two example correlations from the low‐resolution atlas are shown: high morphometric similarity of left posterior opercular cortex to left early auditory cortex (A1), and low morphometric similarity to the left posterior cingulate cortex. b) Average MSNs (across participants), constructed using the high‐resolution atlas (top; strongest 0.3% absolute correlations shown) and low‐resolution atlas (bottom; strongest 10% absolute correlations shown). For comparisons of MSNs derived from EPImix contrasts to conventional MSNs derived from FreeSurfer reconstructions of T1‐w scans, see Figures S9 and S10
FIGURE 9
FIGURE 9
Test–retest reliability of rapidly‐processed EPImix scans. Reliability was assessed using 10 within‐session test–retest scans, for the six EPImix contrasts and the log‐Jacobian (JCB), at the level of voxels, and high‐ and low‐resolution MMP atlases, as well as for morphometric similarity networks (MSNs) at both atlas resolutions. Reliability was quantified using the one‐way random effects model for the consistency of single measurements, that is, ICC(3,1). (Note that the EPImix T1‐FLAIR contrast is referred to as the EPImix T1‐w contrast/scan throughout the text.)

References

    1. Abraham, A. , Pedregosa, F. , Eickenberg, M. , & Gervais, P. (2014). Machine learning for neuroimaging with scikit‐learn. Frontiers in Neuroinformatics, 8(February), 1–10. - PMC - PubMed
    1. Alexander‐Bloch, A. , Giedd, J. N. , & Bullmore, E. (2013). Imaging structural co‐variance between human brain regions. Nature Reviews. Neuroscience, 14(5), 322–336. - PMC - PubMed
    1. Amico, E. , & Goñi, J. (2018). The quest for identifiability in human functional connectomes. Scientific Reports, 8(8254), 1–14. - PMC - PubMed
    1. Avants, B. B. , Epstein, C. L. , Grossman, M. , & Gee, J. C. (2008). Symmetric diffeomorphic image registration with cross‐correlation: Evaluating automated labeling of elderly and neurodegenerative brain. Medical Image Analysis, 12, 26–41. - PMC - PubMed
    1. Avants, B. B. , Tustison, N. J. , Song, G. , Cook, P. A. , Klein, A. , & Gee, J. C. (2011). A reproducible evaluation of ANTs similarity metric performance in brain image registration. NeuroImage, 54(3), 2033–2044. - PMC - PubMed

Publication types