. 2022 Jan;21(1):e13541.
doi: 10.1111/acel.13541. Epub 2021 Dec 24.

Chemically induced senescence in human stem cell-derived neurons promotes phenotypic presentation of neurodegeneration

Affiliations

Chemically induced senescence in human stem cell-derived neurons promotes phenotypic presentation of neurodegeneration

Ali Fathi et al. Aging Cell. 2022 Jan.

Abstract

Modeling age-related neurodegenerative disorders with human stem cells are difficult due to the embryonic nature of stem cell-derived neurons. We developed a chemical cocktail to induce senescence of iPSC-derived neurons to address this challenge. We first screened small molecules that induce embryonic fibroblasts to exhibit features characteristic of aged fibroblasts. We then optimized a cocktail of small molecules that induced senescence in fibroblasts and cortical neurons without causing DNA damage. The utility of the "senescence cocktail" was validated in motor neurons derived from ALS patient iPSCs which exhibited protein aggregation and axonal degeneration substantially earlier than those without cocktail treatment. Our "senescence cocktail" will likely enhance the manifestation of disease-related phenotypes in neurons derived from iPSCs, enabling the generation of reliable drug discovery platforms.

Keywords: cell senescence; disease modeling; neural differentiation; neurodegeneration.


Conflict of interest statement

RNA‐seq data have been deposited in the Gene Expression Omnibus (GEO) under accession GSE141028. The authors declare no competing financial interests. Correspondence, and requests for materials should be addressed to S‐C.Z. (suchun.zhang@wisc.edu). S‐C.Z. is the co‐founder of BrainXell, Inc.

Figures

FIGURE 1
FIGURE 1
Identifying small molecules for inducing CS in human neonatal fibroblasts. (a) Immunostaining for H3k9Me3, Lap2β, and HP1γ proteins in both neonatal and aged fibroblasts. Scale bar = 100 μm. (b) Frequency distribution for different bins of signal intensity in high‐content imaging for H3k9Me3, Lap2β, and HP1γ proteins in male neonatal and aged (72 years old) fibroblasts. (c) Frequency distribution for H3k9Me3, Lap2β, and HP1γ protein expression in male neonatal fibroblasts treated with different small molecules; dashed red line is control, and top seven molecules for each protein are shown in the graph. (d) Mean difference in signal intensity for all 25 small molecules depicted as mean ± 95% confidence intervals compared to the DMSO control group. The zero line means no difference compared to control and if the difference does not touch the reference line then the changes in expression are significant (n = 4, t test compared to the control DMSO)
FIGURE 2
FIGURE 2
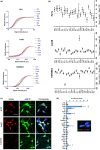
Cellular senescence marks are preserved during direct reprograming of fibroblasts to neurons. (a) Immunostaining for H3K9Me3, LaminB2, Lap2β, and HP1γ co‐stained with TUJ1 (red) in induced neurons (iNs) derived from fibroblasts of neonatal and a 72‐year‐old donor. Scale bar = 100 μm. (b) Percentage of TUJ1‐positive neurons. (c) Mean signal intensity for H3K9Me3, Lap2β, LaminB2, and HP1γ. (d) Hoechst signal intensity, (e) nucleus roundness, (f) nucleus ratio, and (g) nucleus area for both young and aged iNs (n = 3–10, ns: not significant, *p < 0.05, **p < 0.01, ***p < 0.001 unpaired t test). Note that the representative images of Hoechst and Tuj1 staining for young and aged iNs are placed after D‐G
FIGURE 3
FIGURE 3
Chemical induction of CS in hESC‐derived cortical neurons. (a) Frequency distribution of high‐content imaging data for H3K9Me3, Lap2β, and HP1γ proteins in cortical neurons. The dashed red line is control, and top seven molecules for each protein marker are shown in the graph. (b) Mean difference for signal intensity of all 25 small molecules depicted as mean ± 95% confidence intervals compared to the DMSO control. The zero line means no difference compared to the control and if the difference does not touch the reference line then changes in expression are significant. (c) Confocal images of phospho‐Histone H2A.X (Serine 139) in the H9‐GFP cortical neurons treated with Etoposide, Actinomycin D, and DMSO as control (Scale bar = 50 μm). (d) Quantification results for the number of positive foci for phospho‐Histone H2A.X (Serine 139) per nucleus in cortical neurons treated with different small molecules. (n = 3, ns: not significant, *p < 0.05, **p < 0.01, ***p < 0.001 one‐way ANOVA with Dunnett's multiple comparison test)
FIGURE 4
FIGURE 4
Combinatorial effect of small molecules on CS in cortical neurons. (a) Different combination of five most effective molecules (O151, SBI‐0206965, Lopinavir, Sodium Butyrate, SCR‐7) tested on cortical neurons and mean expression of H3K9Me3, Lap2β, and HP1γ in treatment groups compared to the DMSO control. (b) A graph showing the period of SLO treatment on the expression of Lap2β, HP1γ, and H3K9Me3 at Day 14 after maturation and (c–e) high‐content imaging quantification of signal intensity for each marker after SLO treatment. (f) Relative frequency distribution of different bins of signal intensity for Lap2β, HP1γ, and H3K9Me3 in cortical neurons treated with different small molecules. (g) Representative images of Western blot for all three markers in cortical neurons treated at Day 21 of differentiation and (h) their normalized protein expression to tubulin expression. (i) Immunostaining images of H9‐GFP cortical neurons treated with MG‐132 (proteasome inhibitor), SLO (SBI‐0206965, Lopinavir and O151), and SSO (SBI‐0206965, Sodium Butyrate and O151) and stained for Lamp2A (Lysosome membrane associated protein) and Proteostat dye for detection of protein aggregation (Scale bar = 100 μm), and (j) quantification of positive area in neurons for Lamp2A and Proteostat. (i, j) Young and aged iNs added for comparison with ESC‐derived cortical neurons. (n = 3, ns: not significant, *p < 0.05, **p < 0.01, ***p < 0.001 one‐way ANOVA with Dunnett's multiple comparison test). For Western blot quantification, unpaired Student's t test was performed
FIGURE 5
FIGURE 5
RNAseq analysis on SLO‐treated cortical neurons. PCA plot for SLO and CTRL samples as well as induced neurons (iNs) converted from both (a) aged (nine samples) and young (eight samples) fibroblasts and (b) the aged and young PsychENCODE samples (the old group (>60 years, N = 205) and the young group (<30 years, N = 128)). Boxplots for human aging scores association between SLO neurons and brain samples for (c) upregulated genes and (d) downregulated genes in the aged brains. (e) Smear plot represents each gene with a dot, the gray dots (below cutoff line) are genes with no change relative to the contrast direction, red dots denote upregulated transcripts in the control neurons (with decreased expression in the SLO‐treated neurons), and green dots denote downregulated transcripts in the control neurons (upregulated in SLO‐treated neurons), respectively, at an adjusted p‐value (FDR) significance threshold of 0.05. For FDR correction, we used Benjamini–Hochberg method. The light blue dots are transcripts with FDR < 0.05 but have log expression change of less than 0.6. The x‐axis (log2 fold change) is the effect size, indicating how much expression has changed with SLO treatment. (f) Heatmap clustering for 50 of the most differentially expressed genes with a p‐value < 0.05 and a log (2) fold‐change greater or less than 2. The Z‐score of a given expression value is the number of standard deviations away from the mean of all the expression values for that gene. (g) All DEGs with a FDR < 0.05 and 0.6 ≤ logFC ≤ −0.6 are selected and tested for over‐ or under‐representation of pathways in the gene list. Any significantly enriched WikiPathway pathways are ordered from most to least significant based on the p‐value
FIGURE 6
FIGURE 6
Phenotype presentation by SLO‐treated motor neurons derived from TARDBP mutant iPSCs. (a) Differentiation protocol used for generating MNs from TDP‐43 298S mutant and 298G isogenic iPSCs. (b) Immunostaining and quantification for cleaved caspase 3 and alpha internexin proteins in cultured MNs treated with SLO, SSO and MG‐132, at Day 28. (c) High‐content imaging for H3K9M3 and Lap2β in both TDP43 298G isogenic control and 298S mutant following SLO treatment (Mean of SLO treatment compared to the control group with DMSO). (d) Representative phase contrast image of MN cultures from both control and mutant ALS neurons treated with SLO. (e) Immunostaining images for alpha‐internexin, Proteostat, phosphorylated neurofilament heavy proteins in control and mutant MNs treated with SLO; right panel shows higher magnification images of control and mutant MNs treated with SLO (Scale bar = 200 μm, for higher magnification images scale bar = 50 μm). (f) Quantification result for phosphorylated neurofilament aggregates and (g) Proteostat‐positive protein aggregations. (h) Quantification of phosphorylated TDP43 protein in the nuclei area across all groups and also (i) quantified nuclear TDP43 protein expression for both 298G, S neurons and SLO‐treated neurons. (j) Mitochondrial membrane potential (JC10 assay) of ALS‐iPSC‐derived MNs treated with SLO compared to the healthy isogenic control cells and isogenic cells treated with FCCP. (n = 3, ns: not significant, *p < 0.05, **p < 0.01, ***p < 0.001 one‐way ANOVA with Dunnett's multiple comparison test, for JC10 assay data were collected using 15,000 cells per group from three independent experiments. Statistical analysis was performed using one‐way ANOVA, Tukey post hoc test (****p < 0.001))
FIGURE 7
FIGURE 7
Testing molecules that rescue the disease phenotype in ALS MNs. (a) MNs from TDP‐43 G298S mutant and G298G isogenic iPSCs treated with SLO to induce CS phenotypes and 24hr later candidate molecules SMER28, EDARAVONE, and KU‐60019 were added to the culture and cells stained with Proteostat dye for protein aggregation and alphaInternexin for visualizing neurites. (b) Quantification of immunostaining images positive for Proteostat and (c) neurite swellings. (n = 3, Scale bar=100 μm)

References

    1. Afonso, P. , Auclair, M. , Boccara, F. , Vantyghem, M.‐C. , Katlama, C. , Capeau, J. , Vigouroux, C. , & Caron‐Debarle, M. (2016). LMNA mutations resulting in lipodystrophy and HIV protease inhibitors trigger vascular smooth muscle cell senescence and calcification: Role of ZMPSTE24 downregulation. Atherosclerosis, 245, 200–211. 10.1016/j.atherosclerosis.2015.12.012 - DOI - PubMed
    1. Baker, D. J. , & Petersen, R. C. (2018). Cellular senescence in brain aging and neurodegenerative diseases: Evidence and perspectives. Journal of Clinical Investigation, 128, 1208–1216. 10.1172/JCI95145 - DOI - PMC - PubMed
    1. Bickford, P. C. , Flowers, A. , & Grimmig, B. (2017). Aging leads to altered microglial function that reduces brain resiliency increasing vulnerability to neurodegenerative diseases. Experimental Gerontology, 94, 4–8. 10.1016/j.exger.2017.01.027 - DOI - PMC - PubMed
    1. Bilican, B. , Serio, A. , Barmada, S. J. , Nishimura, A. L. , Sullivan, G. J. , Carrasco, M. , Phatnani, H. P. , Puddifoot, C. A. , Story, D. , Fletcher, J. , Park, I. H. , Friedman, B. A. , Daley, G. Q. , Wyllie, D. J. , Hardingham, G. E. , Wilmut, I. , Finkbeiner, S. , Maniatis, T. , Shaw, C. E. , & Chandran, S. (2012). Mutant induced pluripotent stem cell lines recapitulate aspects of TDP‐43 proteinopathies and reveal cell‐specific vulnerability. Proceedings of the National Academy of Sciences of the United States of America, 109, 58035808. 10.1073/pnas.1202922109 - DOI - PMC - PubMed
    1. Bonda, D. J. , Lee, H. , Camins, A. , Pallàs, M. , Casadesus, G. , Smith, M. A. , & Zhu, X. (2011). The sirtuin pathway in ageing and Alzheimer disease: Mechanistic and therapeutic considerations. The Lancet Neurology, 10, 275–279. 10.1016/s14744422(11)70013-8 - DOI - PMC - PubMed

Publication types