. 2022 Jan 12;30(1):97-109.e5.
doi: 10.1016/j.chom.2021.12.004. Epub 2021 Dec 3.

Strong humoral immune responses against SARS-CoV-2 Spike after BNT162b2 mRNA vaccination with a 16-week interval between doses

Affiliations

Strong humoral immune responses against SARS-CoV-2 Spike after BNT162b2 mRNA vaccination with a 16-week interval between doses

Alexandra Tauzin et al. Cell Host Microbe. .

Abstract

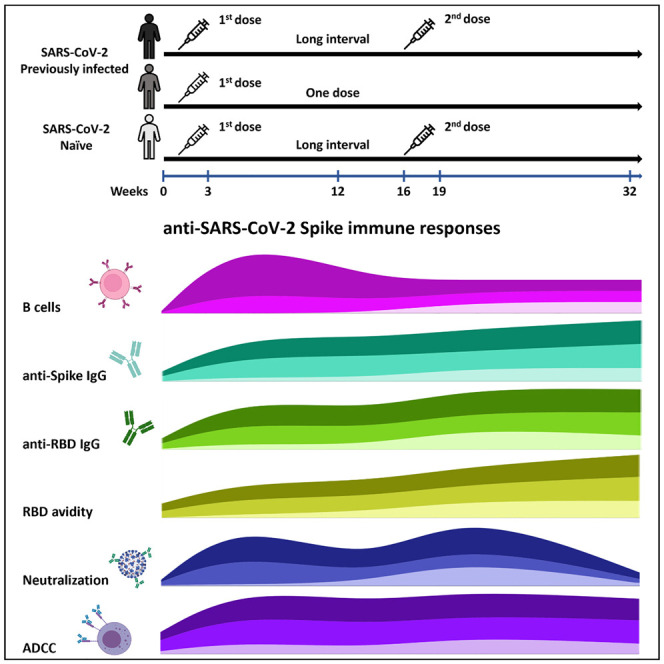
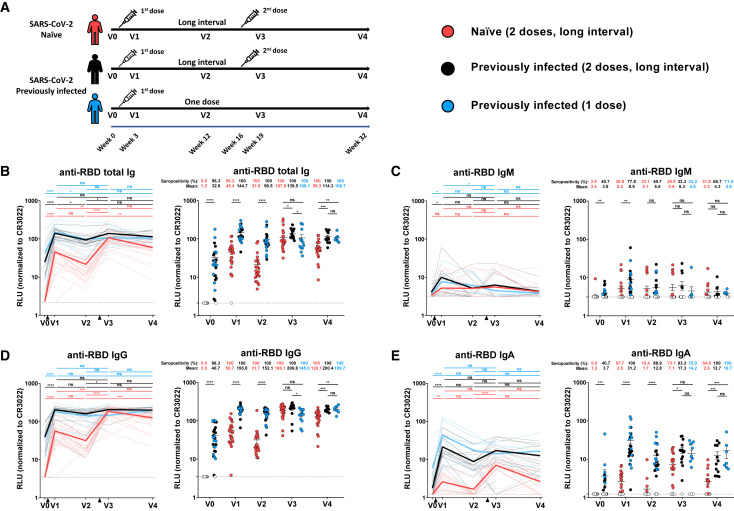
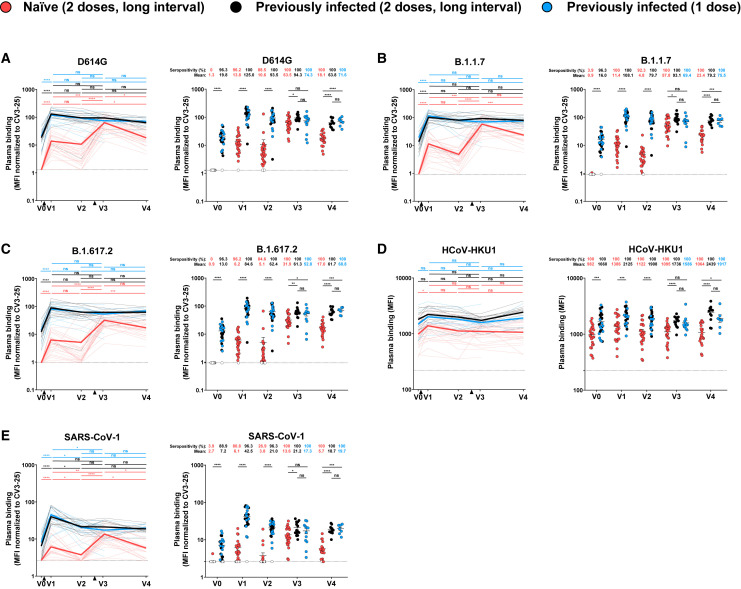
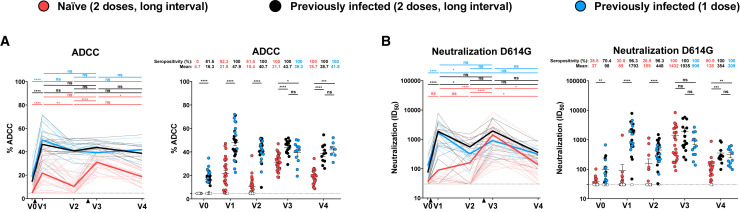
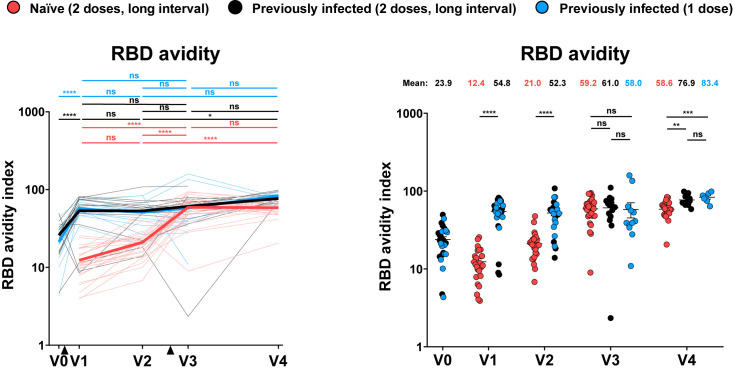
The standard regimen of the BNT162b2 mRNA vaccine for SARS-CoV-2 includes two doses administered three weeks apart. However, some public health authorities spaced these doses, raising questions about efficacy. We analyzed longitudinal humoral responses against the D614G strain and variants of concern for SARS-CoV-2 in a cohort of SARS-CoV-2-naive and previously infected individuals who received the BNT162b2 mRNA vaccine with sixteen weeks between doses. While administering a second dose to previously infected individuals did not significantly improve humoral responses, these responses significantly increased in naive individuals after a 16-week spaced second dose, achieving similar levels as in previously infected individuals. Comparing these responses to those elicited in individuals receiving a short (4-week) dose interval showed that a 16-week interval induced more robust responses among naive vaccinees. These findings suggest that a longer interval between vaccine doses does not compromise efficacy and may allow greater flexibility in vaccine administration.

Keywords: ADCC; COVID-19; Coronavirus; SARS-CoV-2; Spike glycoproteins; delayed mRNA vaccine regimen; humoral responses; neutralization; variants of concern; variants of interest.


Conflict of interest statement

Declaration of interests The authors declare no competing interests.

Figures

None
Graphical abstract
Figure 1
Figure 1
Elicitation of RBD-specific antibodies in SARS-CoV-2-naive and previously-infected individuals (A) SARS-CoV-2 vaccine cohort design (B–E) Indirect ELISA was performed by incubating plasma samples from naive and PI donors collected at V0, V1, V2, V3, and V4 with recombinant SARS-CoV-2 RBD protein. Anti-RBD Ab binding was detected using HRP-conjugated (B) anti-human IgM+IgG+IgA, (C) anti-human IgM, (D) anti-human IgG, or (E) anti-human IgA. Relative light unit (RLU) values obtained with BSA (negative control) were subtracted and further normalized to the signal obtained with the anti-RBD CR3022 mAb present in each plate. Naive and PI donors with a long interval between the two doses are represented by red and black points, respectively, and PI donors who received just one dose by blue points. Left panels: Each curve represents the normalized RLUs obtained with the plasma of one donor at every time point. Mean of each group is represented by a bold line. The time of vaccine dose injections is indicated by black triangles. Right panels: Plasma samples were grouped in different time points (V0, V1, V2, V3, and V4). Undetectable measures are represented as white symbols, and limits of detection are plotted. Error bars indicate means ± SEM (p < 0.05; ∗∗p < 0.01; ∗∗∗p < 0.001; ∗∗∗∗p < 0.0001; ns, non-significant). For naive donors, n (number of individuals) = 26 at V0, V1, V2, and V3 and n = 22 at V4. For PI donors vaccinated with two doses, n = 15 at V0, V1, V2, and V3 and n = 12 at V4. For PI donors vaccinated with one dose, n = 12 at V0, V1, V2, and V3 and n = 7 at V4.
Figure 2
Figure 2
Binding of vaccine-elicited antibodies to SARS-CoV-2 S variants and other betacoronaviruses 293T cells were transfected with the indicated full-length S from different SARS-CoV-2 variants and other human Betacoronavirus Ss and stained with the CV3-25 Ab or with plasma from naive or PI donors collected at V0, V1, V2, V3, and V4 and analyzed by flow cytometry. The values represent the median fluorescence intensities (MFI) (D) or the MFI normalized by CV3-25 Ab binding (A–C and E). Naive and PI donors with a long interval between the two doses are represented by red and black points, respectively, and PI donors who received just one dose by blue points. Left panels: Each curve represents the MFI or the normalized MFIs obtained with the plasma of one donor at every time point. Mean of each group is represented by a bold line. The time of vaccine dose injections is indicated by black triangles. Right panels: Plasma samples were grouped in different time points (V0, V1, V2, V3, and V4). Undetectable measures are represented as white symbols, and limits of detection are plotted. Error bars indicate means ± SEM (p < 0.05; ∗∗p < 0.01; ∗∗∗p < 0.001; ∗∗∗∗p < 0.0001; ns, non-significant). For naive donors, n = 26 at V0, V1, V2, and V3 and n = 22 at V4. For PI donors vaccinated with two doses, n = 15 at V0, V1, V2, and V3 and n = 12 at V4. For PI donors vaccinated with one dose, n = 12 at V0, V1, V2, and V3 and n = 7 at V4.
Figure 3
Figure 3
Fc-effector function and neutralization activities in SARS-CoV-2 naive and previously-infected individuals before and after Pfizer/BioNTech mRNA vaccine (A) CEM.NKr parental cells were mixed at a 1:1 ratio with CEM.NKr-S cells and were used as target cells. PBMCs from uninfected donors were used as effector cells in a FACS-based ADCC assay. (B) Neutralizing activity was measured by incubating pseudoviruses bearing SARS-CoV-2 S glycoproteins with serial dilutions of plasma for 1 h at 37°C before infecting 293T-ACE2 cells. Neutralization half maximal inhibitory serum dilution (ID50) values were determined using a normalized non-linear regression using GraphPad Prism software. Naive and PI donors with a long interval between the two doses are represented by red and black points, respectively, and PI donors who received just one dose by blue points. Left panels: Each curve represents the values obtained with the plasma of one donor at every time point. Mean of each group is represented by a bold line. The time of vaccine dose injections is indicated by black triangles. Right panels: Plasma samples were grouped in different time points (V0, V1, V2, V3, and V4). Undetectable measures are represented as white symbols, and limits of detection are plotted. Error bars indicate means ± SEM (p < 0.05; ∗∗p < 0.01; ∗∗∗p < 0.001; ∗∗∗∗p < 0.0001; ns, non-significant). For naive donors, n = 26 at V0, V1, V2, and V3 and n = 22 at V4. For PI donors vaccinated with two doses, n = 15 at V0, V1, V2, and V3 and n = 12 at V4. For PI donors vaccinated with one dose, n = 12 at V0, V1, V2, and V3 and n = 7 at V4.
Figure 4
Figure 4
RBD avidity of vaccine-elicited antibodies Indirect ELISA and stringent ELISA were performed by incubating plasma samples from naive and PI donors collected at V0, V1, V2, V3, and V4 with recombinant SARS-CoV-2 RBD protein. Anti-RBD Ab binding was detected using HRP-conjugated anti-human IgG. Relative light unit (RLU) values obtained were normalized to the signal obtained with the anti-RBD CR3022 mAb present in each plate. The RBD avidity index corresponded to the value obtained with the stringent (8M urea) ELISA divided by that obtained with the ELISA. Naive and PI donors with a long interval between the two doses are represented by red and black points, respectively, and PI donors who received just one dose by blue points. Left panels: Each curve represents the values obtained with the plasma of one donor at every time point. Mean of each group is represented by a bold line. The time of vaccine dose injections is indicated by black triangles. Right panels: Plasma samples were grouped in different time points (V0, V1, V2, V3, and V4). Undetectable measures are represented as white symbols, and limits of detection are plotted. Error bars indicate means ± SEM (p < 0.05; ∗∗p < 0.01; ∗∗∗p < 0.001; ∗∗∗∗p < 0.0001; ns, non-significant). For naive donors, n = 26 at V0, V1, V2, and V3 and n = 22 at V4. For PI donors vaccinated with two doses, n = 15 at V0, V1, V2, and V3 and n = 12 at V4. For PI donors vaccinated with one dose, n = 12 at V0, V1, V2, and V3 and n = 7 at V4.
Figure 5
Figure 5
Humoral responses in SARS-CoV-2 naive individuals that received a short dose versus a long dose interval (A) SARS-CoV-2 vaccine cohort design (B) Indirect ELISA was performed by incubating plasma samples from naive donors collected at V3 with recombinant SARS-CoV-2 RBD protein. Anti-RBD Ab binding was detected using HRP-conjugated anti-human IgG. Relative light unit (RLU) values obtained with BSA (negative control) were subtracted and further normalized to the signal obtained with the anti-RBD CR3022 mAb present in each plate. (C) Indirect ELISA and stringent ELISA was performed by incubating plasma samples from naive donors collected at V3 with recombinant SARS-CoV-2 RBD protein. Anti-RBD Ab binding was detected using HRP-conjugated anti-human IgG. Relative light unit (RLU) values obtained were normalized to the signal obtained with the anti-RBD CR3022 mAb present in each plate. RBD avidity index corresponded to the value obtained with the stringent ELISA divided by that obtained with the ELISA. (D) 293T cells were transfected with the indicated full-length S and stained with the CV3-25 Ab or with plasma from naive donors collected at V3 and analyzed by flow cytometry. The values represent the MFI normalized by CV3-25 Ab binding. (E) CEM.NKr parental cells were mixed at a 1:1 ratio with CEM.NKr-S cells and were used as target cells. PBMCs from uninfected donors were used as effector cells in a FACS-based ADCC assay. (F) Neutralizing activity was measured by incubating pseudoviruses bearing SARS-CoV-2 S glycoproteins or SARS-CoV-1 S glycoprotein with serial dilutions of plasma for 1 h at 37°C before infecting 293T-ACE2 cells. Neutralization half maximal inhibitory serum dilution (ID50) values were determined using a normalized non-linear regression using GraphPad Prism software. Naive donors vaccinated with a short or a long interval between the two doses are represented by yellow or red points, respectively. Plasma samples were grouped at V3. Undetectable measures are represented as white symbols, and limits of detection are plotted. Error bars indicate means ± SEM (p < 0.05; ∗∗p < 0.01; ∗∗∗p < 0.001; ∗∗∗∗p < 0.0001; ns, non-significant). For naive donors vaccinated with the short interval, n = 12. For naive donors vaccinated with the long interval, n = 26.
Figure 6
Figure 6
Mesh correlations of humoral response parameters in SARS-CoV-2-naive and previously infected individuals before and after Pfizer/BioNTech mRNA vaccine. Edge bundling correlation plots where red and blue edges represent positive and negative correlations between connected parameters, respectively. Only significant correlations (p < 0.05, Spearman rank test) are displayed. Nodes are color-coded based on the grouping of parameters according to the legend. Node size corresponds to the degree of relatedness of correlations. Edge bundling plots are shown for correlation analyses using ten different datasets, i.e., SARS-CoV-2 naive (A) or PI (B) individuals at V0, V1, V2, V3, and V4, respectively.

References

    1. Allen H., Vusirikala A., Flannagan J., Twohig K.A., Zaidi A., Chudasama D., Lamagni T., Groves N., Turner C., Rawlinson C., et al. Lancet Reg. Health – Eur; 2021. Household transmission of COVID-19 cases associated with SARS-CoV-2 delta variant (B.1.617.2): national case-control study. - PMC - PubMed
    1. Anand S.P., Prévost J., Richard J., Perreault J., Tremblay T., Drouin M., Fournier M.-J., Lewin A., Bazin R., Finzi A. High-throughput detection of antibodies targeting the SARS-CoV-2 Spike in longitudinal convalescent plasma samples. Transfusion. 2021;61:1377–1382. - PMC - PubMed
    1. Anand S.P., Prévost J., Nayrac M., Beaudoin-Bussières G., Benlarbi M., Gasser R., Brassard N., Laumaea A., Gong S.Y., Bourassa C., et al. Longitudinal analysis of humoral immunity against SARS-CoV-2 Spike in convalescent individuals up to 8 months post-symptom onset. Cell Rep Med. 2021;2:100290. - PMC - PubMed
    1. Annavajhala M.K., Mohri H., Wang P., Nair M., Zucker J.E., Sheng Z., Gomez-Simmonds A., Kelley A.L., Tagliavia M., Huang Y., et al. Emergence and expansion of SARS-CoV-2 B.1.526 after identification in New York. Nature. 2021;597:703–708. - PMC - PubMed
    1. Baden L.R., El Sahly H.M., Essink B., Kotloff K., Frey S., Novak R., Diemert D., Spector S.A., Rouphael N., Creech C.B., et al. COVE Study Group Efficacy and Safety of the mRNA-1273 SARS-CoV-2 Vaccine. N. Engl. J. Med. 2021;384:403–416. - PMC - PubMed

Publication types