. 2023 Jun 1;93(11):1041-1052.
doi: 10.1016/j.biopsych.2021.10.004. Epub 2021 Oct 16.

Accumbal Histamine Signaling Engages Discrete Interneuron Microcircuits

Affiliations

Accumbal Histamine Signaling Engages Discrete Interneuron Microcircuits

Kevin M Manz et al. Biol Psychiatry. .

Abstract

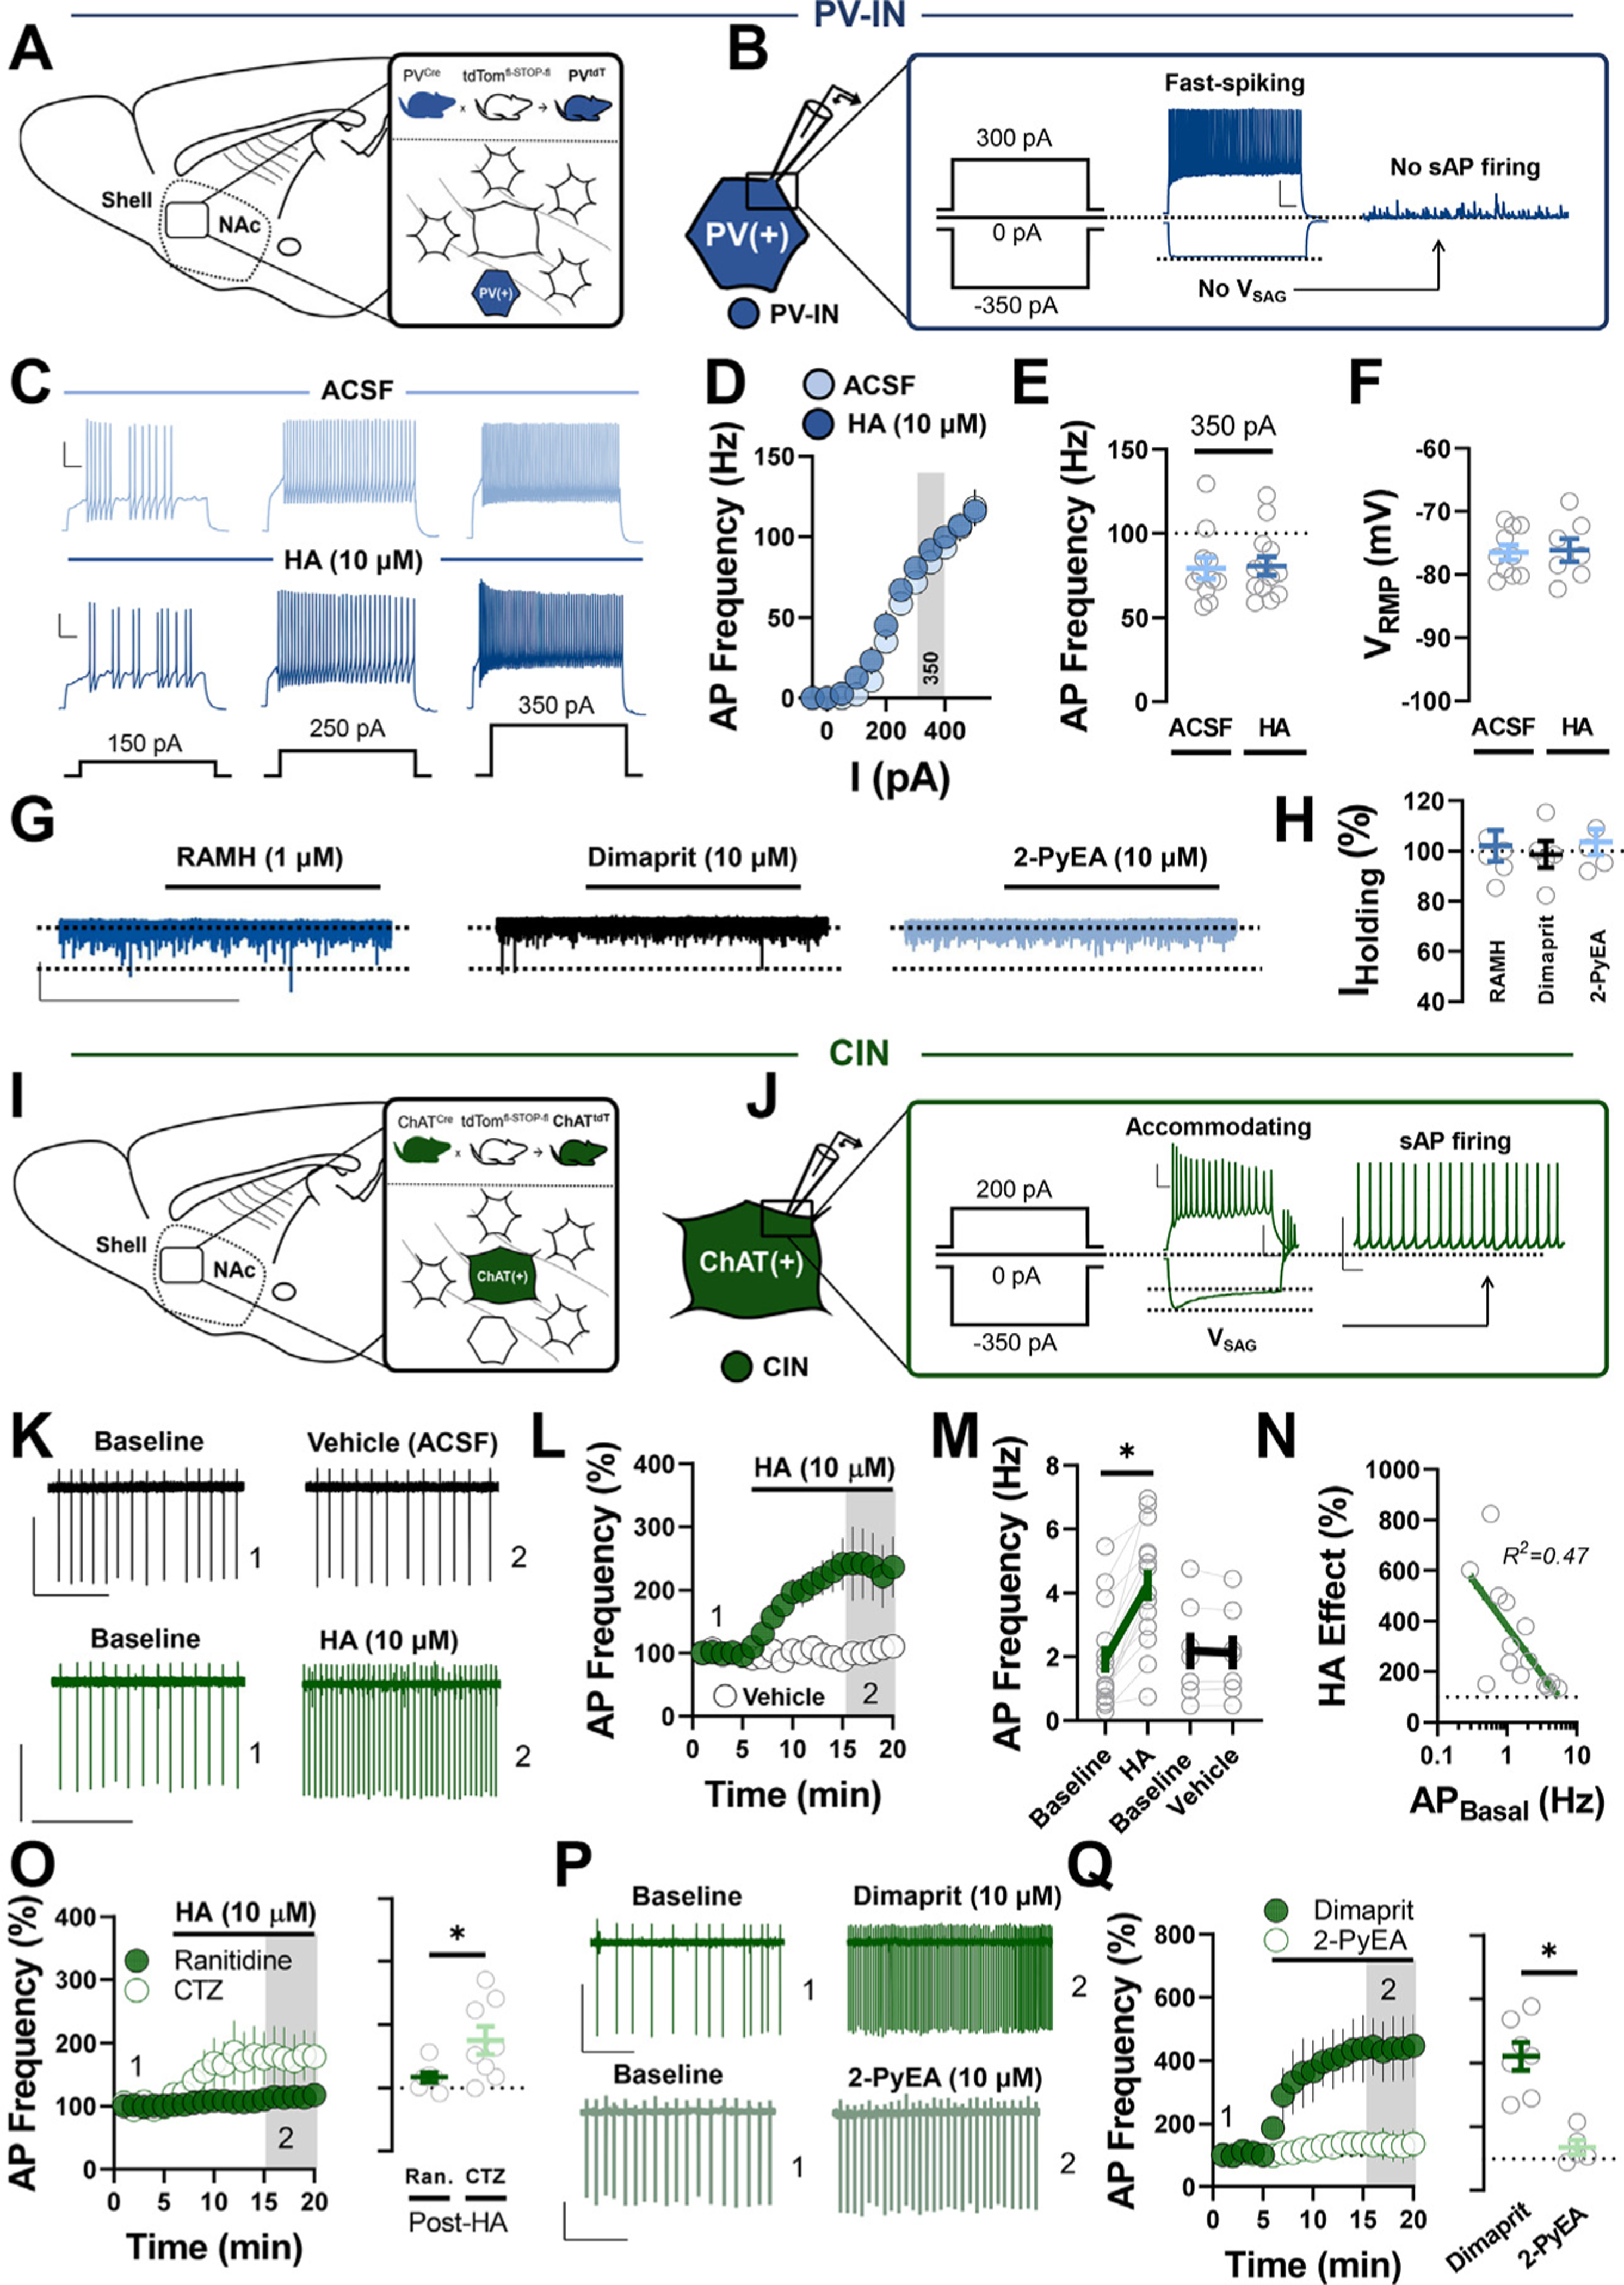
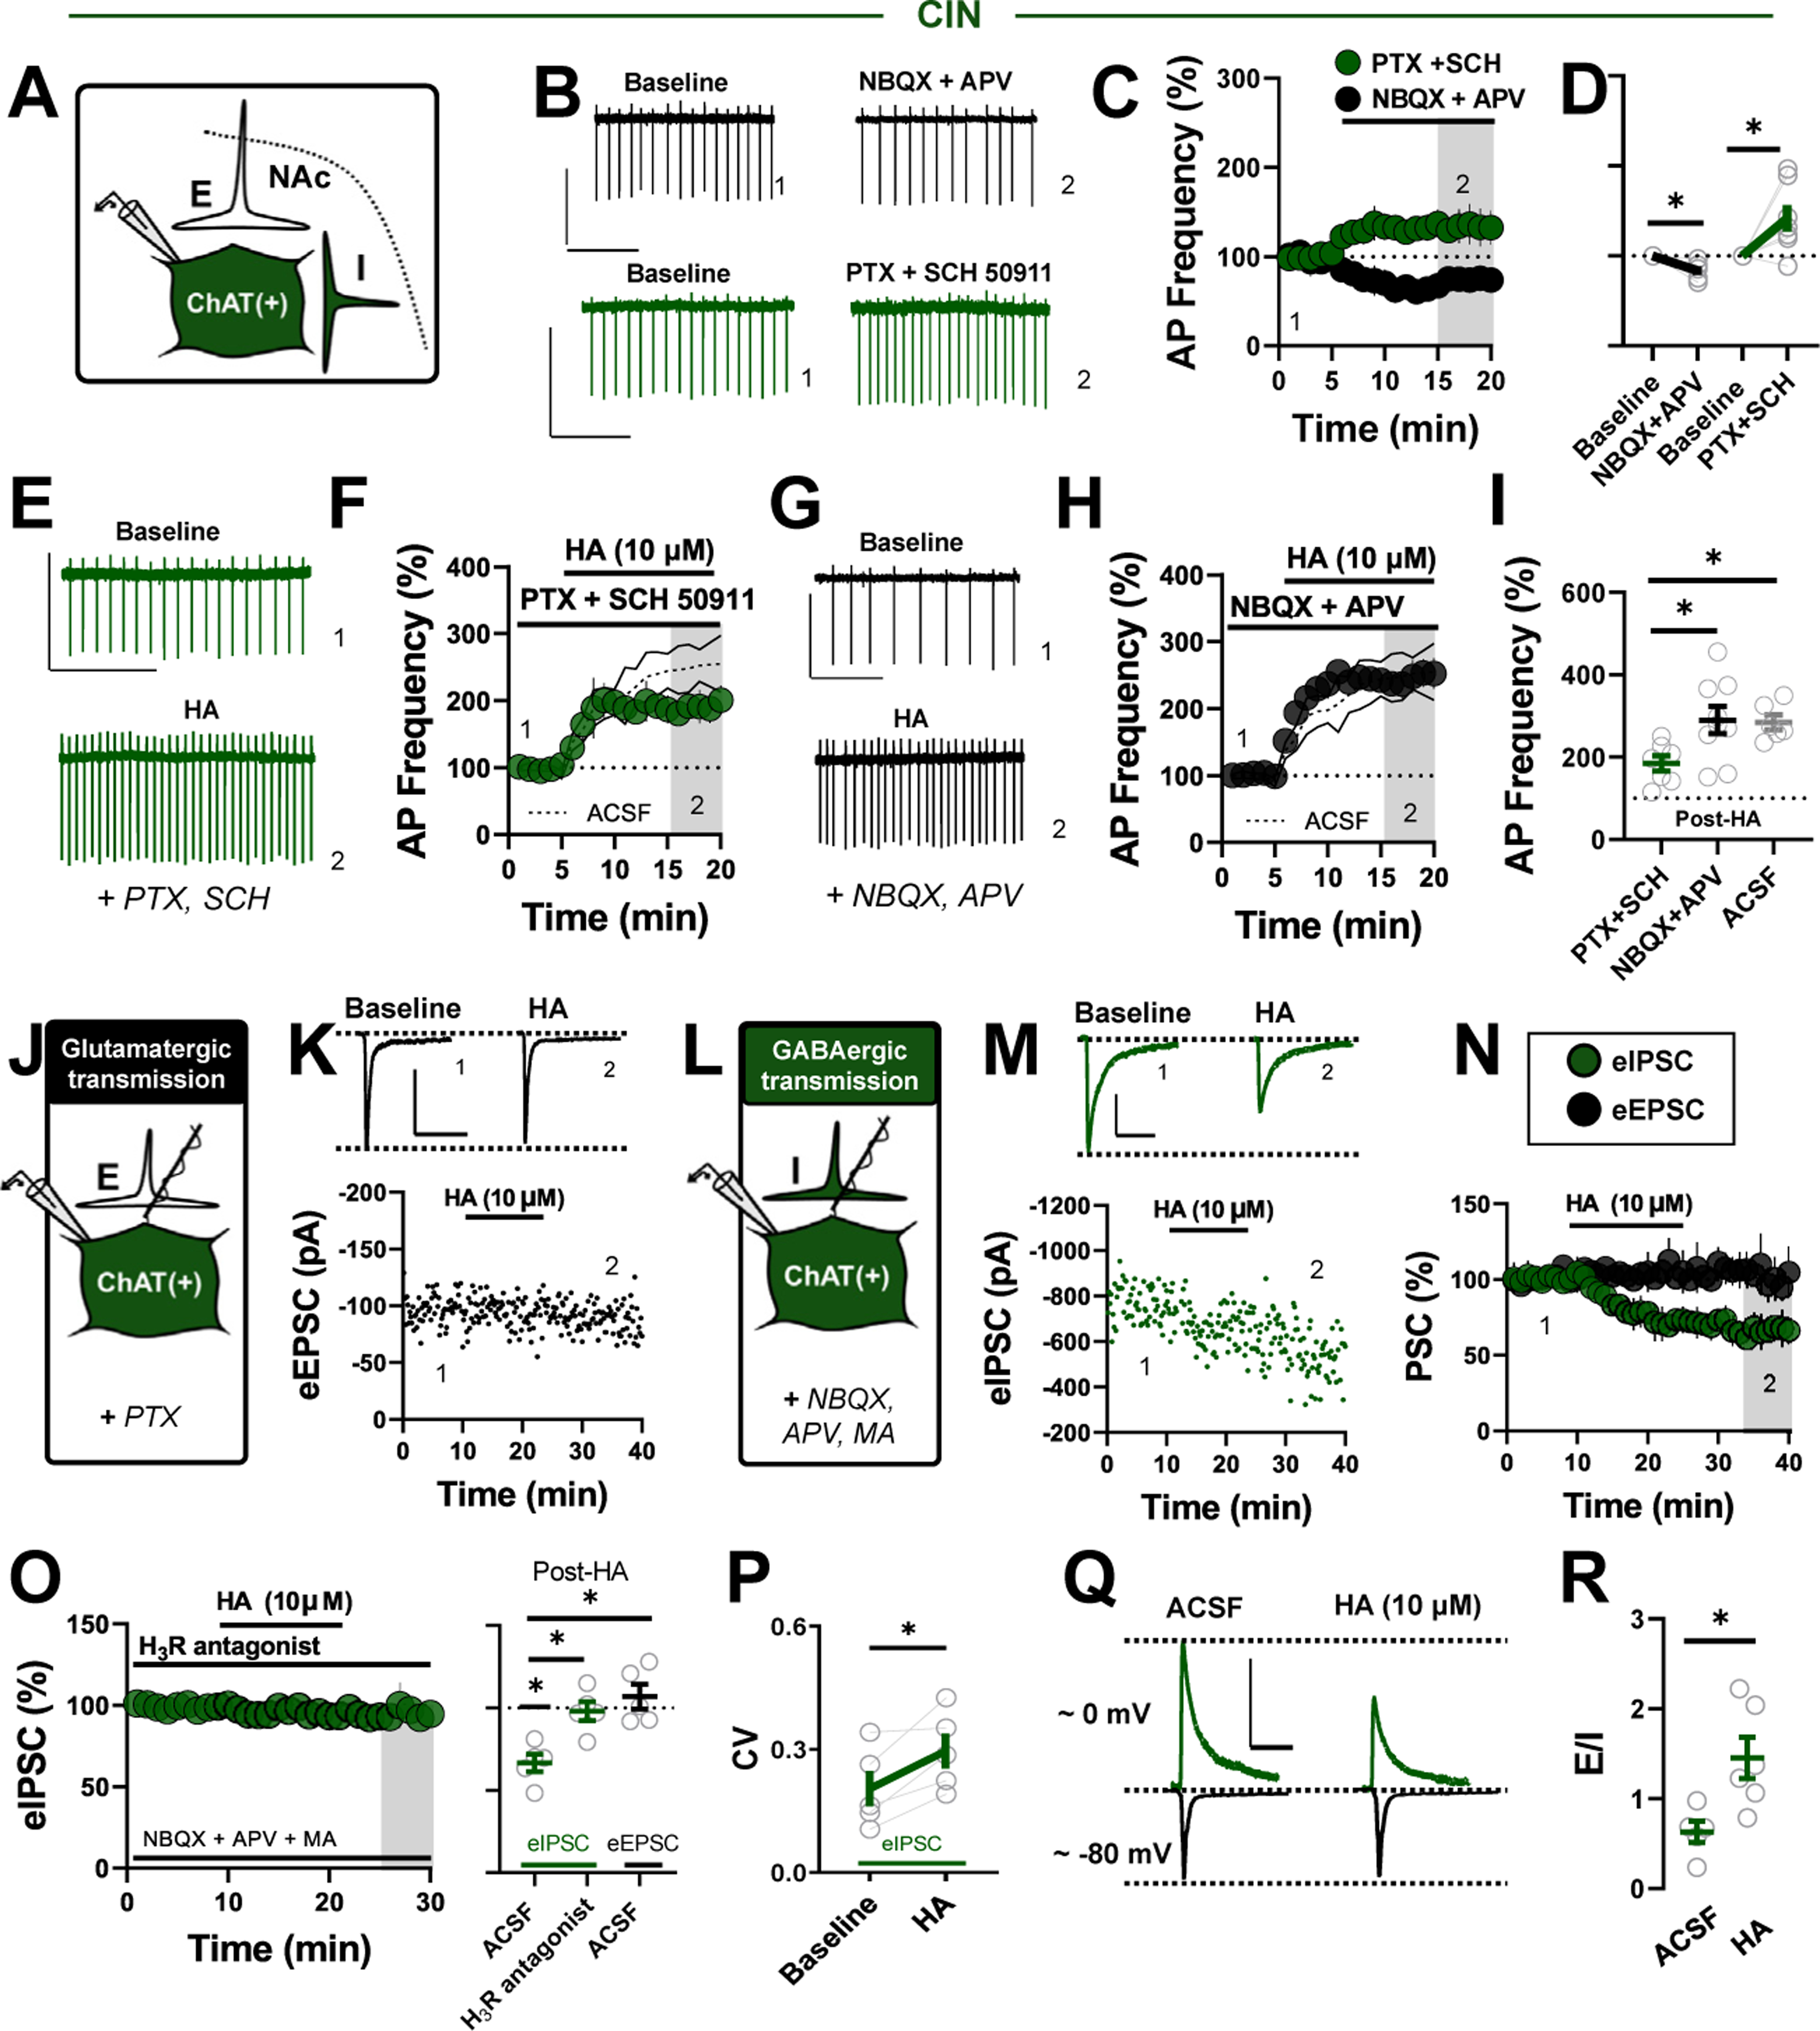
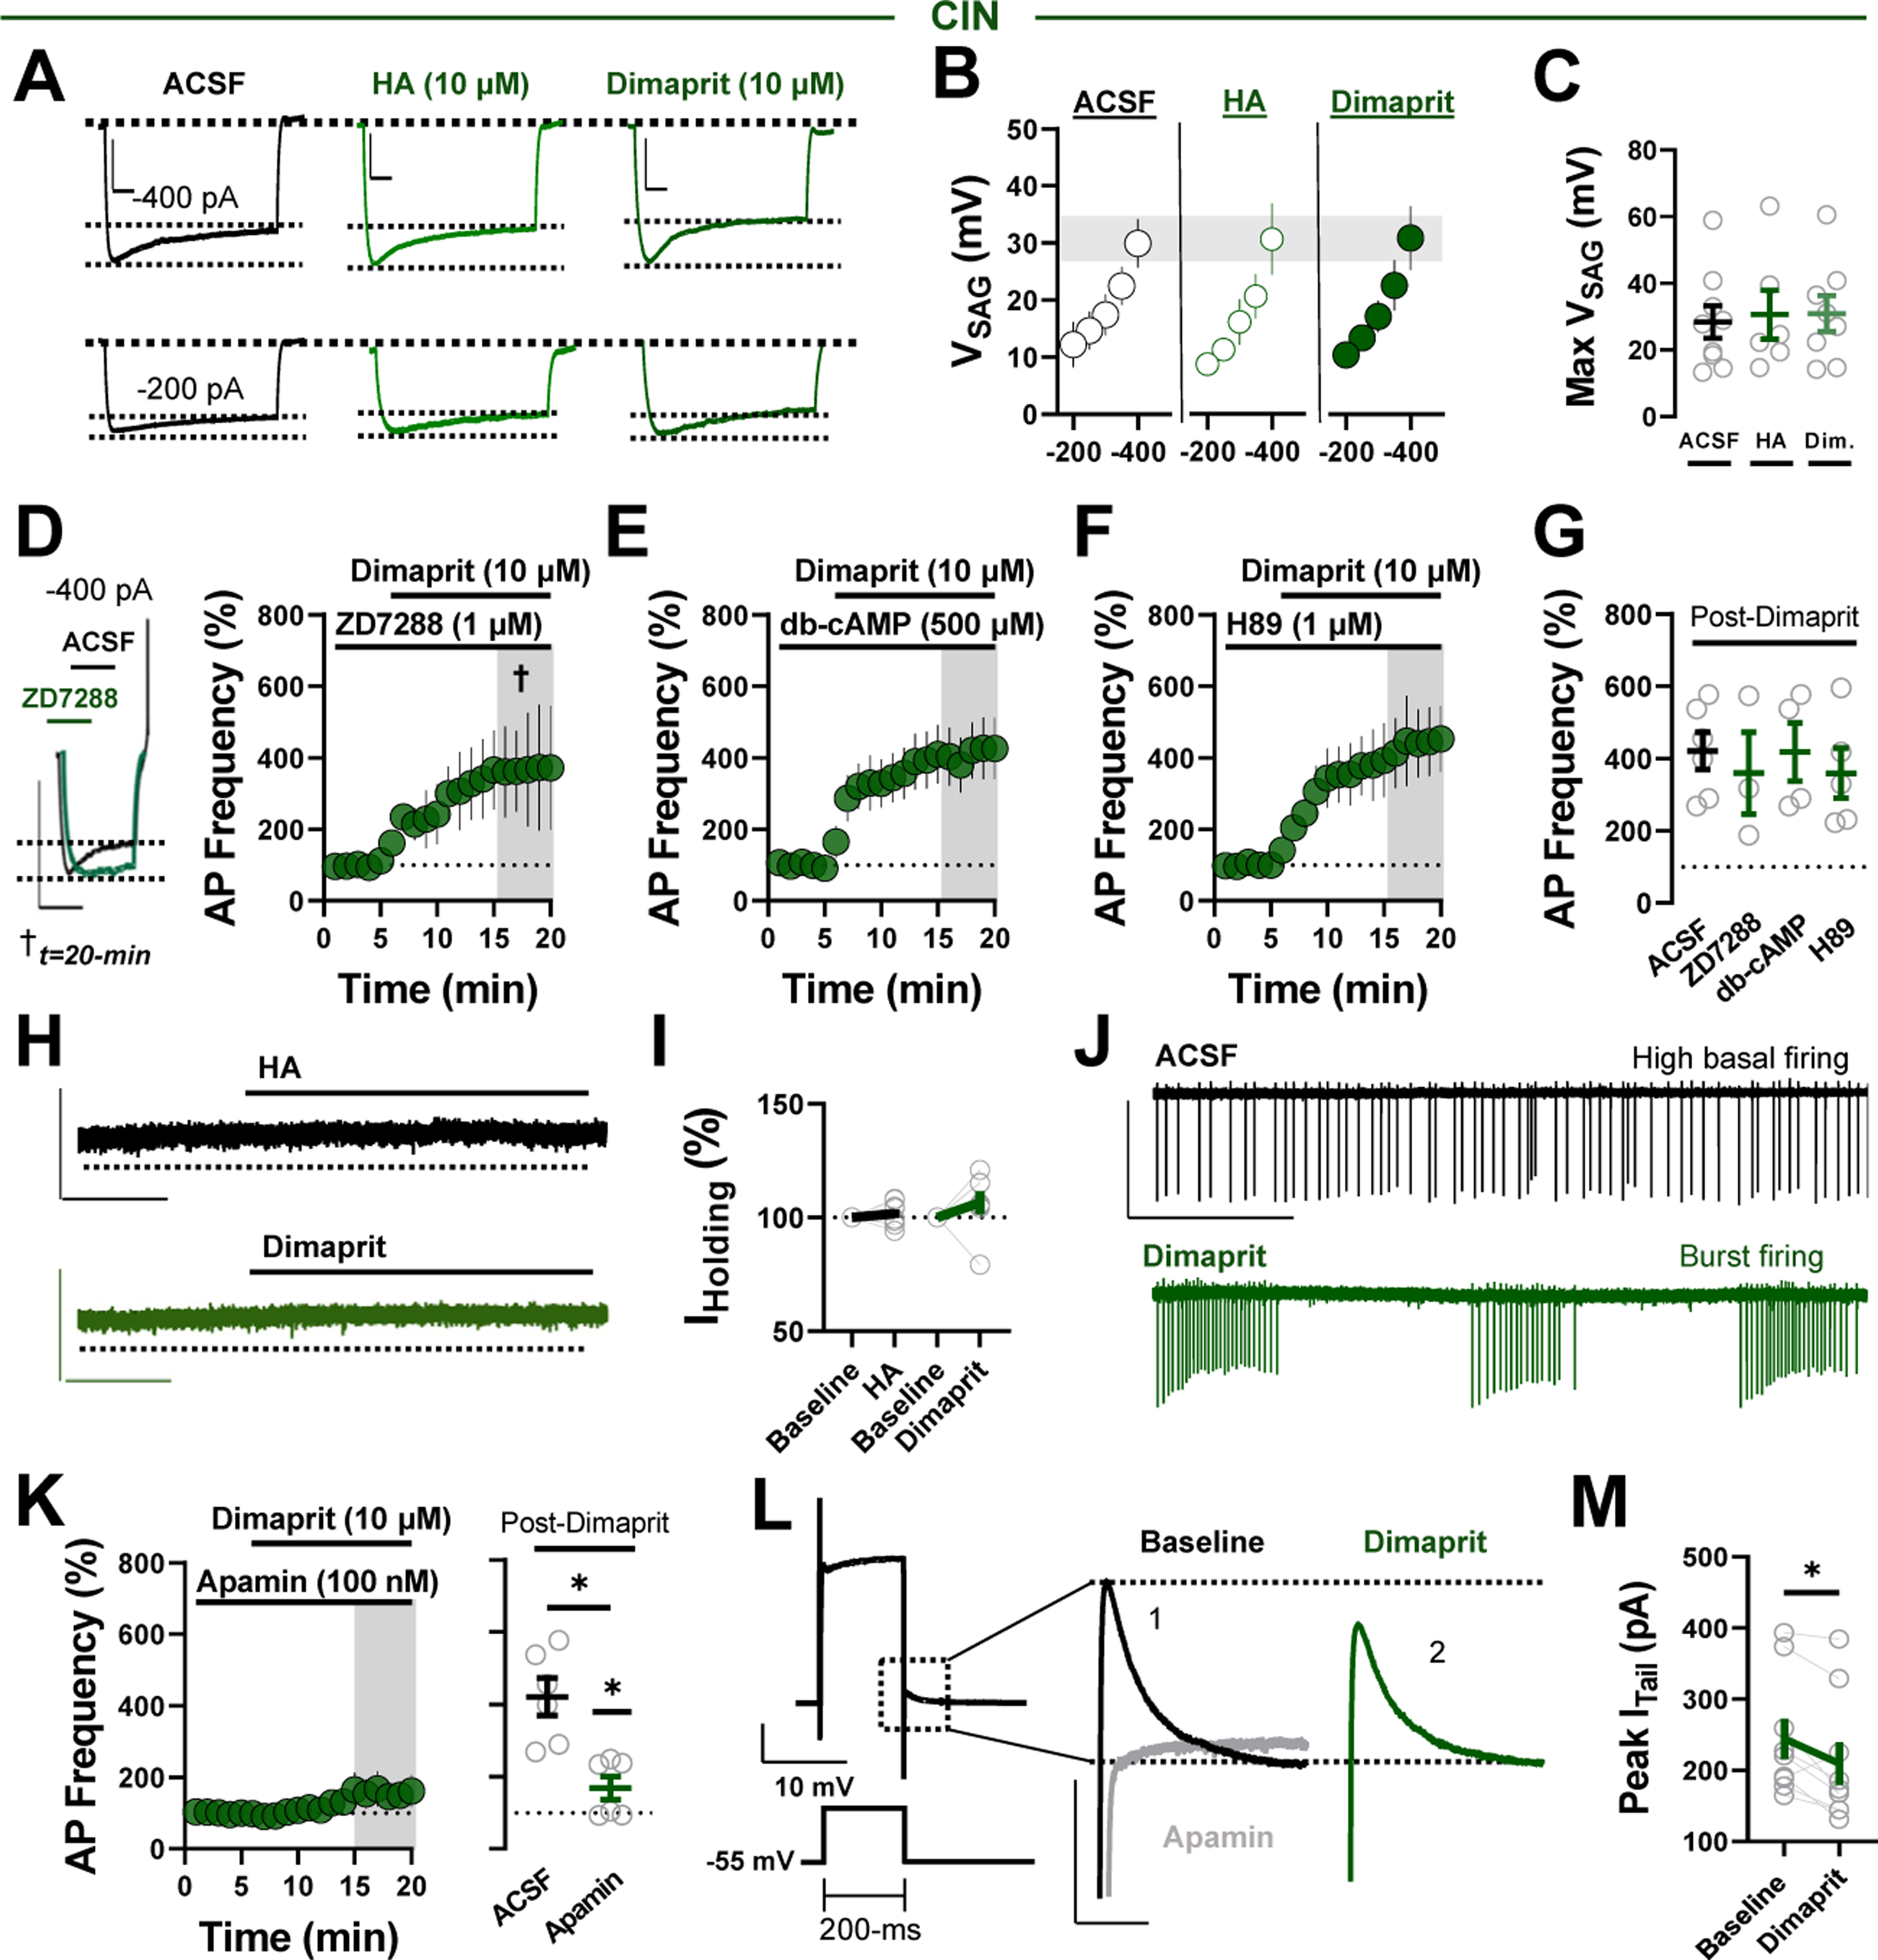
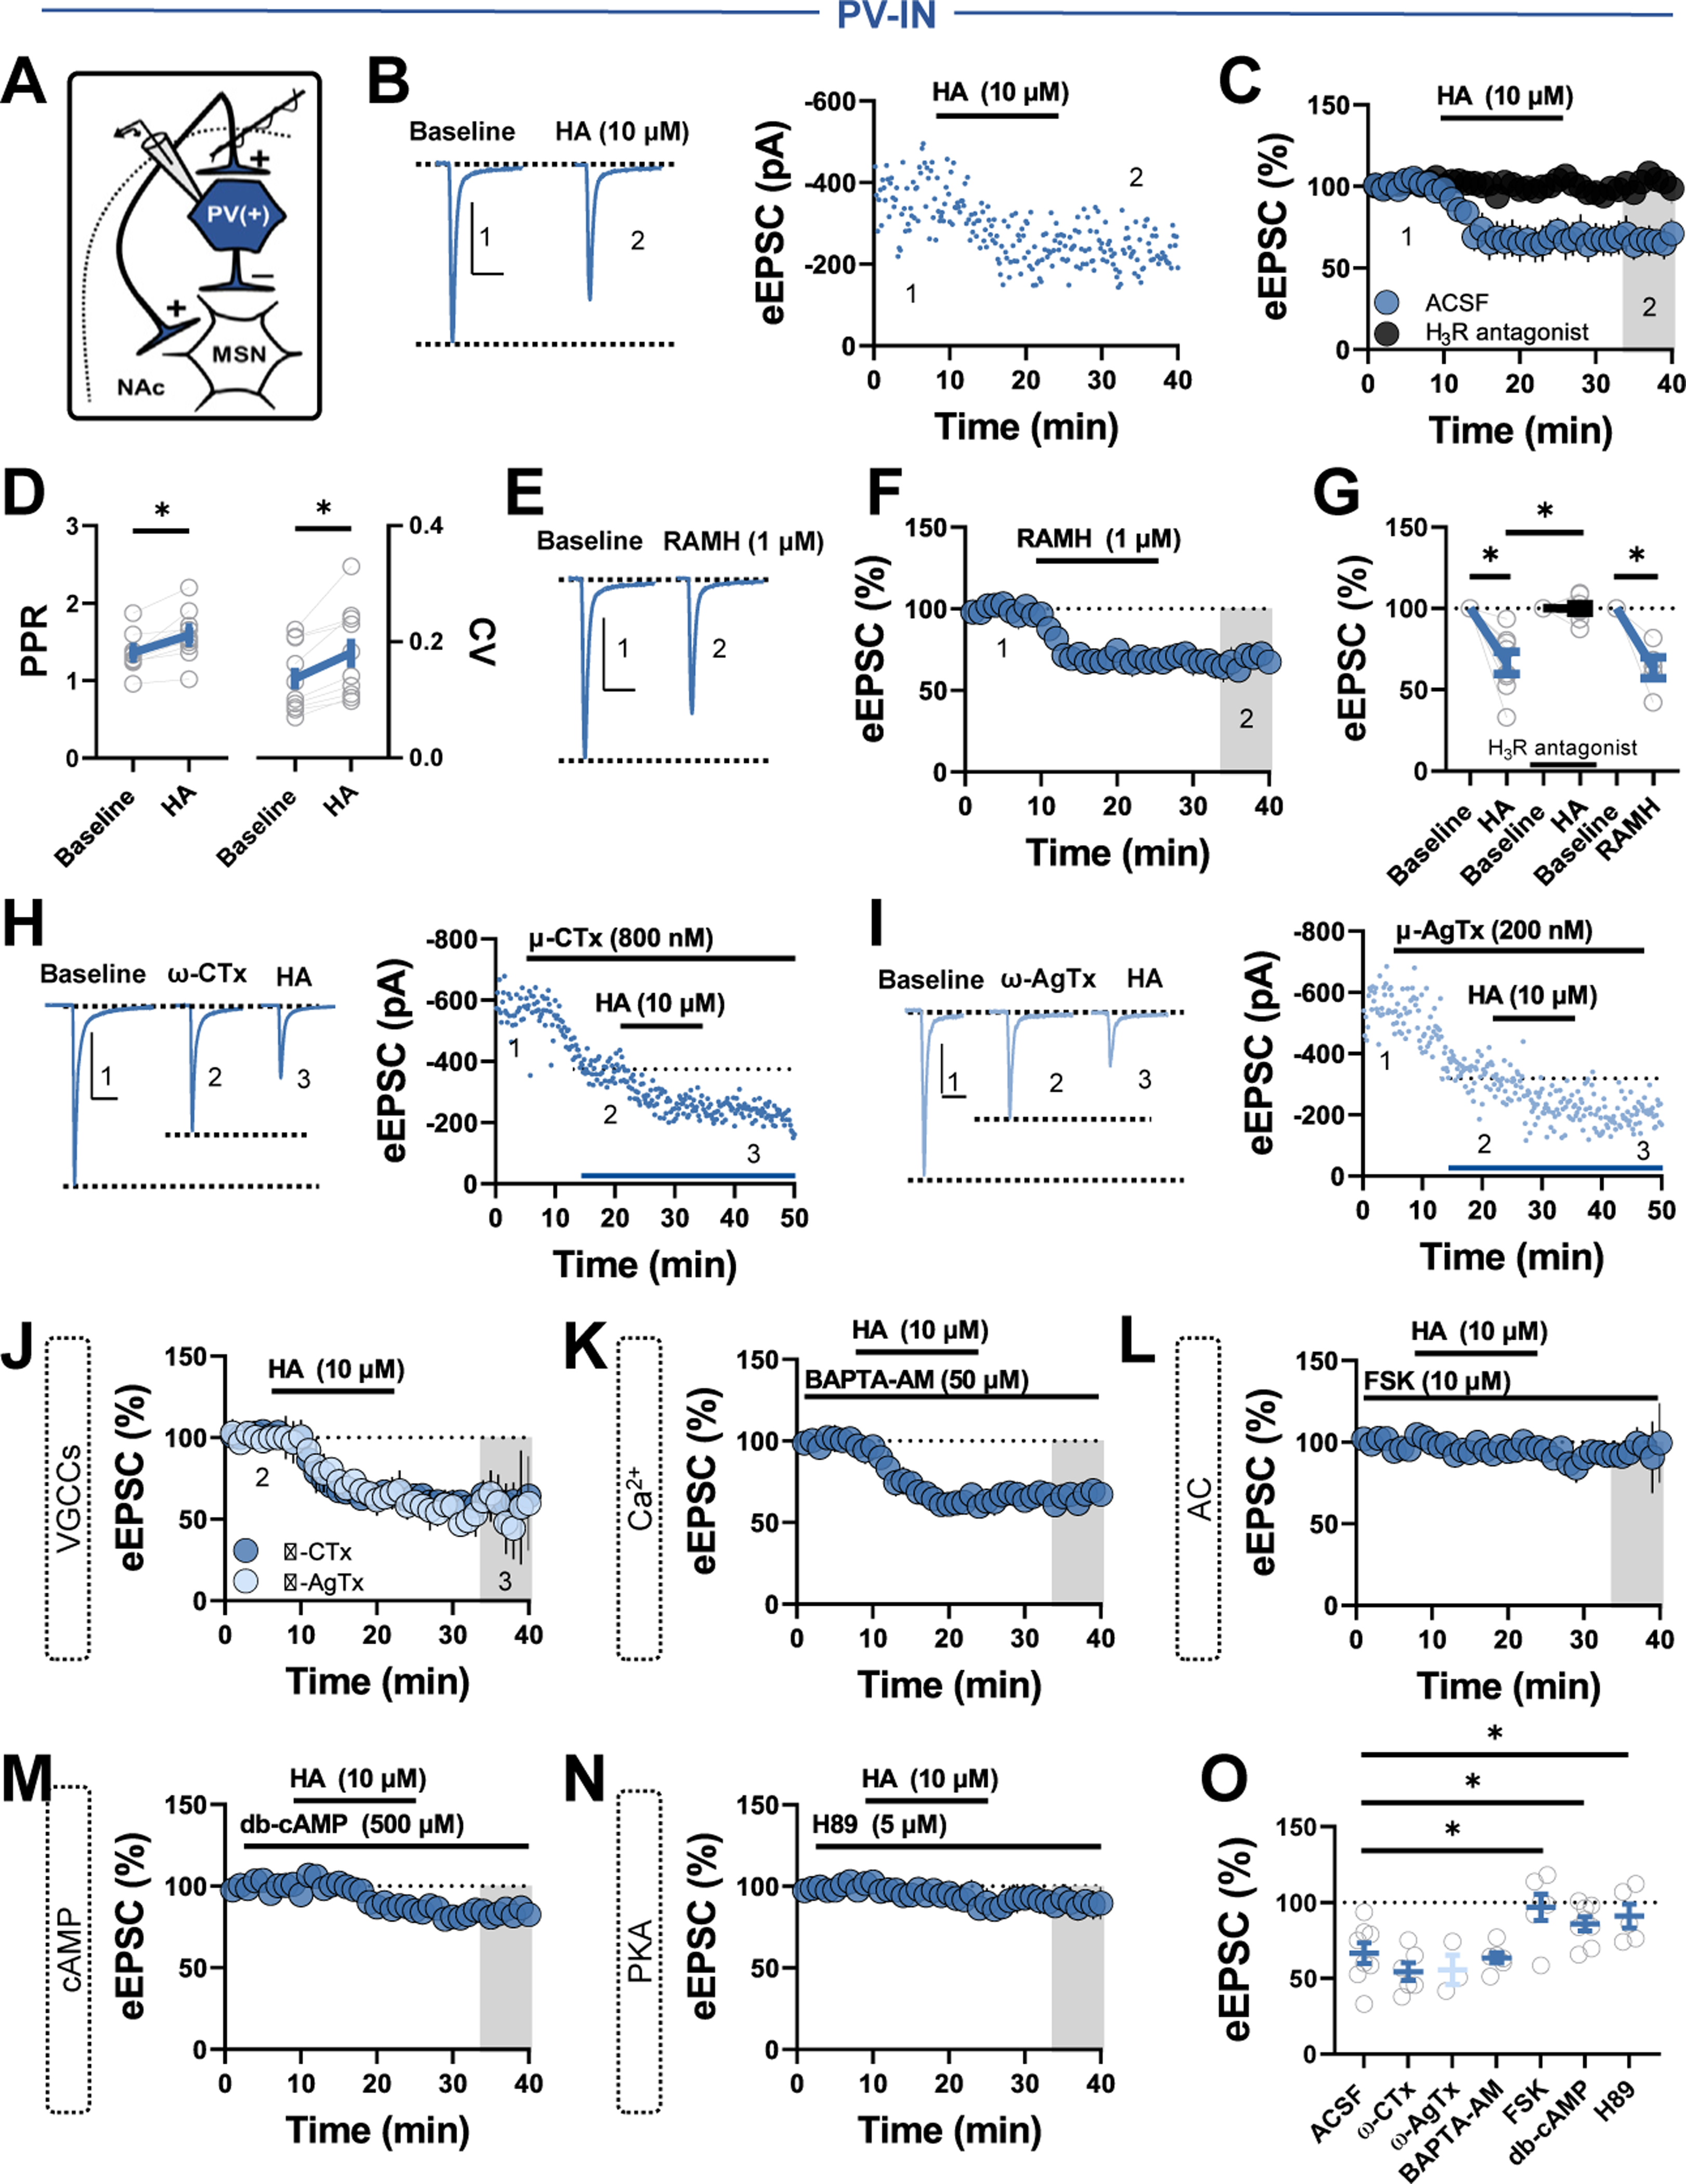
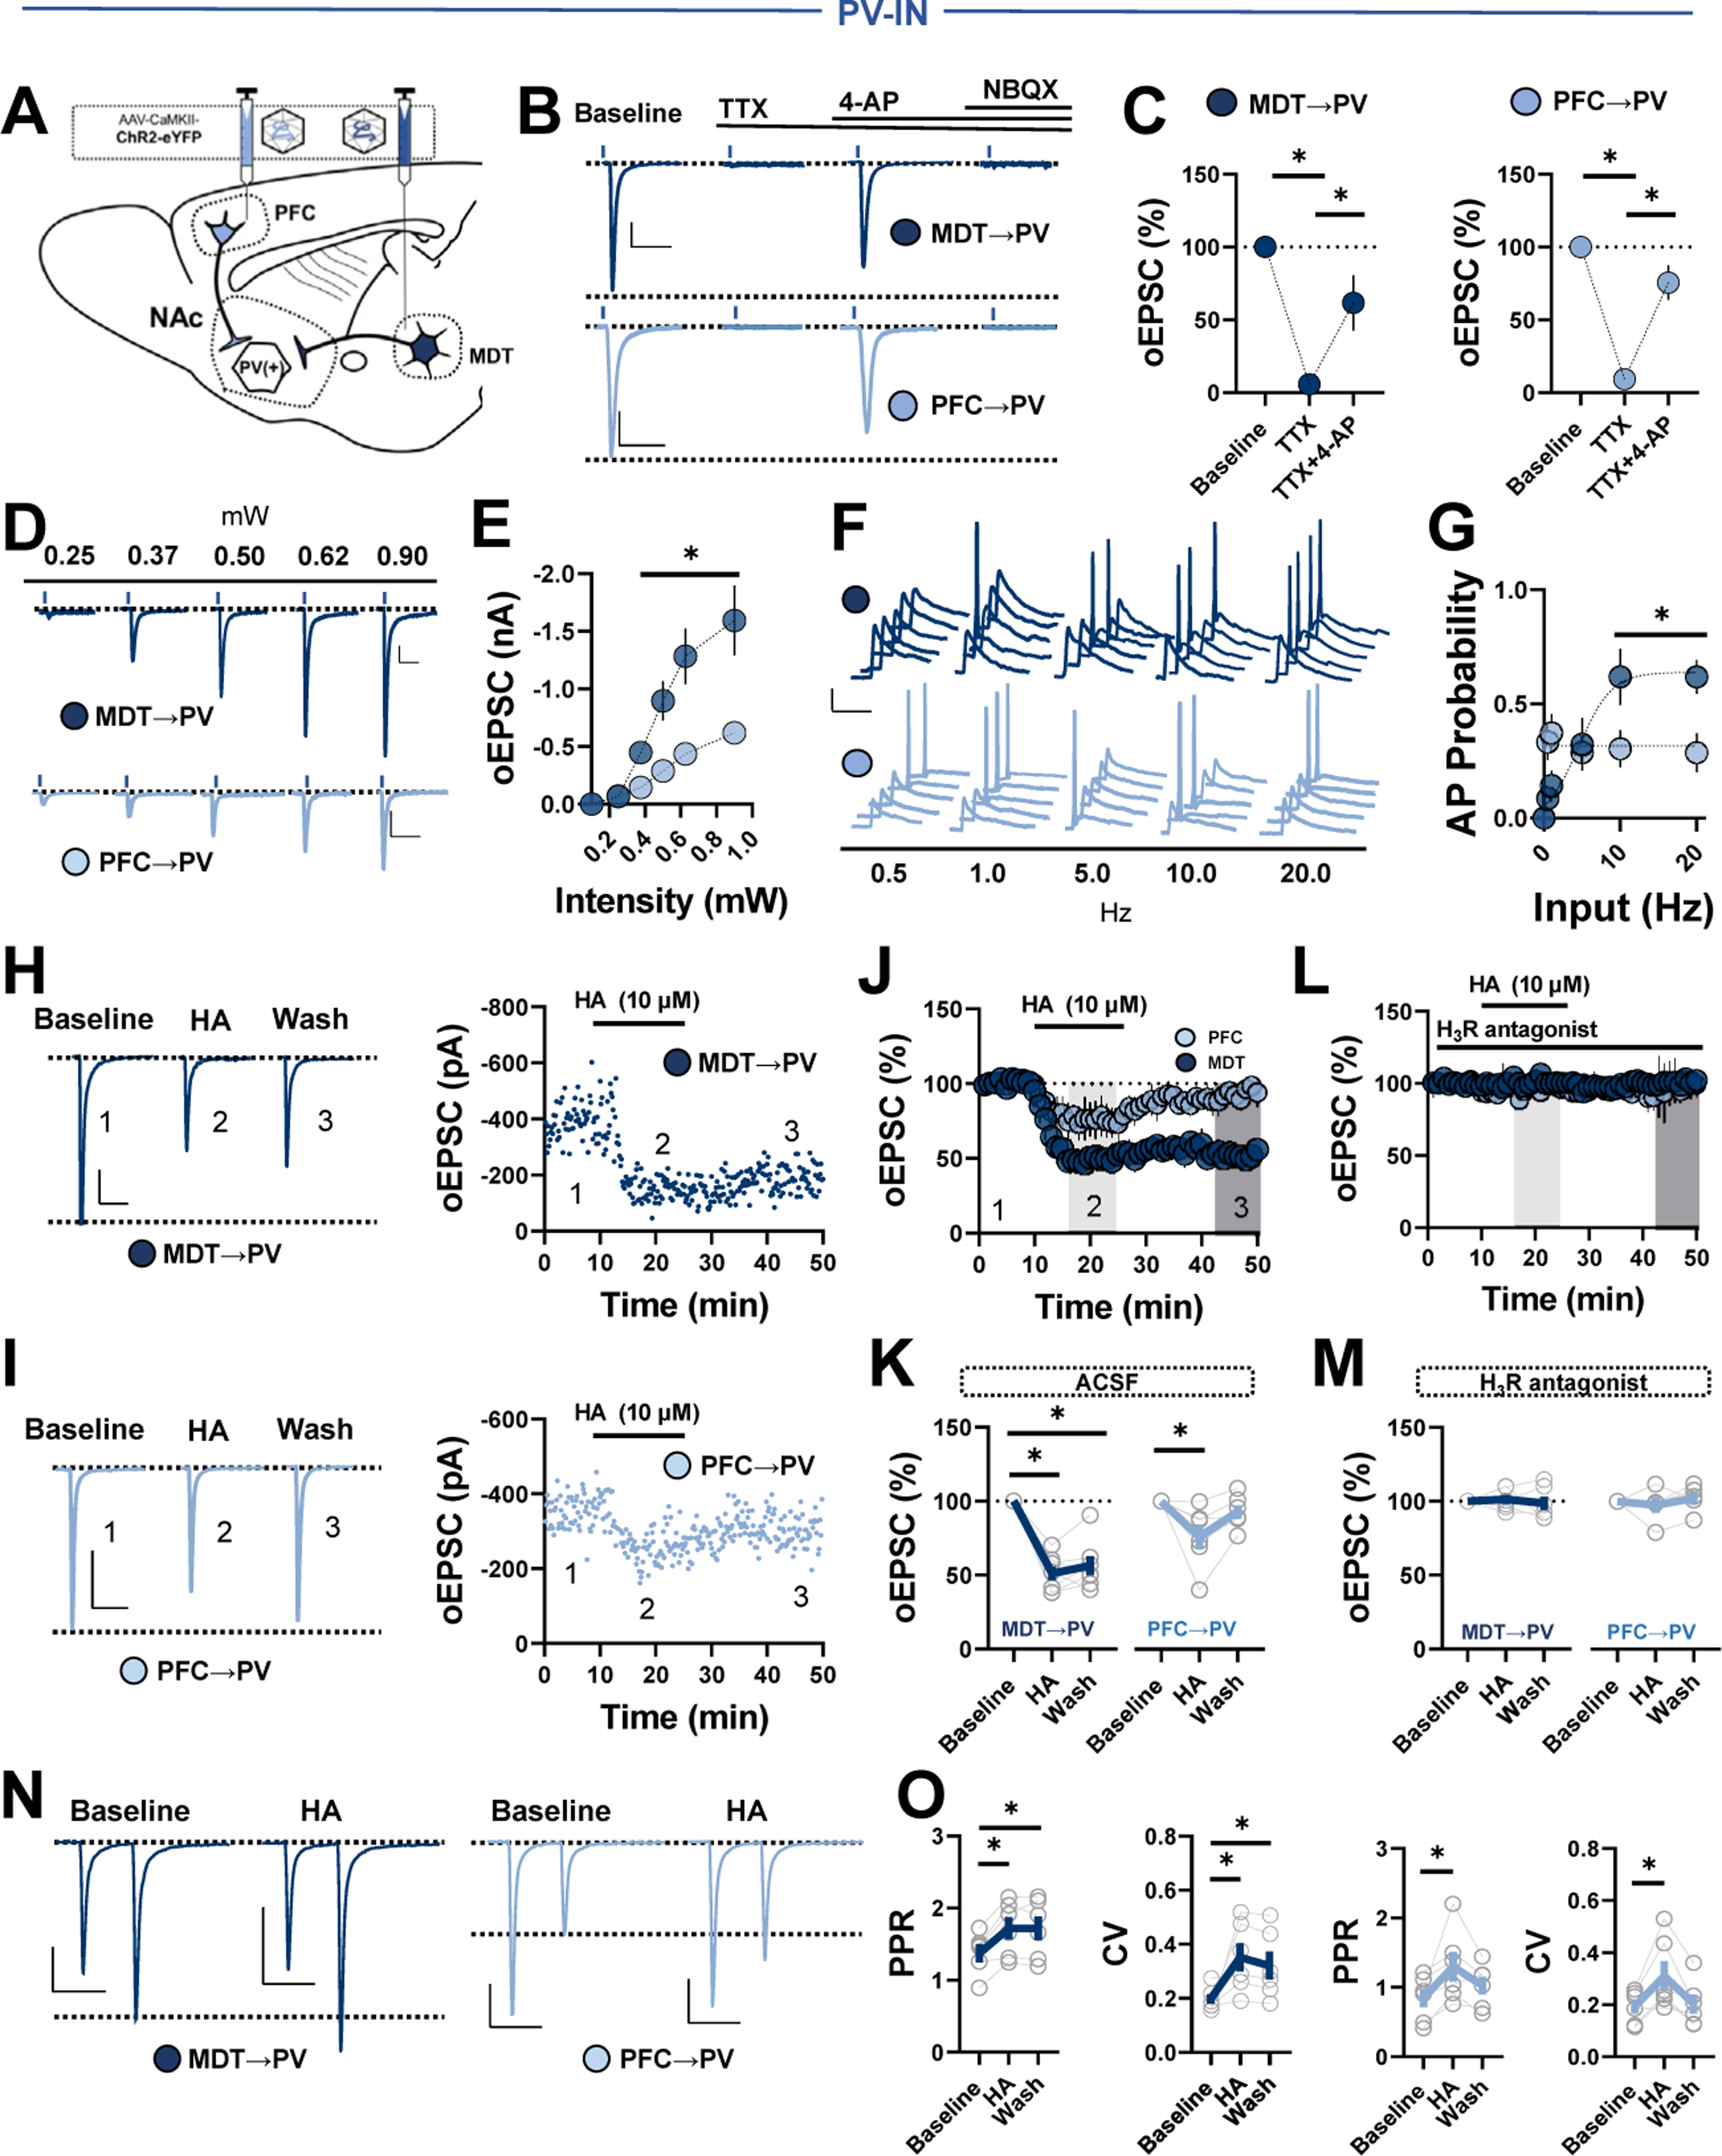
Background: Central histamine (HA) signaling modulates diverse cortical and subcortical circuits throughout the brain, including the nucleus accumbens (NAc). The NAc, a key striatal subregion directing reward-related behavior, expresses diverse HA receptor subtypes that elicit cellular and synaptic plasticity. However, the neuromodulatory capacity of HA within interneuron microcircuits in the NAc remains unknown.

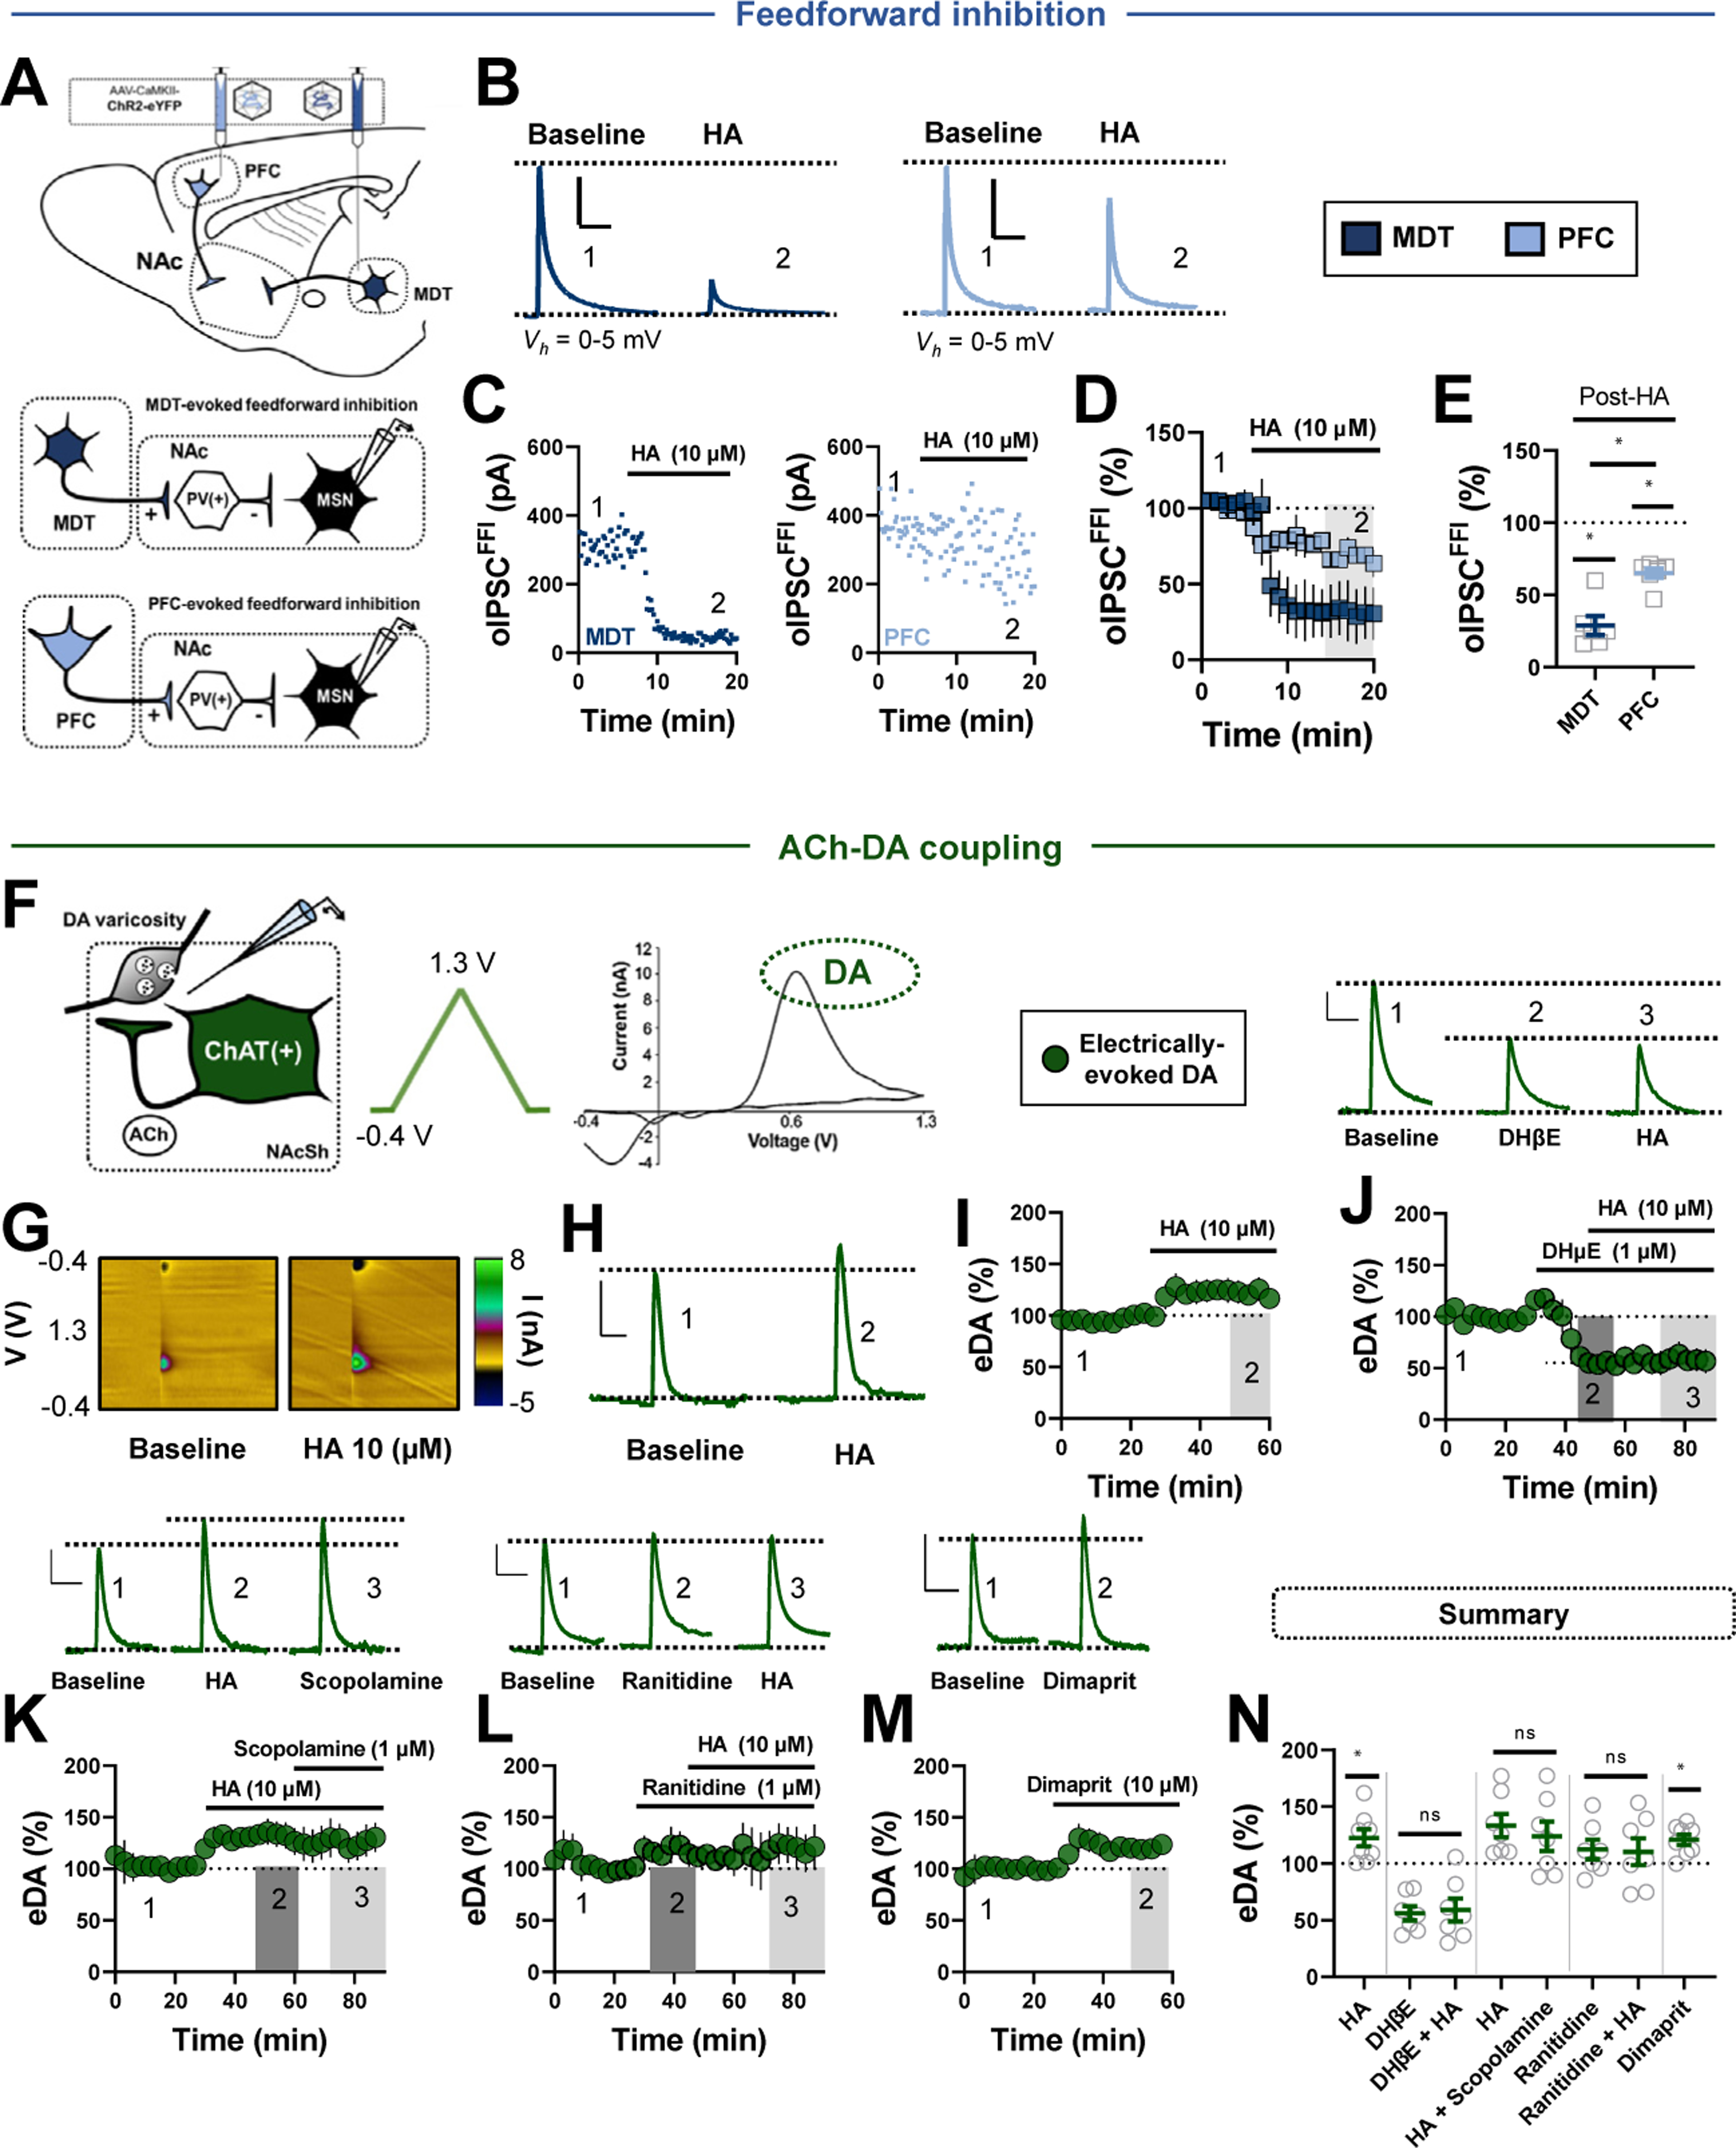
Methods: We combined electrophysiology, pharmacology, voltammetry, and optogenetics in male transgenic reporter mice to determine how HA influences microcircuit motifs controlled by parvalbumin-expressing fast-spiking interneurons (PV-INs) and tonically active cholinergic interneurons (CINs) in the NAc shell.

Results: HA enhanced CIN output through an H2 receptor (H2R)-dependent effector pathway requiring Ca2+-activated small-conductance K+ channels, with a small but discernible contribution from H1Rs and synaptic H3Rs. While PV-IN excitability was unaffected by HA, presynaptic H3Rs decreased feedforward drive onto PV-INs via AC-cAMP-PKA (adenylyl cyclase-cyclic adenosine monophosphate-protein kinase A) signaling. H3R-dependent plasticity was differentially expressed at mediodorsal thalamus and prefrontal cortex synapses onto PV-INs, with mediodorsal thalamus synapses undergoing HA-induced long-term depression. These effects triggered downstream shifts in PV-IN- and CIN-controlled microcircuits, including near-complete collapse of mediodorsal thalamus-evoked feedforward inhibition and increased mesoaccumbens dopamine release.

Conclusions: HA targets H1R, H2R, and H3Rs in the NAc shell to engage synapse- and cell type-specific mechanisms that bidirectionally regulate PV-IN and CIN microcircuit activity. These findings extend the current conceptual framework of HA signaling and offer critical insight into the modulatory potential of HA in the brain.

Keywords: Cholinergic interneurons; Dopamine; Electrophysiology; Feedforward inhibition; Histamine; Mediodorsal thalamus; Microcircuits; Nucleus accumbens; Optogenetics; Parvalbumin interneurons; Patch-clamp; Prefrontal cortex; Voltammetry.


Conflict of interest statement

The authors report no biomedical financial interests or potential conflicts of interest.

Figures

Figure 1.
Figure 1.
HA differentially regulates PV-IN and CIN excitability in the NAc shell. (A) Schematic depicting transgenic reporter strategy labeling tdT-positive PV-INs in the NAc shell of PVtdT mice. (B) Representative traces of PV-IN AP firing (left), membrane hyperpolarization (middle), and absent sAP firing (right) following +300 pA, −350 pA, and 0 pA current injection, respectively (scale bar = 20 mV/100 ms). (C) Representative traces of PV-IN AP firing evoked via +150 pA, +250 pA, and +350 pA current injection in ACSF (top, light blue) and HA (bottom, dark blue) (scale bar = 20 mV/100 ms). (D) Input-output curve of PV-IN AP firing in ACSF and HA. (E) Quantification of AP frequency in ACSF or HA following 350 pA current injection (AP350-pA ACSF: 80.58 ± 5.43 Hz, n = 11; AP350-pA HA: 79.31 ± 6.36 Hz, n =13, p = .880). (F) VRMP of PV-INs in ACSF vs. HA (VRMP ACSF: −76.50 ± 1.18 mV, n = 10; VRMP HA: −76.11 ± 1.81 mV, n = 7, p = .853). (G) Representative traces of IHolding in PV-INs exposed to RAMH (dark blue), dimaprit (black), or 2-PyEA (light blue) (scale bar = 30 pA/4 min). (H) Postdrug IHolding normalized within-cell to baseline (ACSF) IHolding RAMH: 102.01% ± 6.23%, n = 6; folding dimaprit: 98.60% ± 6.28%, n = 5; IHding 2-PyEA: 103.60% ± 5.08%, n = 5; one-way analysis of variance, F2,13 = 0.19, p = .829). (I) Schematic depicting transgenic reporter strategy labeling tdT-positive CINs in the NAc shell of ChATtdT mice. (J) Representative traces of CIN accommodating APs (scale bar = 20 mV/100 ms), hyperpolarization-activated Vsag (scale bar = 50 mV/100 ms), and tonic sAP firing (scale bar = 50 mV/500 ms), following +200 pA, −350 pA, and 0 pA current injection, respectively. (K) Representative traces of CIN sAP firing in pre- and post-vehicle (ACSF) (black) or HA (green) (scale bars = 50 pA/3 s). (L) Normalized time-course summary of sAP firing frequency at t(gray) following HA or vehicle application. (M) Average sAP frequency before and after HA or ACSF at t(gray) (baseline: 1.93 ± 0.42 Hz, HA: 4.256 ± 0.49 Hz, n = 14, p < .0001; baseline: 2.185 ± 0.58 Hz, vehicle: 2.14 ± 0.53 Hz, n = 7, p = .511). (N) Semilogarithmic plot of the HA-induced increase in sAP firing (HA effect) against basal sAP firing rate (HA effect vs. AP Basal R2 = 0.471). (O) Normalized time-course summary (left) and quantification (right) of sAP firing frequency during HA application in cetirizine or ranitidine (HA in ranitidine: 116.6% ± 7.67%, n = 7; HA inCTZ: 175.1% ± 22.08%, n = 8, p = .034). (P) Representative traces of CIN sAP firing in dimaprit or 2-PyEA (scale bars = 50 pA/3s). (Q) Normalized time-course summary (left) and quantification (right) of sAP firing frequency during dimaprit or 2-PyEA application (dimaprit: 420.8% ± 43.76%, n = 7; 2-PyEA: 135.7% ± 22.60%, n = 5, p = .005). Error bars indicate SEM. *p < .05. ACSF, artificial cerebrospinal fluid; AP, action potential; CIN, cholinergic interneuron; CTZ, cetirizine; HA, histamine; NAc, nucleus accumbens; PV-IN, parvalbumin-expressing fast-spiking interneuron; Ran., ranitidine; RMP, resting membrane potential; sAP, spontaneous AP; tdT, terminal deoxynucleotidyl transferase.
Figure 2.
Figure 2.
HA engages presynaptic H3Rs to increase E/I synaptic balance onto CINs. (A) Schematic depicting local excitatory (E) and inhibitory (I) synapses onto CINs. (B) Representative traces of CIN sAP firing before and after a cocktail of glutamatergic (NBQX+APV) (black) or GABAergic synaptic blockers (SCH 50911+PTX) (green) (scale bars = 50 pA/2 s). (C) Normalized time-course summary of sAP firing frequency during NBQX/APV application or SCH and PTX application. (D) Quantification of average sAP firing at t(gray) following the application of each synaptic blocker cocktail (NBQX/APV: 85.63% ± 4.78%, n = 5, p = .026; PTX/SCH: 141.60% ± 14.67%, n = 7, p = .029). (E) Representative traces of CIN sAP firing before and after HA application in GABAergic synaptic blockers (scale bar = 50 pA/2 s). (F) Normalized time-course summary of sAP firing frequency during HA application in SCH/PTX superimposed on ghosted ACSF replicate. (G) Representative traces of CIN sAP firing before and after HA application in glutamatergic synaptic blockers (scale bar = 50 pA/2 s). (H) Normalized time-course summary of sAP firing frequency during HA application in NBQX/APV superimposed on ghosted ACSF replicate. (I) Quantification of average sAP firing at t(gray) following HA in each synaptic blocker cocktail (HA in PTX/SCH: 184.7% ± 18.62%, n = 7; HA in NBQX/APV: 290.90% ± 32.91%, n = 9, GABA vs. glutamate receptor blockers, p = .038; HA in ACSF [replicated]: 284.6% ± 25.41%, n = 6, ACSF vs. GABA blockers, p = .024; one-way analysis of variance, F2,19 = 1.739, Sidak’s post hoc, p = .0214). (J) Schematic depicting whole-cell recording strategy examining local glutamatergic (E) transmission onto CINs. (K) Representative traces superimposed on an experiment of eEPSCs recorded before and after HA application (scale bar = 100 pA/50 ms). (L) Schematic depicting whole-cell recording strategy examining local GABAergic (I) transmission onto CINs. (M) Representative traces superimposed on an experiment of eIPSCs recorded before and after HA application (scale bar = 300 pA/50 ms). (N) Normalized time course summary of eIPSCs and eEPSCs during HA application (eEPSCs HA: 106.90% ± 7.44%, n = 5, p = .891; eIPSCs HA: 66.55% ± 5.37%, n = 5, p < .001; one-way analysis of variance, F2,12 = 11.52, Sidak’s post hoc, p = .0016; eIPSCs HA vs. eEPSCs HA, p = .002). (O) Normalized time-course summary of eIPSCs during HA application in ACSF containing H3R antagonist thioperamide (left) and quantification ofaverage eIPSC and eEPSC amplitude at t(gray) following HAor HA+H3R antagonist (eIPSCs HA in H3R: 98.11 % ± 5.74%, n = 5; eIPSCs HA vs. eIPSCs HA in H3R, p = .010). (P) CV of eIPSCs before and after HA (baseline CV: 0.20 ± 0.04, HA CV: 0.296 ± 0.05, n = 5, p = .028). (Q) Representative traces ofelectrochemically isolated eIPSCs and eEPSCs within cell before and after HA (scale bar = 200 pA/50 ms). (R) Quantification of average E/I ratio in ACSF vs. HA (E/I ACSF: 0.63 ± 0.12, n = 5; E/I HA: 1.45 ± 0.23, n = 6, p = .016). Error bars indicate SEM. *p < .05. ACSF, artificial cerebrospinal fluid; AP, action potential; CIN, cholinergic interneuron; CV, coefficient of variation; eEPSC, electrically evoked excitatory PSC; E/I, excitatory-inhibitory; eIPSC, electrically evoked inhibitory PSC; GABAergic, gamma-aminobutyric acidergic; H3R, H3 receptor; HA, histamine; MA, mecamylamine; NAc, nucleus accumbens; PSC, postsynaptic current; PTX, picrotoxin; sAP, spontaneous action potential; SCH, SCH 50911.
Figure 3.
Figure 3.
Decreased small conductance Ca2+-activated K+ channel function contributes to excitatory H2 receptor signaling in CINs. (A) Representative traces of VSAG in CINs following −200 pA and −400 pA current injection in ACSF (black), HA (light green), and dimaprit (dark green). (B) Average VSAG in ACSF, HA, or dimaprit following hyperpolarizing current steps (scale bars = 50 mV/100 ms). (C) Quantification of the maximum VSAG (at current injection = −400 pA) in ACSF or following each pharmacological manipulation (VSAG ACSF: 28.36 ± 4.87 mV, n = 9; VSAG HA: 30.63 ± 7.34 mV, n = 6; VSAG dimaprit: 30.92 ± 5.41 mV, n = 8; one-way analysis of variance, ACSF vs. drug, F2,20 = 0.66, Sidak’s post hoc, p = .979). (D) Representative traces (left) of VSAG before and after ZD7288 at approximately t = 20 minutes (†) obtained from separate CIN in Iclamp following −400 pA current step. Note absence of hyperpolarization-activated, cyclic nucleotide-gated cation-mediated VSAG. Normalized time-course summary (right) of sAP firing frequency during dimaprit application in the presence of ZD7288. (E) Normalized time-course summary of sAP firing frequency during dimaprit application in the presence of db-cAMP. (F) Normalized time-course summary of sAP firing frequency during dimaprit application in the presence of H89. (G) Quantification of average sAP firing at t(gray) following dimaprit in each pharmacological manipulation relative to ACSF (re-depicted from Figure 1L) (dimaprit in ZD7288: 359.30% ± 113.3%, n = 3, p = .580; dimaprit in db-cAMP: 417.7% ± 8.98%, n = 4, p = .974; dimaprit in H89: 359.11% ± 69.03%, n = 5, p = .483). (H) Representative traces of IHolding (VM = −70 mV) at baseline (ACSF) and in HA (black) or dimaprit (green) (scale bars = 40 pA/5 min). (I) Average IHolding before and after HA or dimaprit (HA IHolding: 101.70% ± 1.85%, n = 8, p = .542; dimaprit IHolding: 106.61% ± 75.14%, n = 8, p = .248). (J) Representative traces of sAPs in CINs exhibiting a high basal firing rate in ACSF (black) and the resulting dimaprit-induced transition to burst firing (green) (scale bars = 50 pA/3 s). (K) Normalized time-course summary (left) and quantification (right) of sAP firing frequency during dimaprit application in the presence of apamin (dimaprit in apamin: 168.40% ± 32.09%, n = 6, p = .002) (ACSF re-depicted from Figure 1L). (L) Representative traces of the voltage step-induced current response (scale bar = 500 pA/200 ms) and ITail at baseline (ACSF) (black) and following dimaprit (green) or apamin (gray) (ITail scale bars = 200 pA/50 ms). (M) Quantification of maximum ITail before and after dimaprit (peak ITail before dimaprit: 244.38 ± 28.07 pA; peak ITail after dimaprit: 209.6 ± 29.66 pA, n = 9, p = .017). Error bars indicate SEM. *p < .05. ACSF, artificial cerebrospinal fluid; AP, action potential; CIN, cholinergic interneuron; db-cAMP, dibutyryl cyclic adenosine monophosphate; Dim., dimaprit; HA, histamine; Max, maximum; sAP, spontaneous AP.
Figure 4.
Figure 4.
HA decreases feedforward glutamatergic drive onto PV-INs via AC-cAMP-PKA signaling. (A) Schematic depicting whole-cell recording strategy of local glutamatergic inputs onto PV-INs within feedforward inhibition microcircuits. (B) Representative traces (left) and experiment (right) of eEPSCs in PV-INs depicting the effects of HA. (C) Normalized time-course summary of eEPSCs following HA in ACSF or H3R antagonist thioperamide (HA: 66.50% ± 6.79%, n = 8, p = .002). (D) PPR (left) and CV (right) before and after HA (baseline PPR: 1.36 ± 0.08, HA PPR: 1.59 ± 0.10, n = 10, p = .001; baseline CV: 0.14 ± 0.02, HA CV: 0.18 ± 0.25, n = 10, p = .001). (E) Representative traces of eEPSCs depicting the effects of RAMH. (F) Normalized time-course summary of eEPSCs following RAMH. (G) Quantification of average eEPSC amplitude at t(gray) following each pharmacological manipulation (RAMH: 63.45% ± 6.41 %, n = 5, p = .005; HA in H3R antagonist: 99.95% ± 2.59%, n = 8, p = .981). (H) Representative occlusion experiment (left) and traces (right) depicting the effects of HA in ω-CTx. Representative occlusion experiment (left) and traces (right) depicting the effects of HA in ω-AgTx. (J) Normalized time-course summary of eEPSCs following HA in ACSF containing ω-CTx or ω-AgTx (HA in CTx: 54.31 % ± 5.371%, n = 6, p = .370; HA in AgTx: 55.44% ± 9.67%, n = 3, p = .591). (K) Normalized time-course summary of eEPSCs following HA in slices incubated for 1 hour in BAPTA-AM (HA in BAPTA-AM: 63.41% ± 3.39%, n = 6, p = .721). (L) Normalized time-course summary of eEPSCs following HA in slices incubated for at least 2 hours in FSK (HA in FSK: 96.82% ± 8.65%, n = 6, p = .016). (M) Normalized time-course summary of eEPSCs following HA application in db-cAMP (HA in db-cAMP: 85.88% ± 4.59%, n = 8, p = .032). (N) Normalized time-course summary of eEPSCs following HA in H89 (HA in H89: 91.01% ± 7.84%, n = 5, p = .041). (O) Quantification of average eEPSC amplitude at t(gray) following each pharmacological manipulation. All scale bars = 300 pA/50 ms. Error bars indicate SEM. *p < .05. AC, adenylyl cyclase; ACSF, artificial cerebrospinal fluid; cAMP, cyclic adenosine monophosphate; CV, coefficient of variation; db-cAMP, dibutyryl cAMP; eEPSC, electrically evoked excitatory postsynaptic current; FSK, forskolin; H3R, H3 receptor; HA, histamine; MSN, medium spiny neuron; NAc, nucleus accumbens; ω-AgTx, ω-agatoxin TK; ω-CTx; ω-conotoxin GVIA; PKA, protein kinase A; PPR, paired-pulse ratio; PV-IN, parvalbumin-expressing fast-spiking interneuron; Ran., ranitidine; VGCC, voltage-gated Ca2+ channel.
Figure 5.
Figure 5.
Thalamocortical transmission differentially engages PV-INs in an HA-biased microcircuit. (A) Schematic depicting stereotaxic delivery of channelrhodopsin-2 into the PFC or MDT of PVtdT mice. (B) Representative traces of MDT-evoked (dark blue) or PFC-evoked (light blue) oEPSCs in PV-INs at baseline and following the sequential addition of TTX, APV, and NBQX (scale bars = 100 pA/50 ms). (C) Average oEPSC amplitude following TTX and TTX+4-AP at MDT-to-PV-IN (left) or PFC-to-PV-IN (right) synapses (TTX MDT: 11.20% ± 6.93%, n = 3, p = .006; TTX+4-AP MDT: 61.68% ± 18.90%, n = 3, p = .039; TTX PFC: 9.21% ± 1.95%, n = 3, p < .001; TTX+4-AP PFC: 75.59% ± 11.74%, n = 3, p = .033). (D) Representative traces of MDT- and PFC-evoked oEPSCs at increasing light stimulus intensities (scale bars = 100 pA/50 ms). (E) Quantification of average oEPSC amplitude at MDT vs. PFC inputs across stimulus intensities (MDT0.25: −0.065 ± 0.021 nA, MDT0.375: −0.447 ± 0.084 nA, MDT0.5: −0.897 ± 0.169 nA, MDT0.625: −1.28 ± 0.239 nA, MDT0.9: −1.59 ± 0.300 nA, n = 6; PFC0.25: −0.070 ± 0.018 nA, PFC0.375: −0.144 ± 0.027 nA, PFC0.5: −0.288 ± 0.054 nA, PFC0.625: −0.437 ± 0.064 nA, PFC0.9: −0.618 ± 0.0691 nA, n = 11; one-way repeated measures ANOVA, MDT vs. PFC, Sidak’s post hoc, p < .0001). (F) Representative traces of MDT- and PFC-evoked APs at increasing stimulus frequencies (scale bars = 10 mV/50 ms). (G) AP probability at increasing stimulus frequencies at MDT-to-PV-IN or PFC-to-PV-IN synapses (MDT0.5: 0.086 ± 0.054, MDT1 0.143 ± 0.066, MDT5: 0.324 ± 0.116, MDT10: 0.619 ± 0.124, MDT20: 0.619 ± 0.074, n = 8; PFC0.5: 0.333 ± 0.079, PFC1 0.373 ± 0.083, PFC5: 0.286 ± 0.073, PFC10: 0.303 ± 0.819, PFC20: 0.286 ± 0.086, n = 20; one-way repeated measures ANOVA, MDT20 vs. PFC20, p = .0341). (H) Representative traces (left) and experiment (right) of MDT-evoked eEPSCs in PV-INs depicting the effects of HA (scale bars = 100 pA/50 ms). (I) Representative traces (left) and experiment (right) of PFC-evoked eEPSCs in PV-INs depicting the effects of HA (scale bars = 100 pA/50 ms). (J) Normalized time-course summary of PFC- and MDT-evoked oEPSCs following HA. (K) Quantification of average oEPSC amplitude at t(light gray) following HA and during washout at t(dark gray) (MDT 51.18% ± 4.68%, p < .0001; wash: 56.38% ± 6.34%, p < .0001; F2,18 = 3.45, n = 7; PFC HA: 76.32% ± 5.57%, p = .0171; wash: 93.27% ± 4.57%, p = .641; F2,15 = 5.28, n = 6). (L) Normalized time-course summary PFC- and MDT-evoked oEPSCs following HA in JNJ 520785. (M) Quantification of MDT- and PFC-evoked oEPSCs following HA in JNJ 520785 (MDT HA in JNJ 520785: 101.2% ± 2.98%, p = .946; wash: 98.73% ± 4.55%, p = .943; F2,15 = 5.09, n = 6; PFC HA in JNJ 520785: 97.59% ± 5.24%, p = .871;wash: 102.2% ± 4.18%, p = .886; F2,12 = 1.67, n = 5). (N) Representative traces of 50-ms PPR at MDT- and PFC-to-PV-IN synapses before and after HA (scale bars = 100 pA/50 ms). (O) PPR (left) and CV (right) at baseline, in HA, and following washout (MDT baseline PPR: 1.37 ± 0.14, HA: 1.72 ± 0.16 [p = .008], wash: 1.71 ± 0.17[p = .032], n = 6, one-way ANOVA, F2,15 = 1.74; MDT baseline CV: 0.19 ± 0.17, HA: 0.35 ± 0.05 [p = .0439], wash: 0.32 ± 0.05 [p = .110], n = 6, one-way ANOVA, F2,15 = 3.53; PFC baseline PPR: 0.84 ± 0.14, HA: 1.30 ± 0.22 [p = .043], wash: 0.45 ± 0.16 [p = .451], n = 6, one-way ANOVA, F2,15 = 0.78; PFC baseline CV: 0.19 ± 0.03, HA: 0.31 ± 0.05 [p = .0439], wash: 0.32 ± 0.05 [p = .815], n = 6, one-way ANOVA, Sidak’s post hoc, F2,15 = 2.49). Error bars indicate SEM. *p < .05. ACSF, artificial cerebrospinal fluid; ANOVA, analysis of variance; AP, action potential; CV, coefficient of variation; HA, histamine; MDT, mediodorsal thalamus; NAc, nucleus accumbens; oEPSC, optically evoked excitatory postsynaptic current; PFC, prefrontal cortex; PPR, paired-pulse ratio; PV, parvalbumin; PV-IN, PV-expressing fast-spiking interneuron; TTX, tetrodotoxin.
Figure 6.
Figure 6.
HA divergently modulates afferent-evoked FFI and cholinergic interneuron-dependent DA release. (A) Schematic depicting stereotaxic delivery of channelrhodopsin-2 into the PFC or MDT of wild-type mice (top) and FFI recording strategy in MSNs (bottom). (B) Representative traces of MDT-evoked (dark blue) or PFC-evoked (light blue) oIPSCsFFI in MSNs before and after HA (scale bars = 150 pA/50 ms). (C) Representative experiments depicting the effects of HA on MDT- or PFC-evoked oIPSCsFFI in MSNs. (D, E) Normalized time-course summary and quantification at t(gray) of PFC- and MDT-evoked oIPSCsFFI following HA (MDT HA: 28.92% ± 6.58%, n = 6, p < .0001; PFC HA: 65.27% ± 3.13%, n = 7, p = .0002; MDT vs. PFC, p = .0003). (F) Schematic depicting ACh-DA coupling and the fast-scan cyclic voltammetry recording strategy of DA in NAcSh slices (left). Triangular waveform was applied to the carbon-fiber tip and DA was detected at its oxidation potential (middle). A representative current-voltage plot (right). (G) Representative color plots showing DA (in green) before and after HA application. (H) Representative current vs. time plots showing DA evoked by single-pulse stimulation before and after HA. (I) Normalized time-course summary depicting the effects of HA on DA release (HA: 122.40% ± 7.51%, n = 8, p = .021). (J) Representative DA signals (top) and normalized time-course summary (bottom) depicting the effects of DHβE and DHβE+HA on peak DA amplitude (DHβE alone: 55.98% ± 6.27%, n = 7, p < .0001; HA+DHβE: 58.97% ± 10.12%, n = 7, DHβE vs. HA+DHβE, p = .806). (K) Representative DA traces (top) and normalized time-course summary (bottom) depicting the effects of HA and HA+scopolamine on peak DA amplitude (HA: 133.2% ± 10.33%, HA+scopolamine: 123.8% ± 12.95%, n = 7, HA vs. HA+scopolamine, P = 0.224). (L) Representative DA transients (top) and normalized time-course summary (bottom) depicting the effects of ranitidine and ranitidine+HA on peak DA amplitude (ranitidine: 112.2% ± 8.55%, n = 7, p = .203; HA+ranitidine: 110.2% ± 11.84%, n = 7, ranitidine vs. ranitidine+HA, p = .748). (M) Representative DA transients (top) and normalized time-course summary (bottom) depicting the effects of dimaprit on DA amplitude (dimaprit: 121.7% ± 4.63%, n = 8, p = .003). (N) Average DA amplitude following each pharmacological manipulation relative to baseline. All fast-scan cyclic voltammetry scale bars = 5 nA/3 second. Error bars indicate SEM. *p < .05. ACh, acetylcholine; ANOVA, analysis of variance; ChAT, choline acetyltransferase; DA, dopamine; eDA, electrically evoked DA; FFI, feedforward inhibition; HA, histamine; MDT, mediodorsal thalamus; MSN, medium spiny neuron; NAc, nucleus accumbens; NAcSh, NAc shell; ns, not significant; oIPSC, optically evoked inhibitory postsynaptic current; PFC, prefrontal cortex; PV, parvalbumin.

Comment in

References

    1. Takagi H, Morishima Y, Matsuyama T, Hayashi H, Watanabe T, Wada H (1986): Histaminergic axons in the neostriatum and cerebral cortex of the rat: A correlated light and electron microscopic immunocytochemical study using histidine decarboxylase as a marker. Brain Res 364:114–123. - PubMed
    1. Watanabe T, Taguchi Y, Shiosaka S, Tanaka J, Kubota H, Terano Y, et al. (1984): Distribution of the histaminergic neuron system in the central nervous system of rats; a fluorescent immunohistochemical analysis with histidine decarboxylase as a marker. Brain Res 295:13–25. - PubMed
    1. Panula P, Nuutinen S (2013): The histaminergic network in the brain: 22. Basic organization and role in disease [no. 7]. Nat Rev Neurosci 14:472–487. - PubMed
    1. Passani MB, Blandina P (2011): Histamine receptors in the CNS as 23. targets for therapeutic intervention. Trends Pharmacol Sci 32:242249. - PubMed
    1. Brabant C, Alleva L, Quertemont E, Tirelli E (2010): Involvement of the 24. brain histaminergic system in addiction and addiction-related behaviors: A comprehensive review with emphasis on the potential therapeutic use of histaminergic compounds in drug dependence. Prog Neurobiol 92:421–441.. - PubMed

Publication types