. 2022 Jan:69:313-322.
doi: 10.1016/j.ymben.2021.12.007. Epub 2021 Dec 22.

Isotopically nonstationary 13C metabolic flux analysis in resting and activated human platelets

Affiliations

Isotopically nonstationary 13C metabolic flux analysis in resting and activated human platelets

Cara L Sake et al. Metab Eng. 2022 Jan.

Abstract

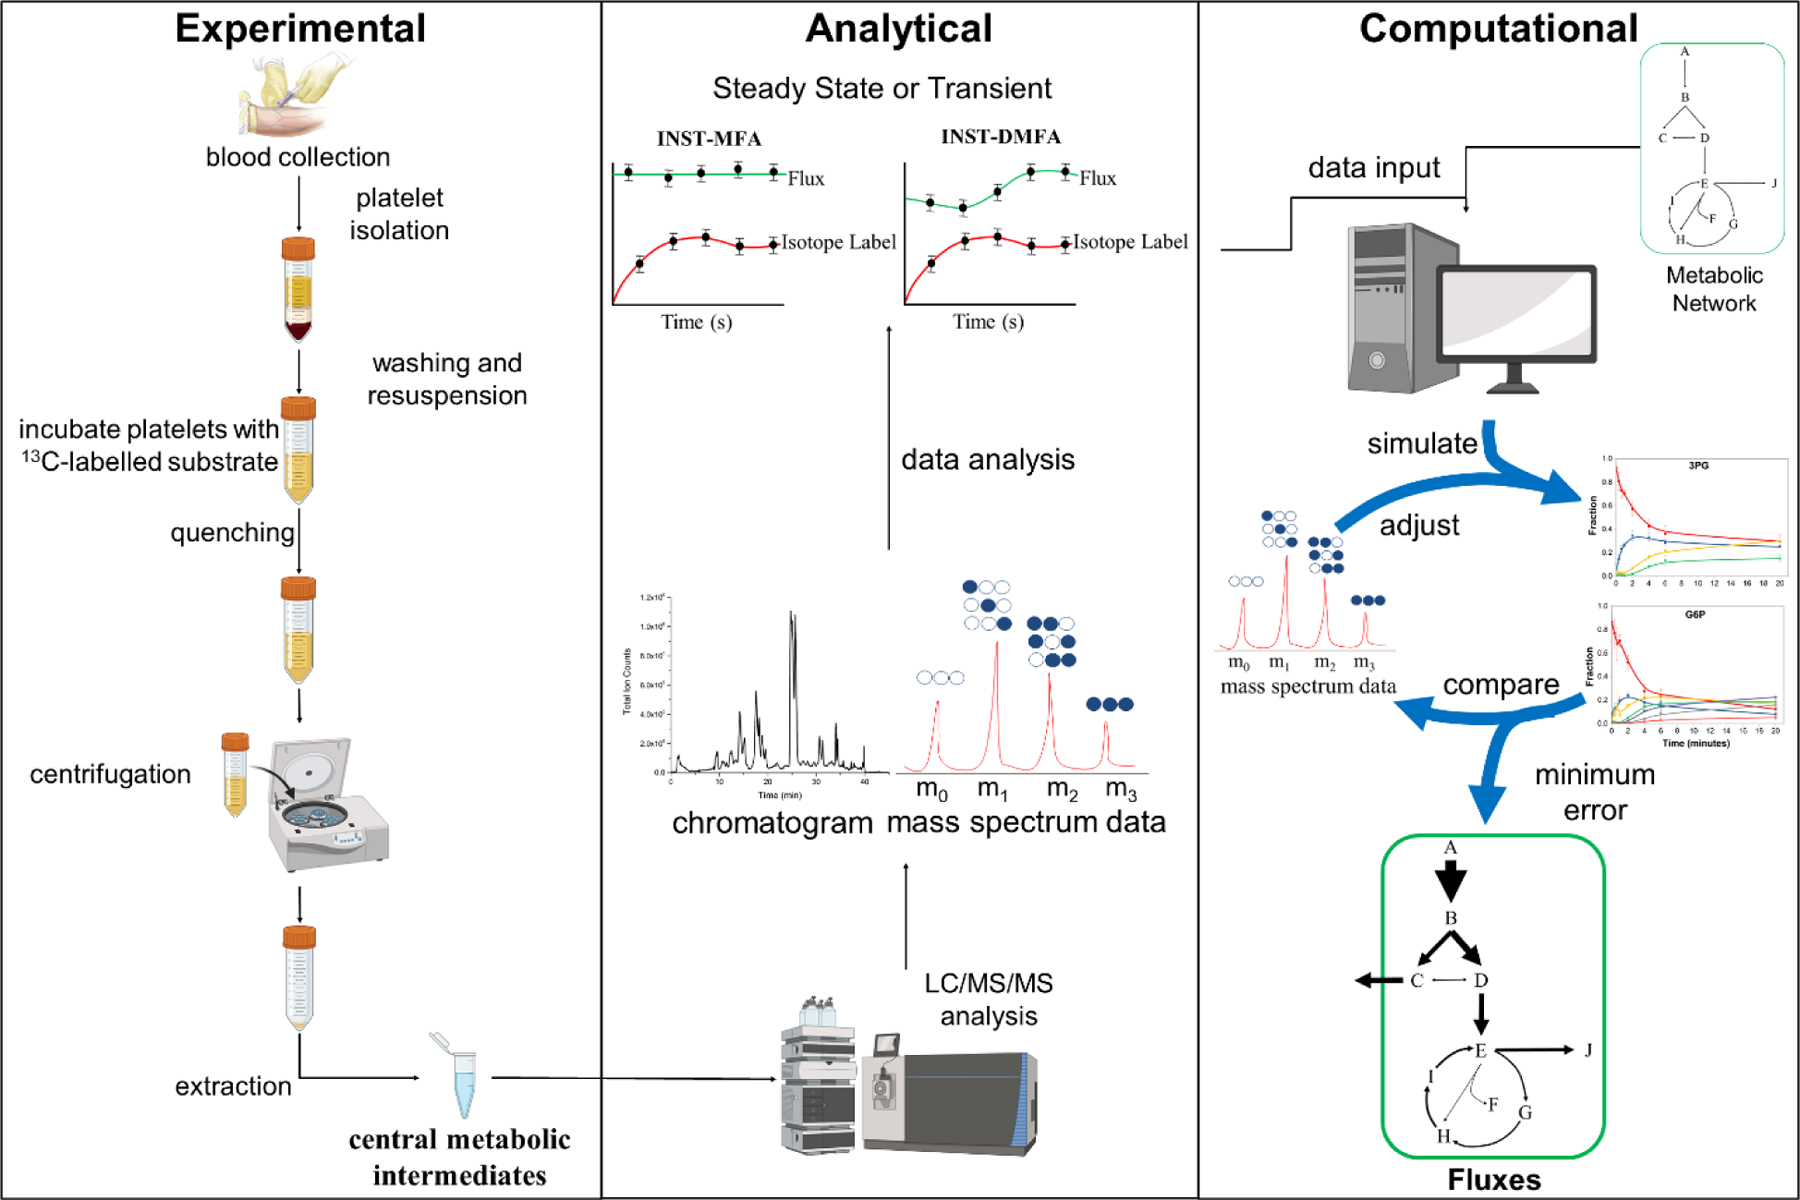
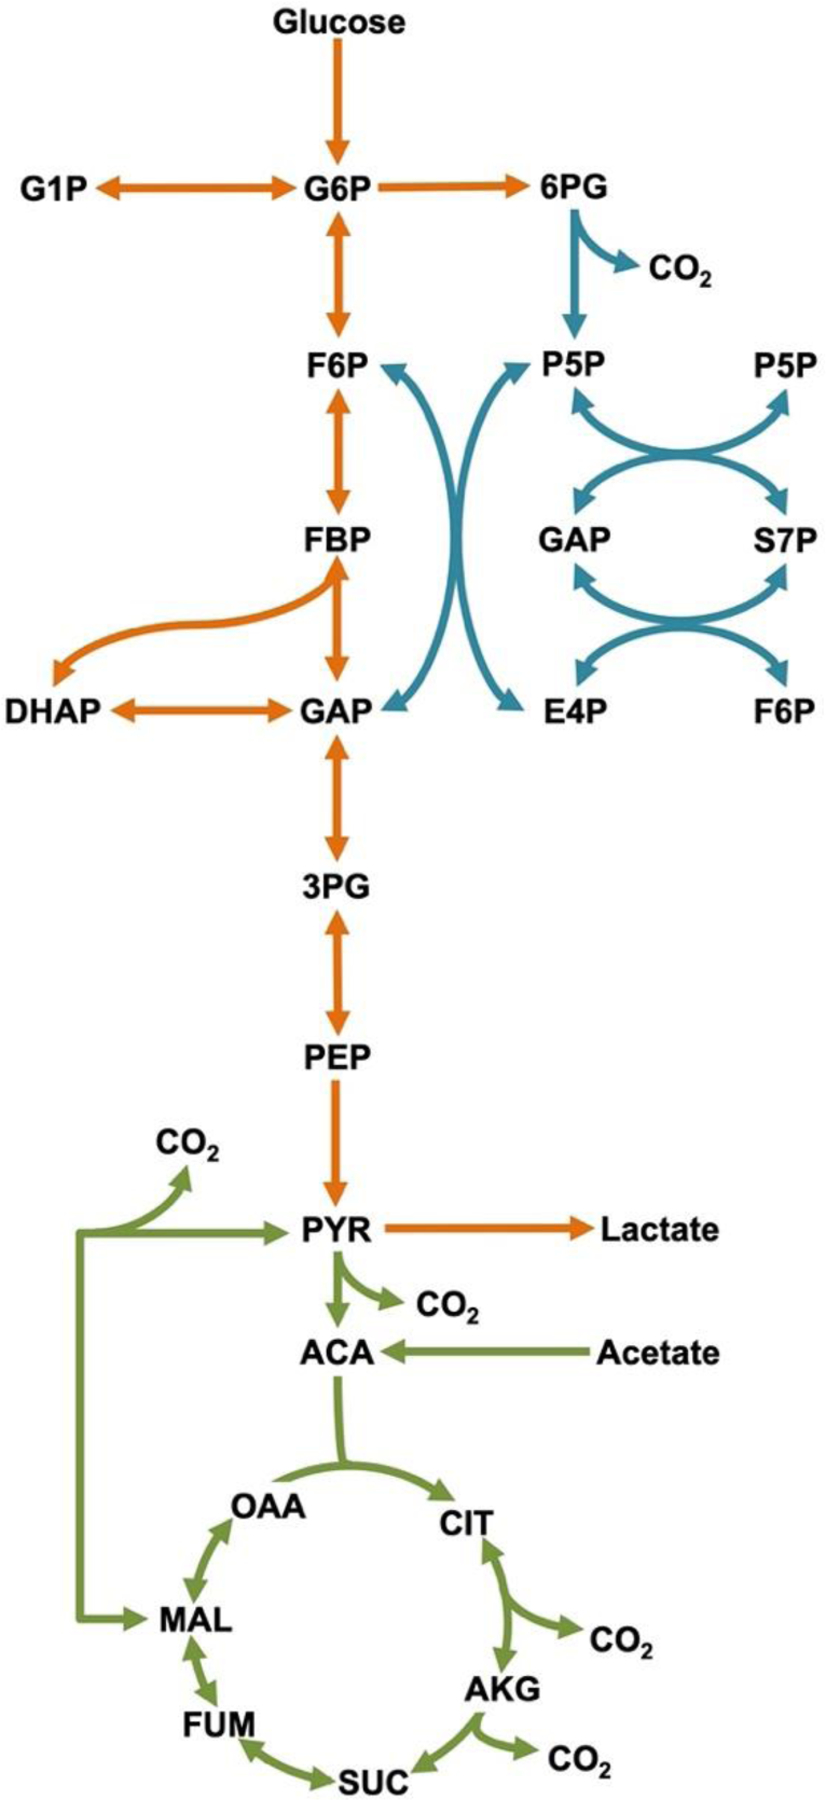
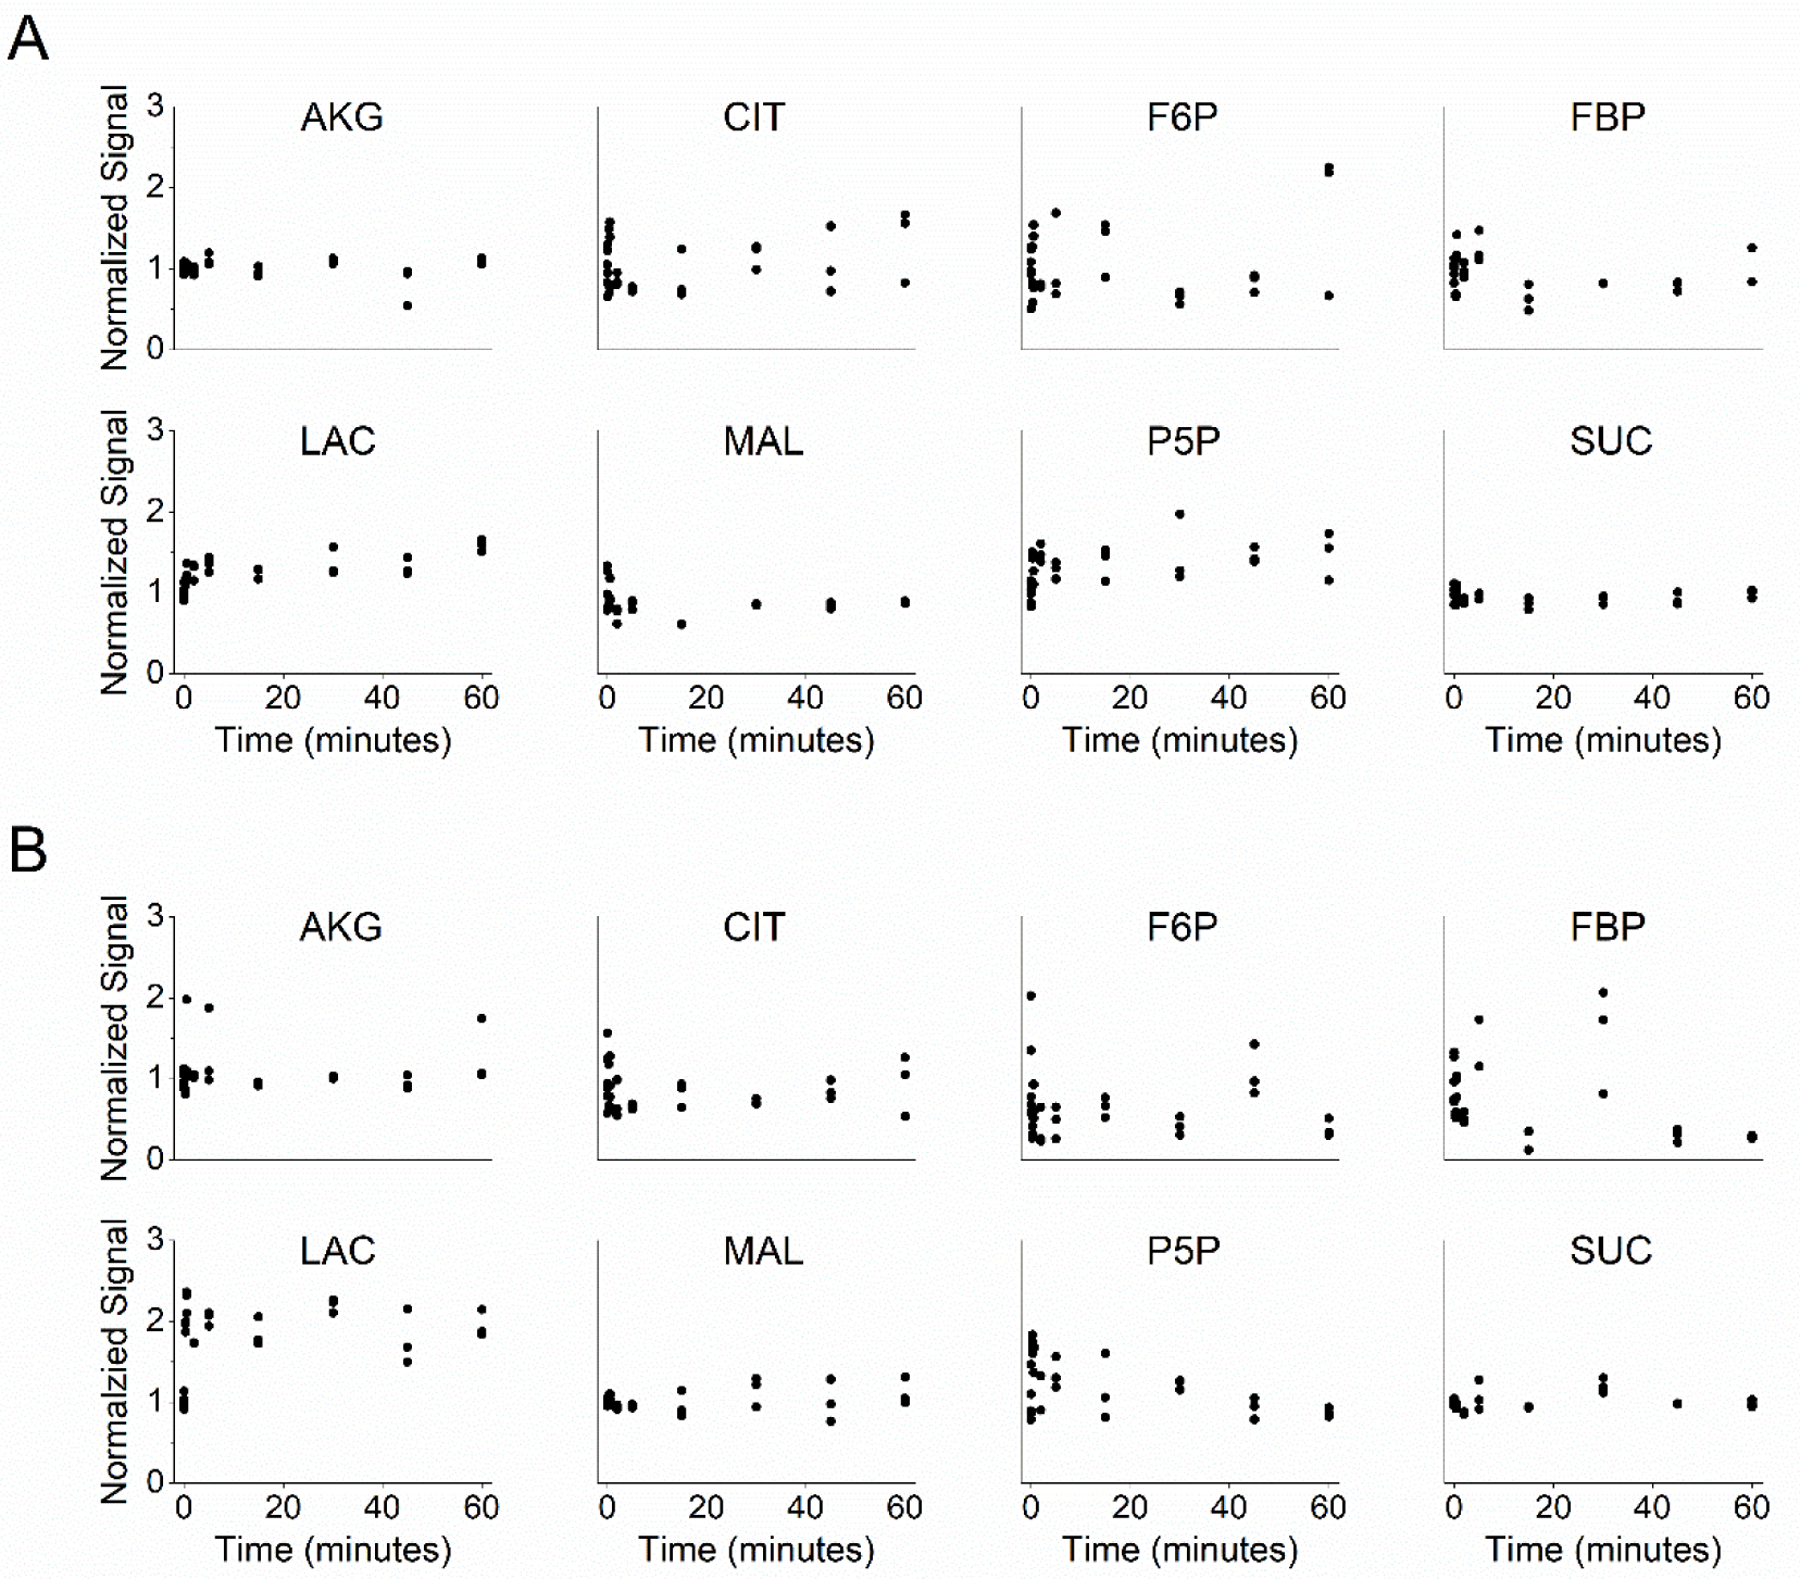
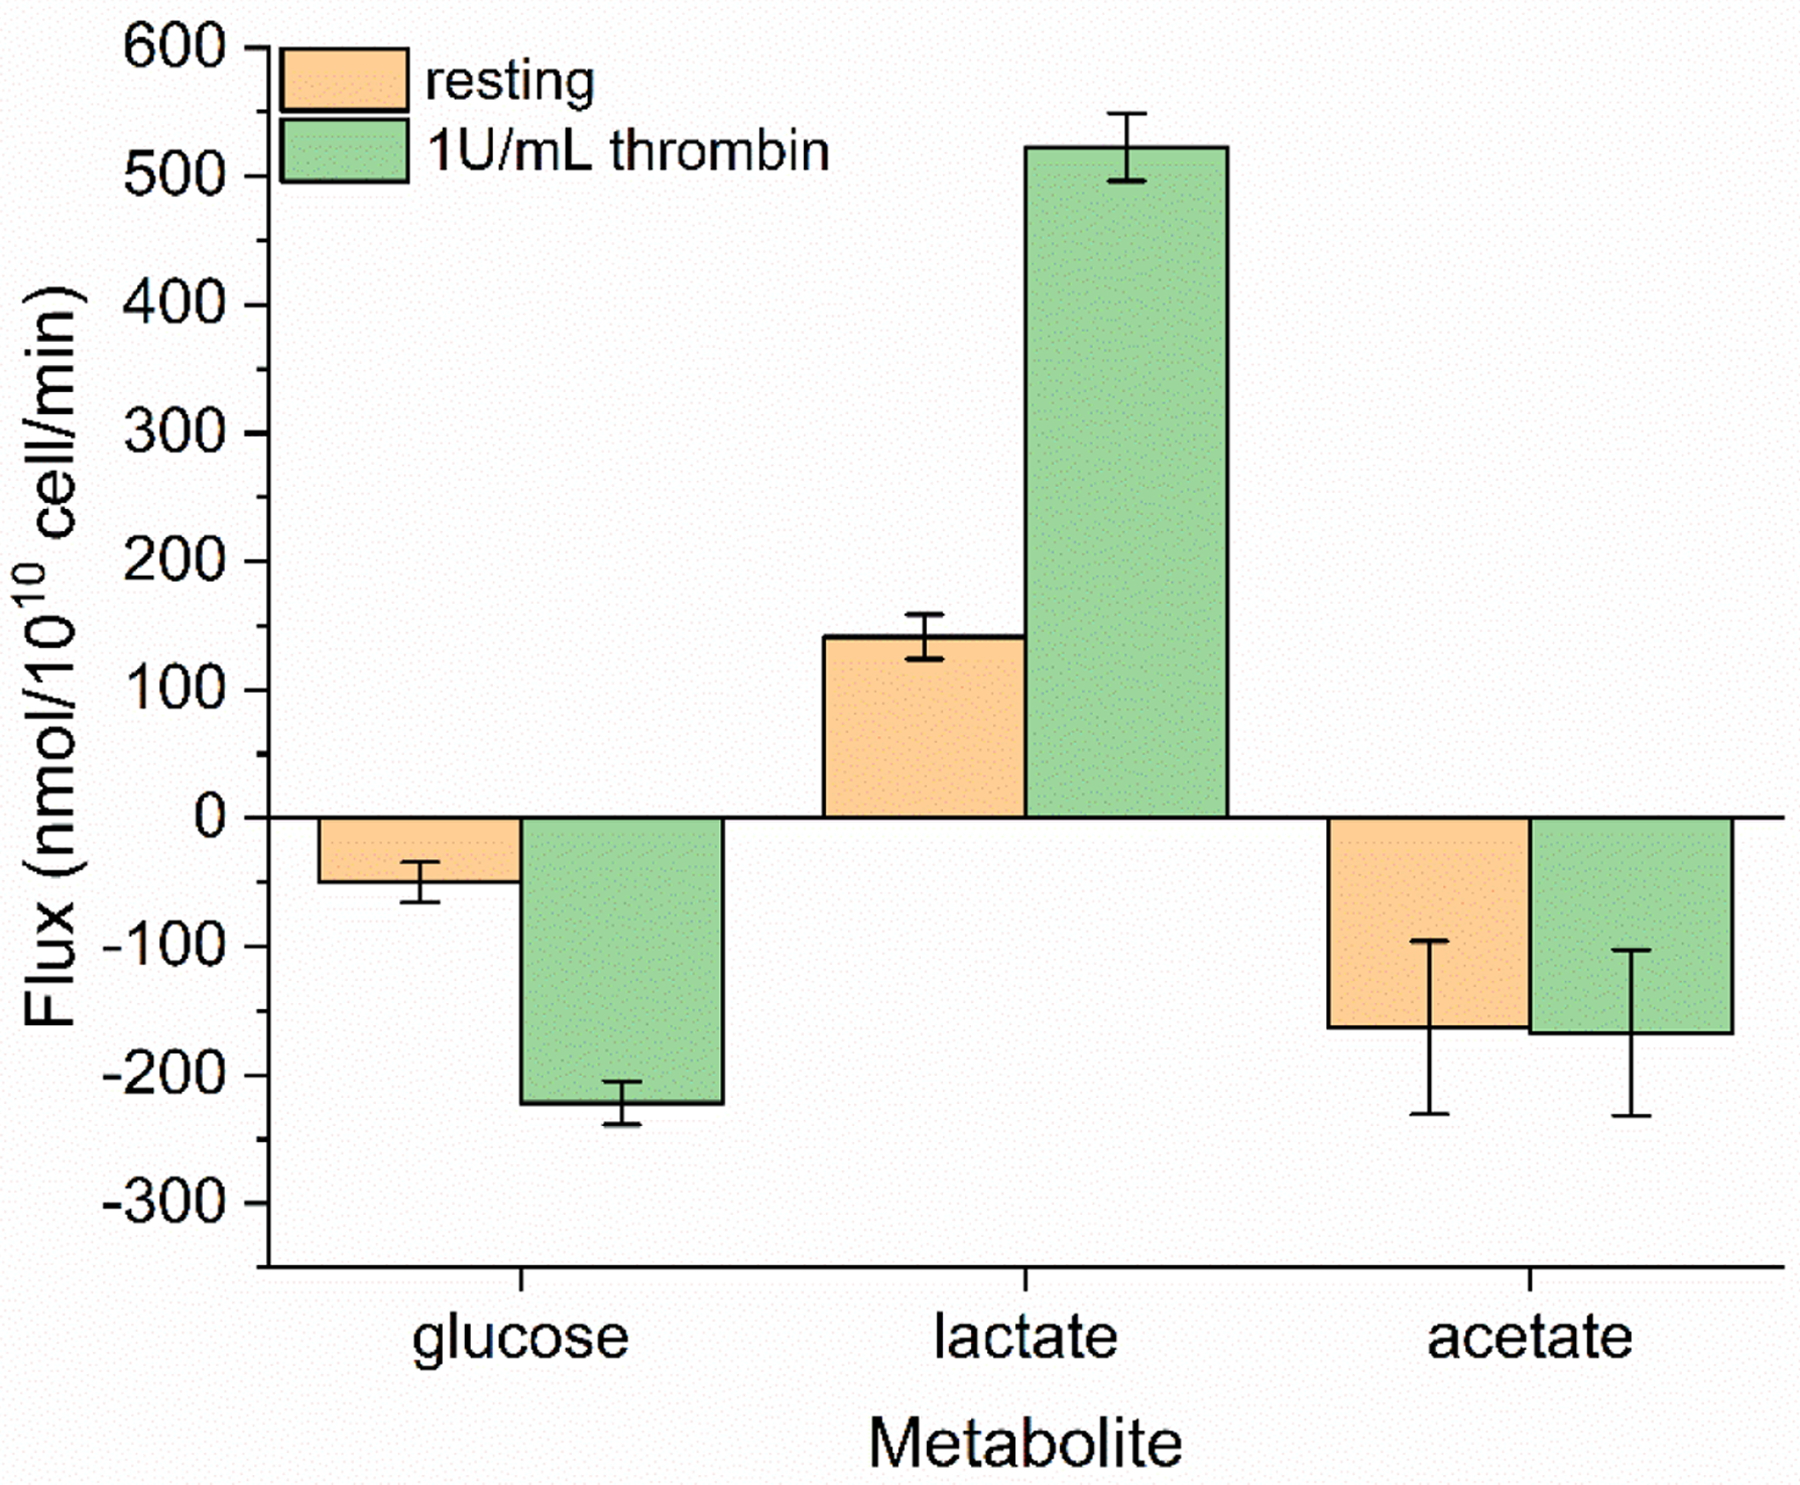
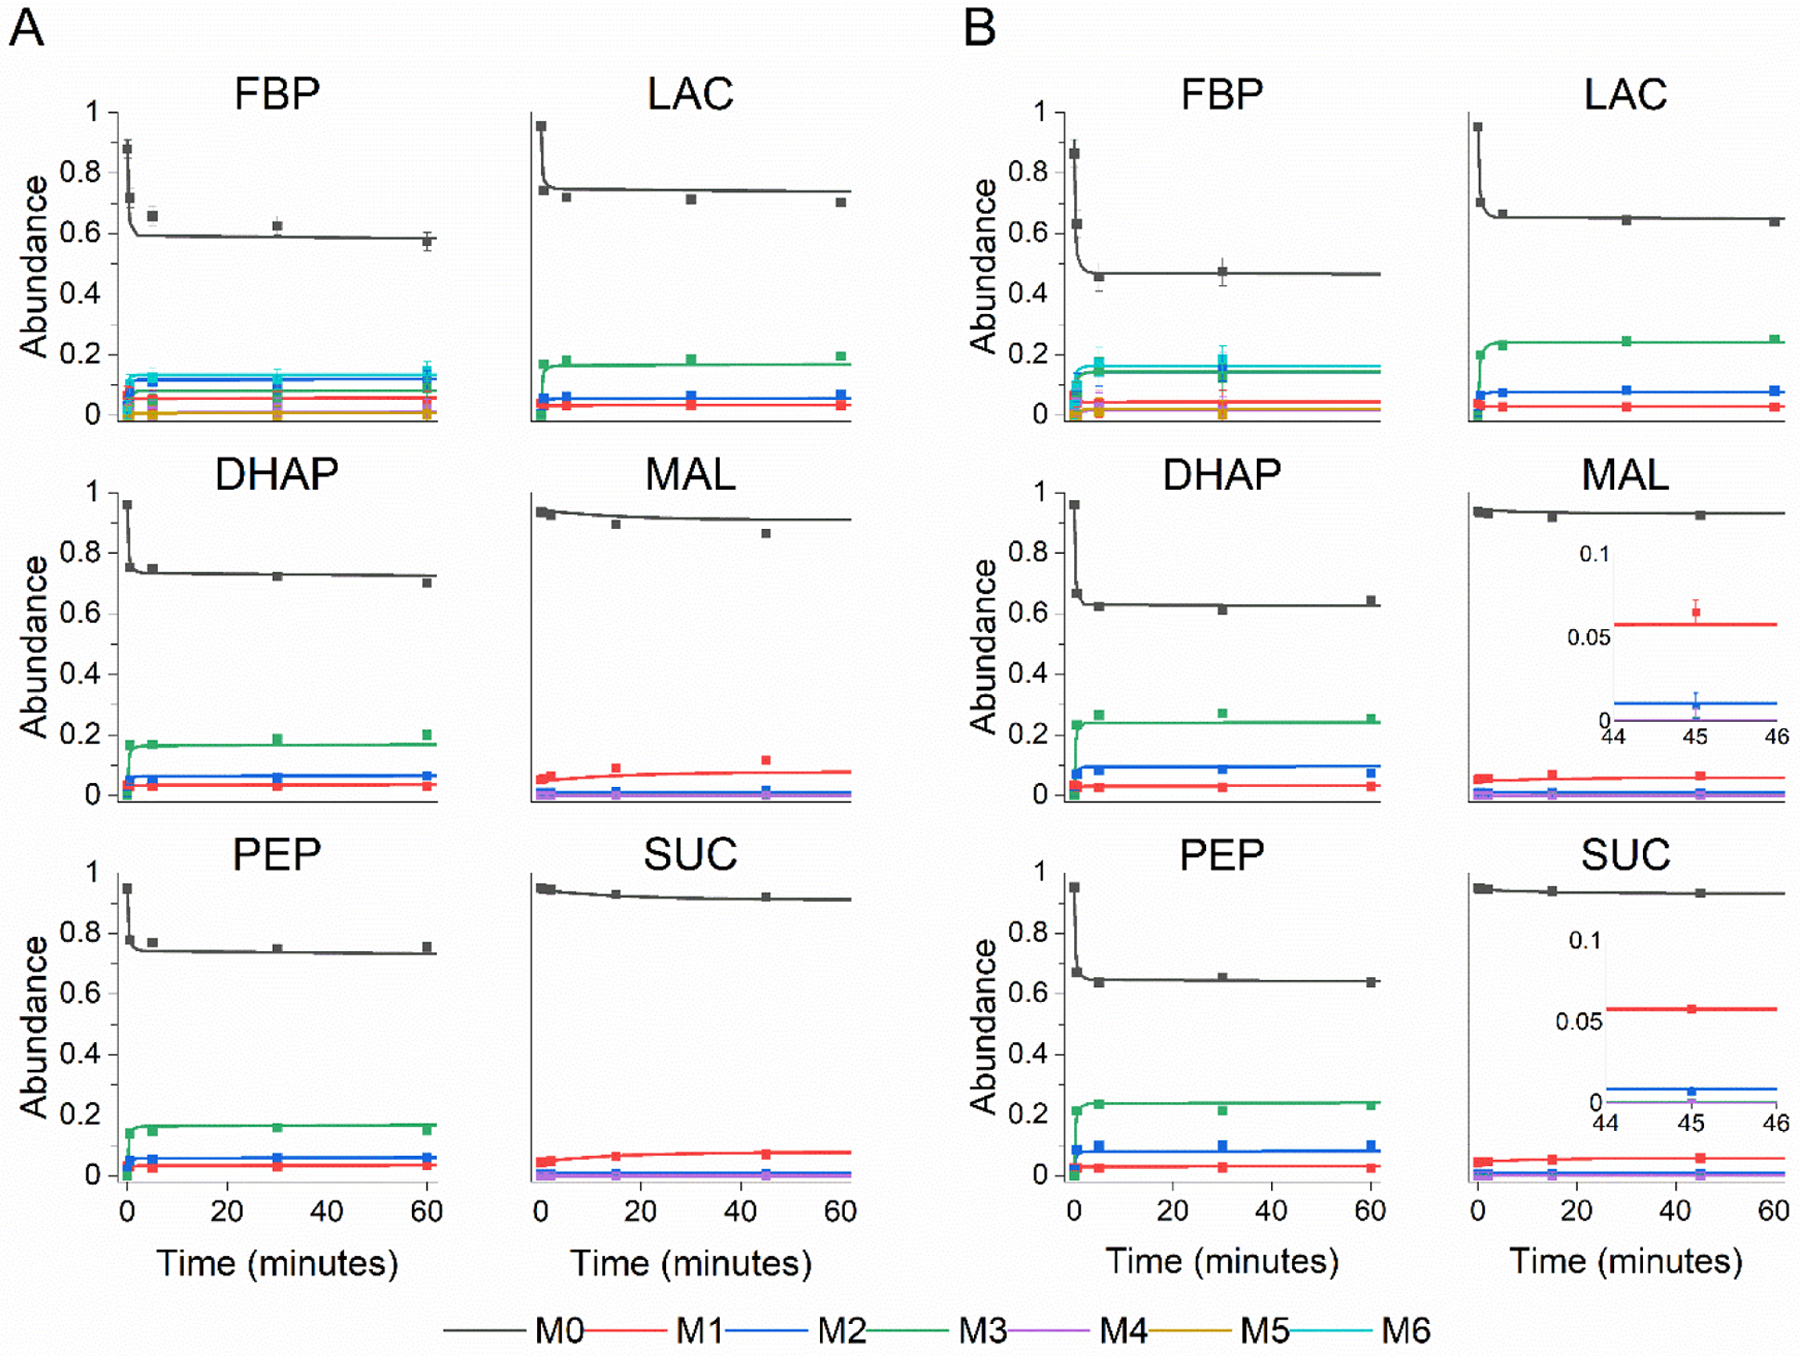
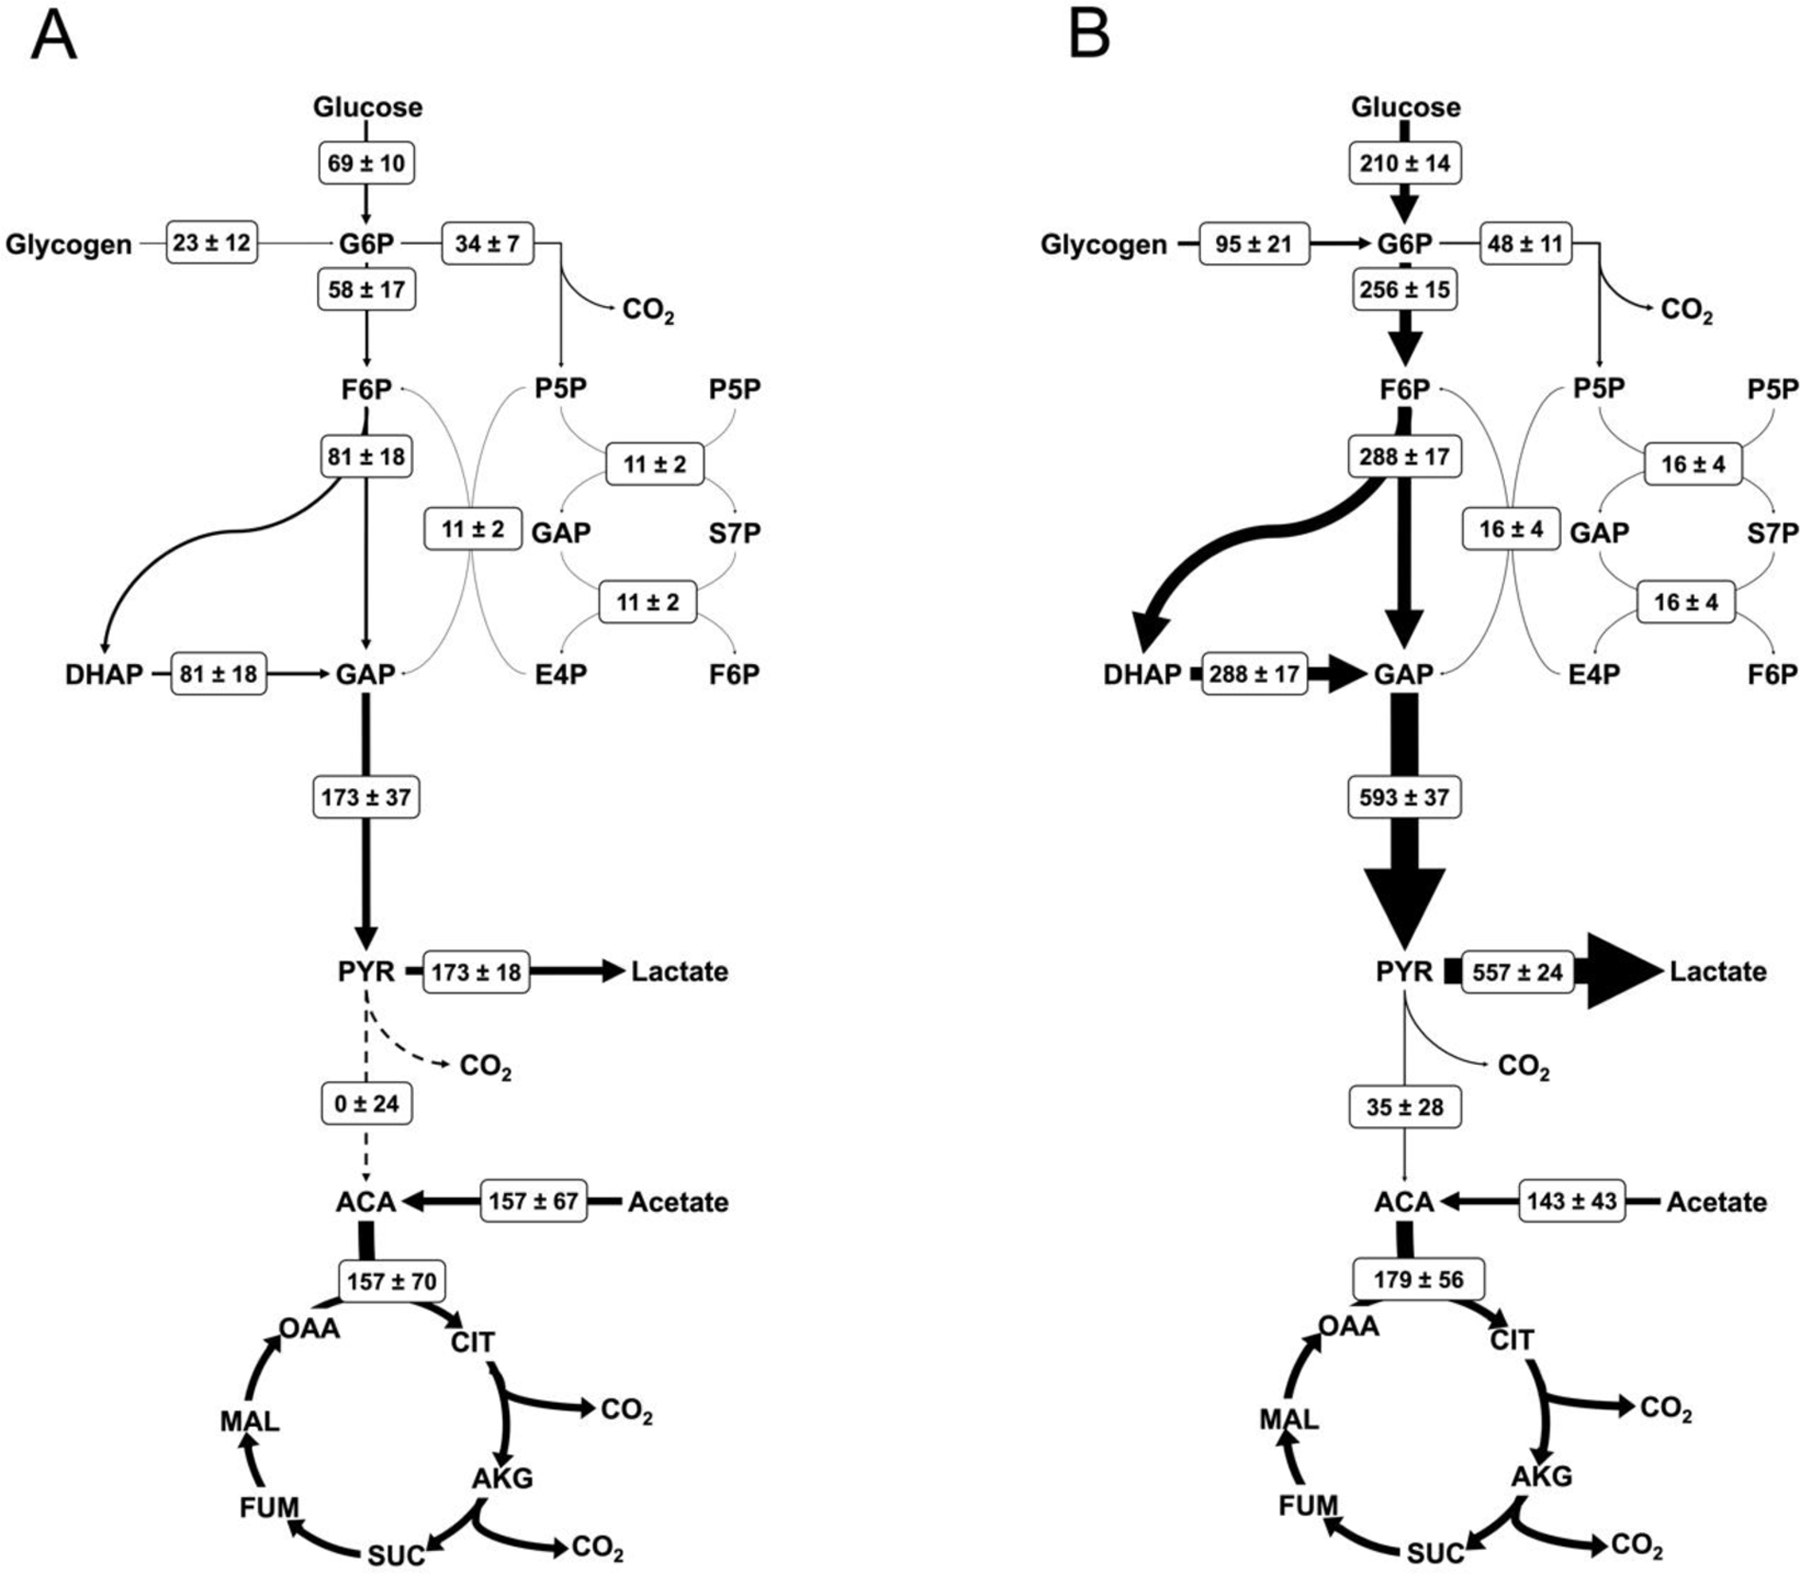
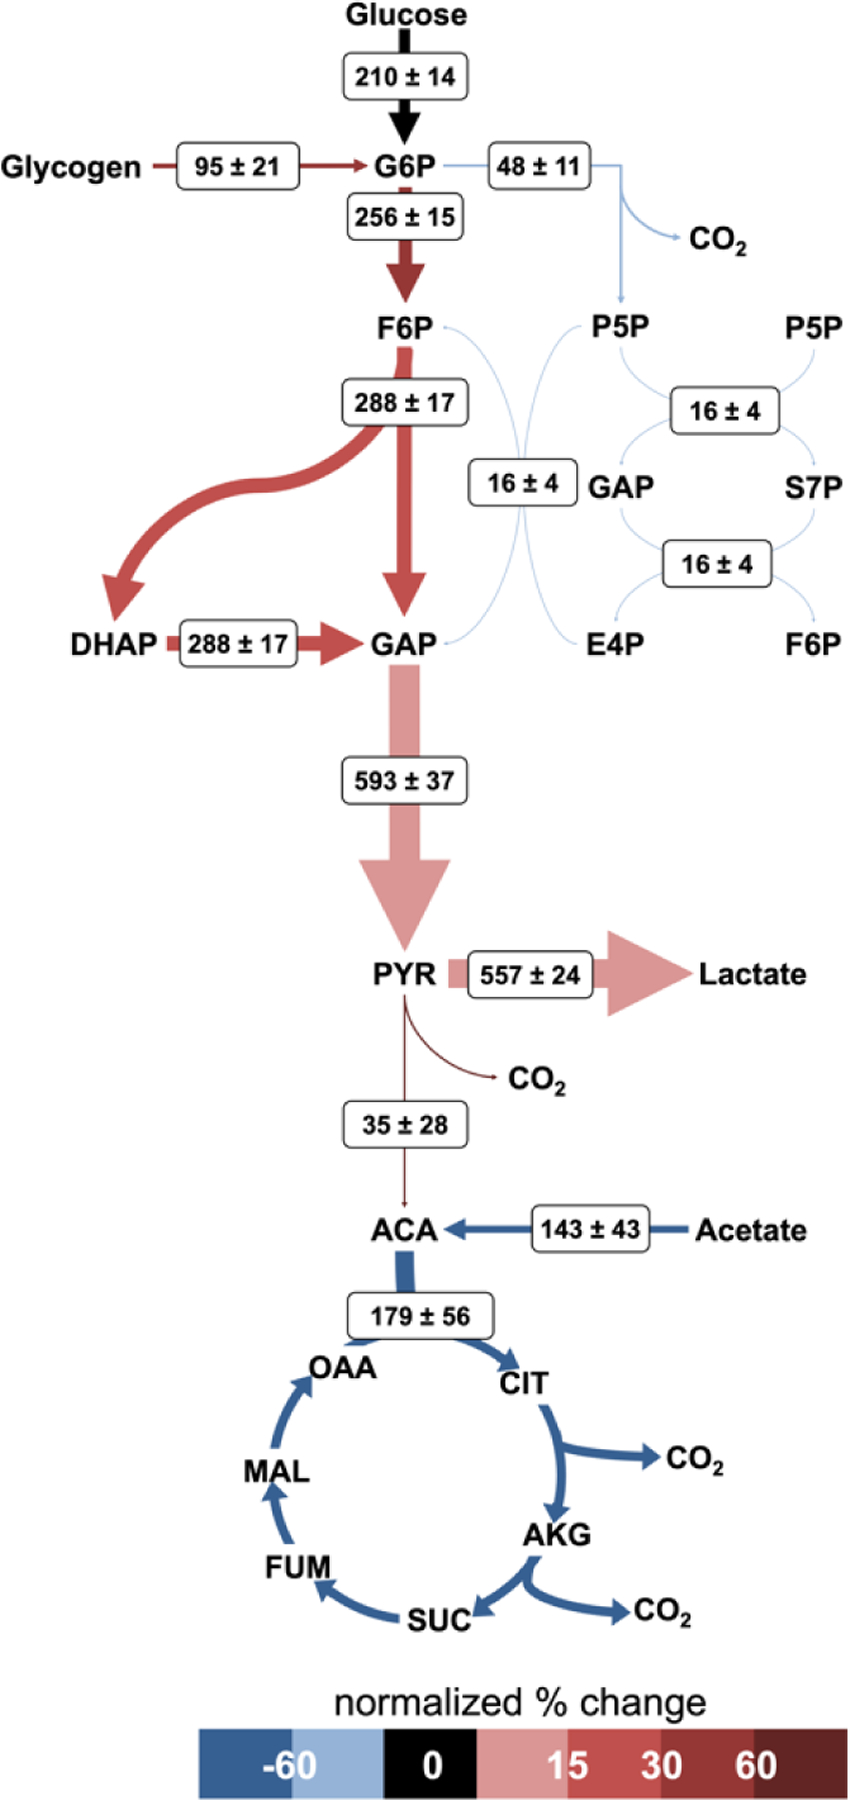
Platelet metabolism is linked to platelet hyper- and hypoactivity in numerous human diseases. Developing a detailed understanding of the link between metabolic shifts and platelet activation state is integral to improving human health. Here, we show the first application of isotopically nonstationary 13C metabolic flux analysis to quantitatively measure carbon fluxes in both resting and thrombin activated platelets. Metabolic flux analysis results show that resting platelets primarily metabolize glucose to lactate via glycolysis, while acetate is oxidized to fuel the tricarboxylic acid cycle. Upon activation with thrombin, a potent platelet agonist, platelets increase their uptake of glucose 3-fold. This results in an absolute increase in flux throughout central metabolism, but when compared to resting platelets they redistribute carbon dramatically. Activated platelets decrease relative flux to the oxidative pentose phosphate pathway and TCA cycle from glucose and increase relative flux to lactate. These results provide the first report of reaction-level carbon fluxes in platelets and allow us to distinguish metabolic fluxes with much higher resolution than previous studies.

Keywords: Blood platelets; Metabolic flux analysis; Metabolomics; Thrombin.


Conflict of interest statement

Declarations of interest: none.

Figures

Figure 1.
Figure 1.. Summary of the workflow for performing 13C-MFA in platelets.
Washed platelets isolated from whole blood are incubated with 13C-glucose or 13C-acetate and then rapidly sampled, quenched, and intracellular metabolites extracted. The metabolite profile is analyzed using LC-MS/MS to obtain mass isotopomer distributions (MIDs). The analytical data is then paired with the modeled reaction network and respective atom transitions; fluxes are determined through iterative parameter adjustment to minimize the error between the simulated and measured isotopomer profiles. Figure adapted from (Sake et al., 2019). [please use color for figure in print]
Figure 2.
Figure 2.. Platelet central metabolic network.
Reactions that are reversible are shown with two-headed arrows. Metabolic pathways are color coded to represent glycolysis (orange), pentose phosphate pathway (blue), and the tricarboxylic acid (TCA) cycle (green). [please use color for figure in print]
Figure 3.
Figure 3.. Metabolite pool size of representative metabolites over 60 minutes.
Pool size for (A) resting (vehicle = ethanol) and (B) thrombin activated (1 U/mL) platelets is represented by the sum of the MS signal for each metabolite’s isotopomer, displayed normalized to the mean at time = 0 min. Repeats at each time represent replicates from a single donor. See also Supplemental Fig. 2.
Figure 4.
Figure 4.. Measured uptake and excretion fluxes for resting (orange) and thrombin activated (green) platelets.
Glucose, lactate, and acetate fluxes are shown as negative for uptake/carbon source and positive for excretion/carbon sink. Extracellular metabolite concentration was measured from the reserved carbon labeling experiment supernatants. The reported flux represents the slope of a linear regression to the measured extracellular concentrations using a least squares method. Error bars represent standard error. [please use color for figure in print]
Figure 5.
Figure 5.. Experimentally measured mass isotopomer abundances (symbols) and INST-MFA model fits (lines).
Each panel shows the 13C labeling trajectories as fractional abundance of fructose bisphosphate (FBP), dihydroxyacetone phosphate (DHAP), phosphoenolpyruvate (PEP), lactate (LAC), malate (MAL), and succinate (SUC) for (A) resting and (B) thrombin activated platelets. Labeling for FBP, DHAP, PEP, and LAC originate from the glucose tracer and labeling for MAL and SUC come from the acetate tracer. Raw mass isotopomer abundances are shown without correction for natural abundance. Error bars represent standard measurement error. [please use color for figure in print]
Figure 6.
Figure 6.. Flux maps of platelet metabolism.
Net fluxes are shown for (A) resting and (B) thrombin activated conditions in the form M±SE where M is the calculated flux and SE is the standard error of the 95% confidence interval between upper and lower bounds with units of nmol/1010 platelets/min. Arrow thickness is linearly proportional to the net flux, with dashed lines representing zero net flux. All calculated net fluxes and their 95% confidence interval are listed in Supplemental Table 1.
Figure 7.
Figure 7.. Normalized fluxes of activated platelet metabolism.
Net fluxes and arrow thicknesses are shown as previously described for Fig 6. Arrow color represents the percent change of the thrombin condition normalized flux from the resting condition normalized flux. Fluxes are normalized to the total glucose uptake rate. [please use color for figure in print]

References

    1. Abonnenc M, Crettaz D, Marvin L, Grund B, Sonego G, Bardyn M, Tissot J-D, Prudent M, Rochat B, Lion N, 2016. Metabolomic profiling highlights oxidative damages in platelet concentrates treated for pathogen inactivation and shows protective role of urate. Metabolomics 12.
    1. Ahn WS, Antoniewicz MR, 2013. Parallel labeling experiments with [1,2-(13)C]glucose and [U-(13)C]glutamine provide new insights into CHO cell metabolism. Metab Eng 15, 34–47. - PubMed
    1. Aibibula M, Naseem KM, Sturmey RG, 2018. Glucose metabolism and metabolic flexibility in blood platelets. J Thromb Haemost 16, 2300–2314. - PubMed
    1. Antoniewicz MR, 2013. Dynamic metabolic flux analysis--tools for probing transient states of metabolic networks. Curr Opin Biotechnol 24, 973–8. - PubMed
    1. Antoniewicz MR, 2015. Methods and advances in metabolic flux analysis: a mini-review. J Ind Microbiol Biotechnol 42, 317–325. - PubMed

Publication types

LinkOut - more resources