. 2022 Mar 15:812:152592.
doi: 10.1016/j.scitotenv.2021.152592. Epub 2021 Dec 23.

A spatiotemporally resolved infection risk model for airborne transmission of COVID-19 variants in indoor spaces

Affiliations

A spatiotemporally resolved infection risk model for airborne transmission of COVID-19 variants in indoor spaces

Xiangdong Li et al. Sci Total Environ. .

Abstract

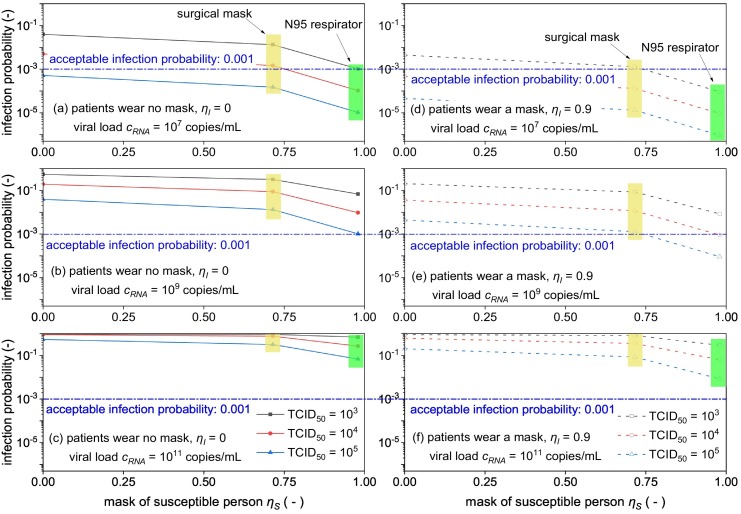
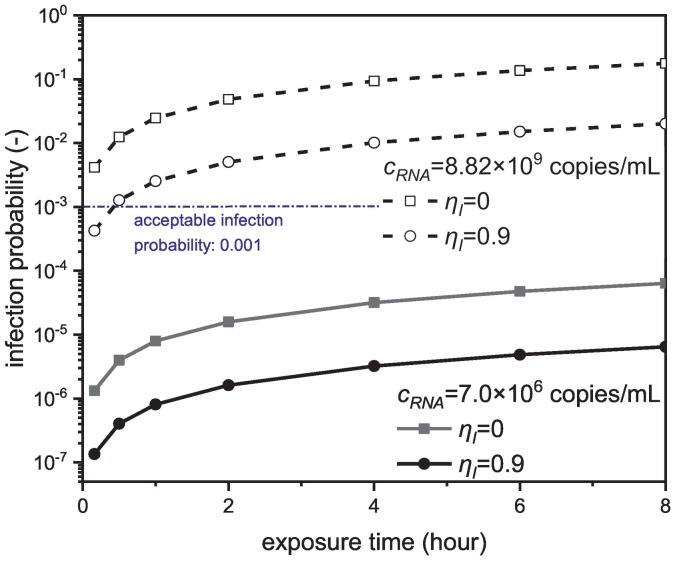
The classic Wells-Riley model is widely used for estimation of the transmission risk of airborne pathogens in indoor spaces. However, the predictive capability of this zero-dimensional model is limited as it does not resolve the highly heterogeneous spatiotemporal distribution of airborne pathogens, and the infection risk is poorly quantified for many pathogens. In this study we address these shortcomings by developing a novel spatiotemporally resolved Wells-Riley model for prediction of the transmission risk of different COVID-19 variants in indoor environments. This modelling framework properly accounts for airborne infection risk by incorporating the latest clinical data regarding viral shedding by COVID-19 patients and SARS-CoV-2 infecting human cells. The spatiotemporal distribution of airborne pathogens is determined via computational fluid dynamics (CFD) simulations of airflow and aerosol transport, leading to an integrated model of infection risk associated with the exposure to SARS-CoV-2, which can produce quantitative 3D infection risk map for a specific SARS-CoV-2 variant in a given indoor space. Application of this model to airborne COVID-19 transmission within a hospital ward demonstrates the impact of different virus variants and respiratory PPE upon transmission risk. With the emergence of highly contagious SARS-CoV-2 variants such as the Delta and Omicron strains, respiratory PPE alone may not provide effective protection. These findings suggest a combination of optimal ventilation and respiratory PPE must be developed to effectively control the transmission of COVID-19 in healthcare settings and indoor spaces in general. This generalised risk estimation framework has the flexibility to incorporate further clinical data as such becomes available, and can be readily applied to consider a wide range of factors that impact transmission risk, including location and movement of infectious persons, virus variant and stage of infection, level of PPE and vaccination of infectious and susceptible individuals, impacts of coughing, sneezing, talking and breathing, and natural and mechanised ventilation and filtration.

Keywords: Covid-19; Delta variant; SARS-CoV-2; Spatiotemporal infection risk; Wells-Riley model.


Conflict of interest statement

Declaration of competing interest The authors declare that they have no known competing financial interests or personal relationships that could have appeared to influence the work reported in this paper.

Figures

Unlabelled Image
Graphical abstract
Fig. 1
Fig. 1
Size distribution of human respiratory droplets (data from (Chao et al., 2009) and (Li et al., 2018)).
Fig. 2
Fig. 2
Comparison of two-phase flow models against experimental data.
Fig. 3
Fig. 3
CAD model of the hospital ward (the ward includes 4 single-bed patient rooms, a nurse station and workroom).
Fig. 4
Fig. 4
The computational domains for (a) patient room 3 and (b) the main ward area (the orange arrows point to the gaps in the door leading to air leakage, all other flow enters or leaves the room through the supply air (blue arrow) and return air (red arrow)). (For interpretation of the references to color in this figure legend, the reader is referred to the web version of this article.)
Fig. 5
Fig. 5
Trajectories of different sized aerosol particles computed from a single exhalation event under the Lagrangian model.
Fig. 6
Fig. 6
Number and mass fraction probability distributions of dehydrated aerosol particles.
Fig. 7
Fig. 7
Comparison of (a), (b) particles in the air and (c), (d) particle deposition pattern for the Lagrangian and algebraic slip models respectively. Note that (a) shows the particle traveling time and (b) shows the particle concentration field. (c) and (d) show the particle deposition rate. The figure shows a properly selected representative particle size is able to achieve a satisfactory prediction.
Fig. 8
Fig. 8
Effects of the TCID50 on the infection risk (ηI = 0, ηS = 0.715, cRNA = 2.35 × 109 copies/mL, HID50 = 5 × TCID50, te = 3600 s. Nose height taken as H = 1.65 m). The results show when other conditions remain unchanged, the infection risk quickly increases as the TCID50 unit decreases.
Fig. 9
Fig. 9
Effects of the viral load on the infection risk (ηI = 0, ηS = 0.715, TCID50 = 104 virions, te = 3600 s). The results show that viral load is another important variable affecting the transmissibility of the virus.
Fig. 10
Fig. 10
Infection risk as a function of viral load and TCID50 value for 1 h exposure in patient room 3 (ηI = 0, ηS = 0.715, te = 3600 s). On average, the Delta variant is predicted to be around 200 times more contagious than the original variants.
Fig. 11
Fig. 11
Effects of PPE on infection risk (cRNA = 8.82 × 109 copies/mL, TCID50 = 4000 virions, te = 3600 s). The results clearly demonstrate the benefits for both the infected and susceptible persons to wearing a mask.
Fig. 12
Fig. 12
Effects of respiratory PPE (HID50 = 5 × TCID50 = 20,000 virions, te = 3600 s). The results suggest that respiratory PPE can provide good protection when the viral load is low. However, additional protections are needed if the viral load is high.
Fig. 13
Fig. 13
CFD results of the common ward area (TCID50 = 4000 virions, cRNA = 8.82 × 109 copies/mL, te = 8 h, ηI = 0.9, ηS = 0.98). The computations show highly heterogeneous distributions of aerosol and infection risk in the ward. (a) Air flow field at H = 1.65 m. (b) Particle concentration field. (c) Spatial distribution of infection risk.
Fig. 14
Fig. 14
Effects of viral load and exposure time on the infection probability (ηS = 0.98) outside the patient rooms at a noise height of H = 1.65 m.

References

    1. ANSI . vol. 55. American Society of Heating, Refrigerating and Air-Conditioning Engineers; 2004. Thermal Environmental Conditions for Human Occupancy.
    1. Bar-On Y.M., Flamholz A., Phillips R., Milo R. SARS-CoV-2 (COVID-19) by the numbers. eLife. 2020;9 - PMC - PubMed
    1. Carroll R.G. In: Elsevier's Integrated Physiology. Carroll R.G., editor. Mosby; Philadelphia: 2007. 10 - pulmonary system; pp. 99–115.
    1. Chao C.Y.H., Wan M.P., Morawska L., Johnson G.R., Ristovski Z.D., Hargreaves M., et al. Characterization of expiration air jets and droplet size distributions immediately at the mouth opening. J. Aerosol Sci. 2009;40:122–133. - PMC - PubMed
    1. Chen F., Yu S.C.M., Lai A.C.K. Modeling particle distribution and deposition in indoor environments with a new drift–flux model. Atmos. Environ. 2006;40:357–367.

Supplementary concepts