. 2022;13(4):1276-1296.
doi: 10.1016/j.jcmgh.2021.12.014. Epub 2021 Dec 22.

A β-Catenin-TCF-Sensitive Locus Control Region Mediates GUCY2C Ligand Loss in Colorectal Cancer

Affiliations

A β-Catenin-TCF-Sensitive Locus Control Region Mediates GUCY2C Ligand Loss in Colorectal Cancer

Jeffrey A Rappaport et al. Cell Mol Gastroenterol Hepatol. 2022.

Abstract

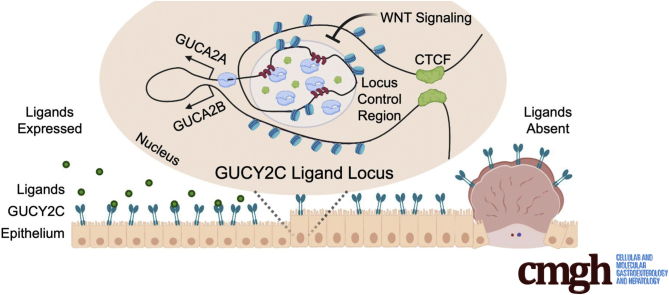
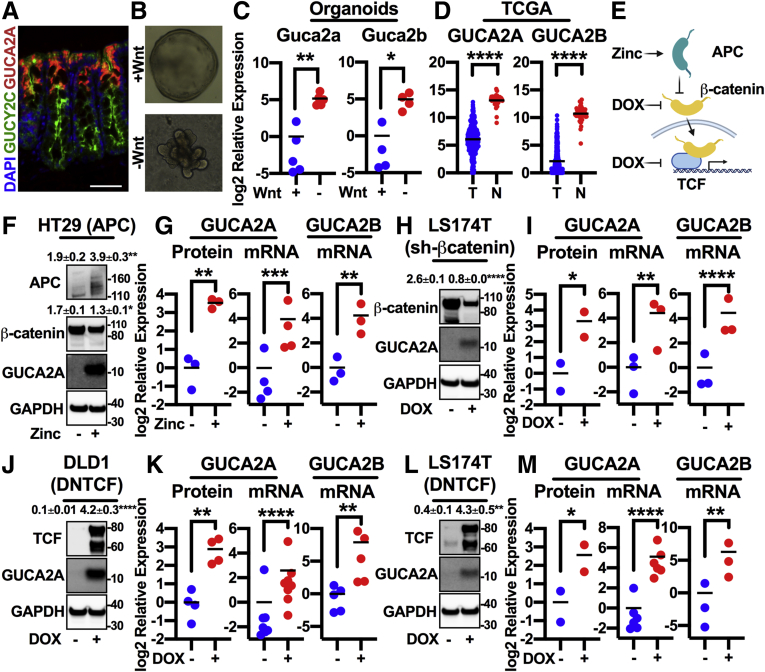
Background & aims: Sporadic colorectal cancers arise from initiating mutations in APC, producing oncogenic β-catenin/TCF-dependent transcriptional reprogramming. Similarly, the tumor suppressor axis regulated by the intestinal epithelial receptor GUCY2C is among the earliest pathways silenced in tumorigenesis. Retention of the receptor, but loss of its paracrine ligands, guanylin and uroguanylin, is an evolutionarily conserved feature of colorectal tumors, arising in the earliest dysplastic lesions. Here, we examined a mechanism of GUCY2C ligand transcriptional silencing by β-catenin/TCF signaling.

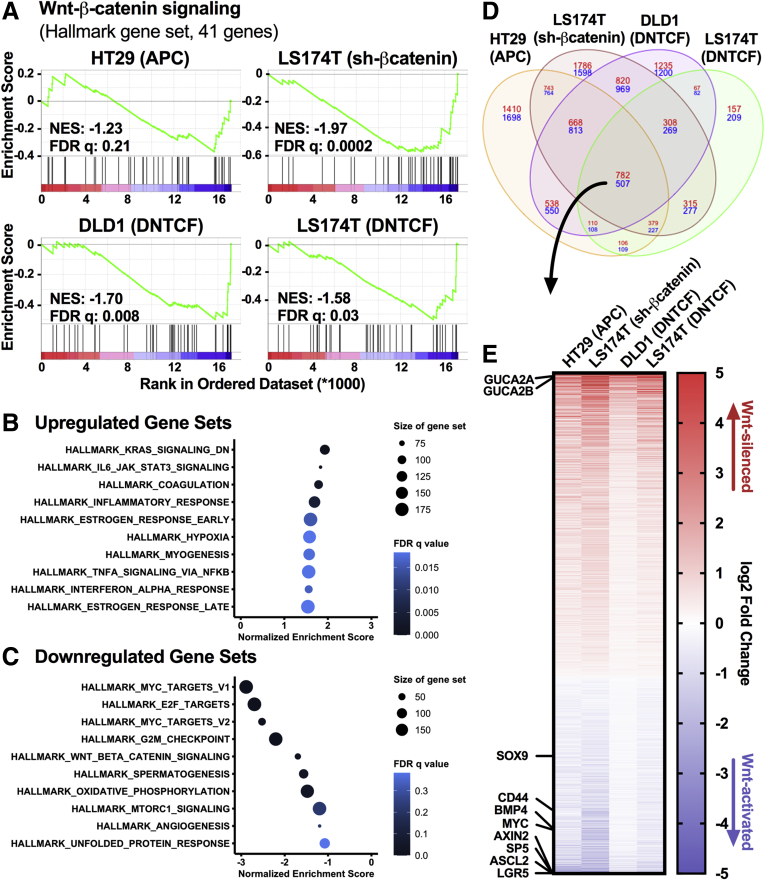
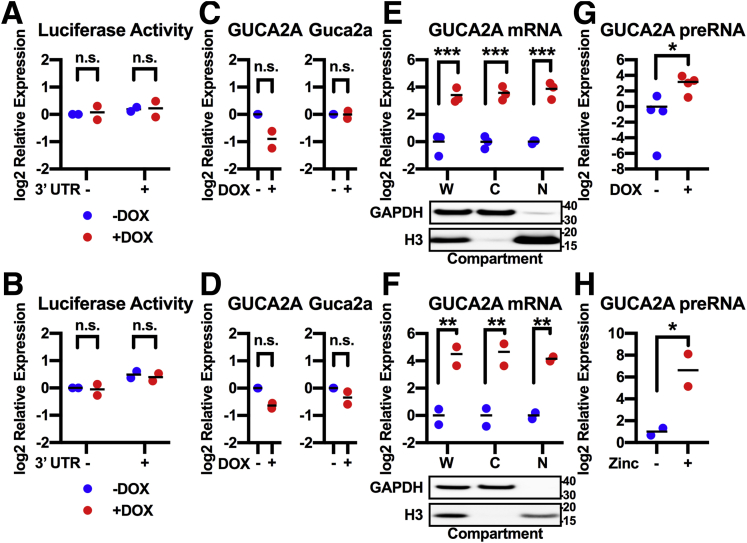
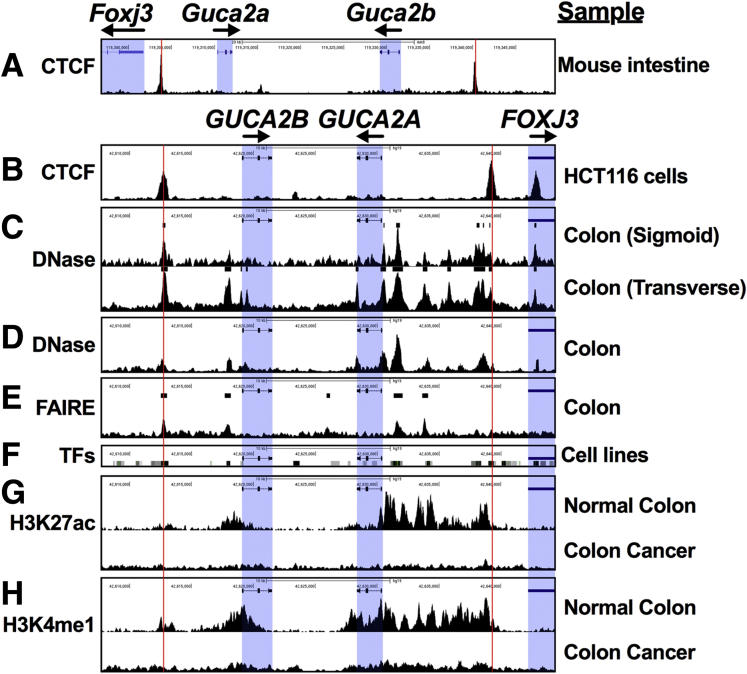
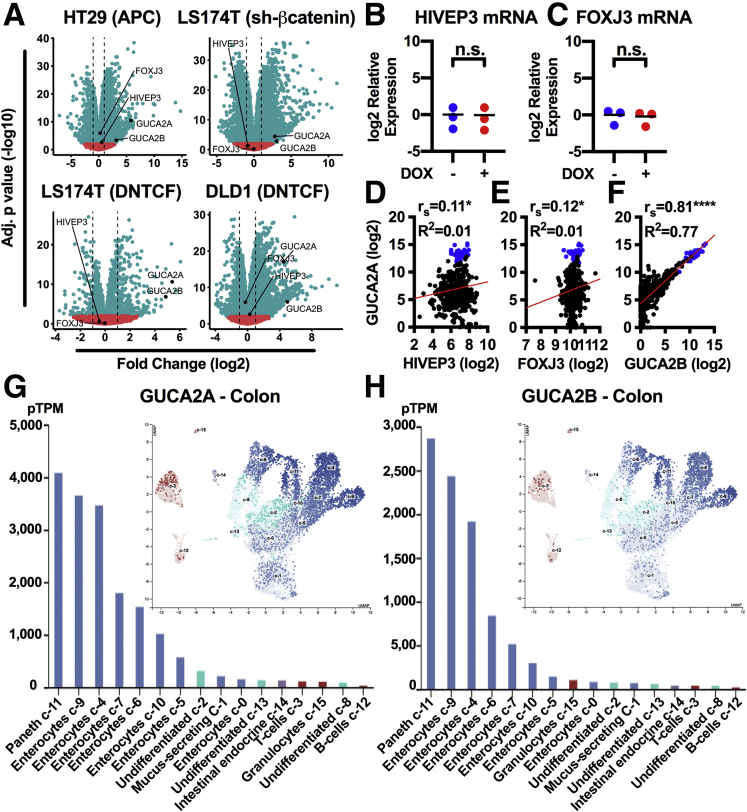
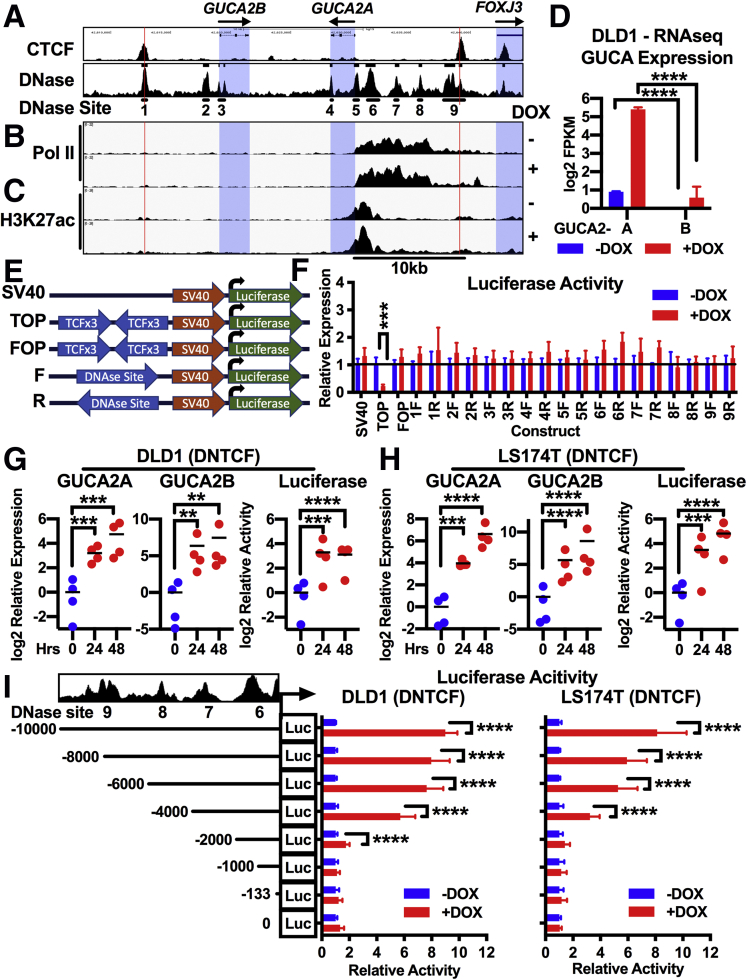
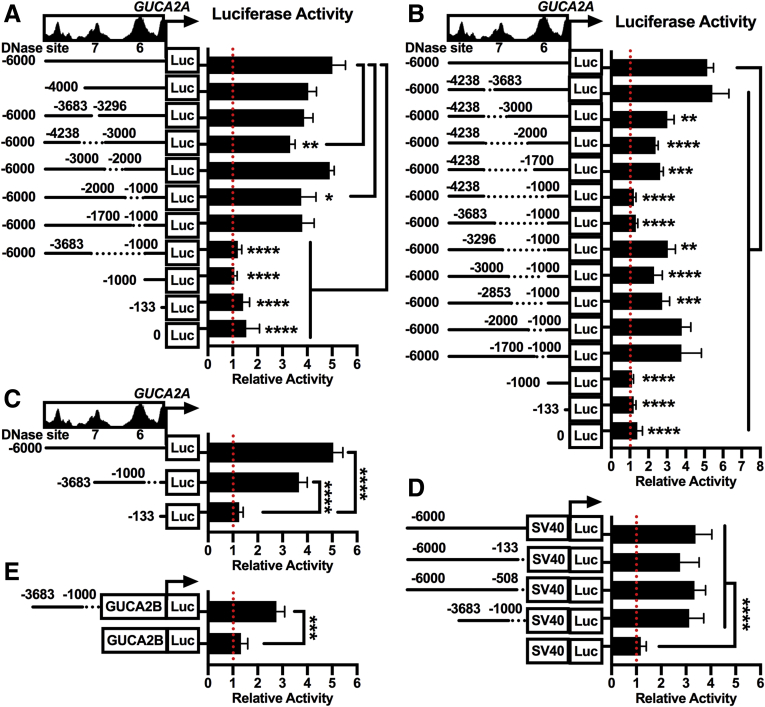
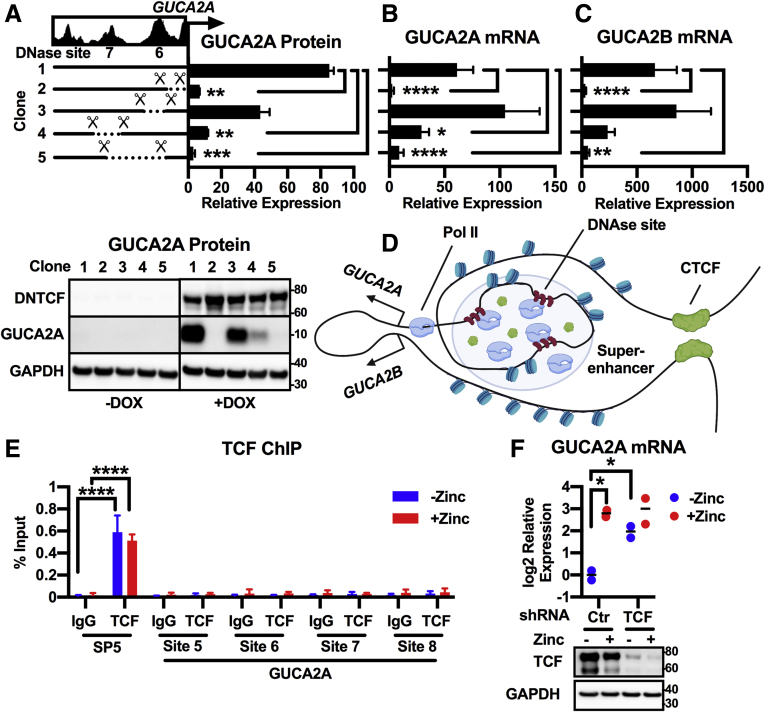
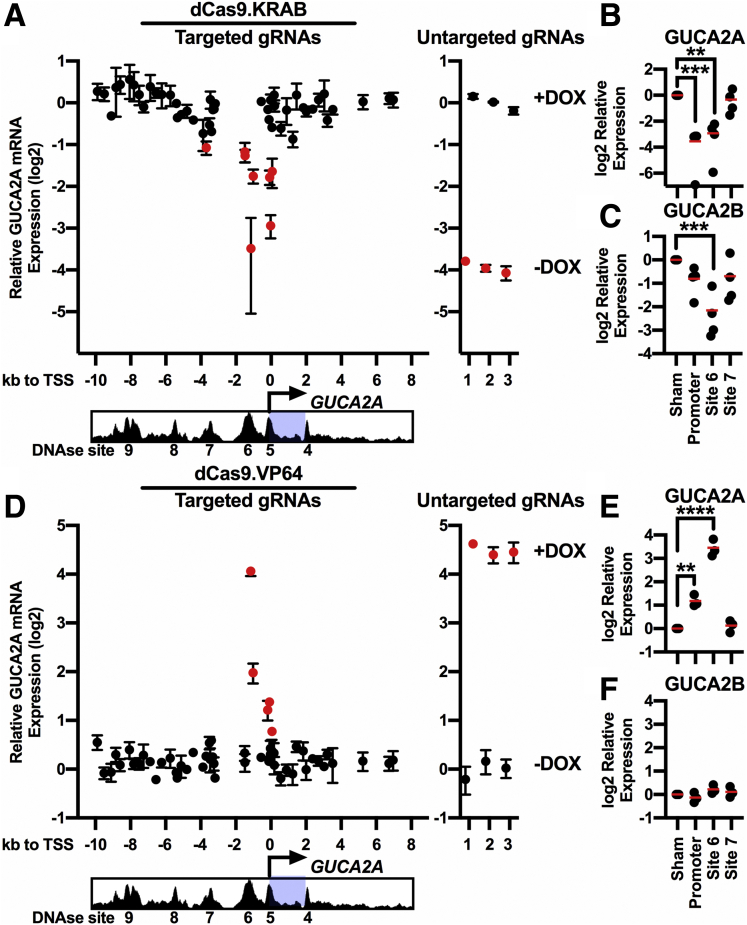
Methods: We performed RNA sequencing analysis of 4 unique conditional human colon cancer cell models of β-catenin/TCF signaling to map the core Wnt-transcriptional program. We then performed a comparative analysis of orthogonal approaches, including luciferase reporters, chromatin immunoprecipitation sequencing, CRISPR/Cas9 (clustered regularly interspaced short palindromic repeats) knockout, and CRISPR epigenome editing, which were cross-validated with human tissue chromatin immunoprecipitation sequencing datasets, to identify functional gene enhancers mediating GUCY2C ligand loss.

Results: RNA sequencing analyses reveal the GUCY2C hormones as 2 of the most sensitive targets of β-catenin/TCF signaling, reflecting transcriptional repression. The GUCY2C hormones share an insulated genomic locus containing a novel locus control region upstream of the guanylin promoter that mediates the coordinated silencing of both genes. Targeting this region with CRISPR epigenome editing reconstituted GUCY2C ligand expression, overcoming gene inactivation by mutant β-catenin/TCF signaling.

Conclusions: These studies reveal DNA elements regulating corepression of GUCY2C ligand transcription by β-catenin/TCF signaling, reflecting a novel pathophysiological step in tumorigenesis. They offer unique genomic strategies that could reestablish hormone expression in the context of canonical oncogenic mutations to reconstitute the GUCY2C axis and oppose transformation.

Keywords: Guanylin; Wnt signaling; super-enhancer; uroguanylin.


Figures

None
Graphical abstract
Figure 1
Figure 1
Wnt signaling silences GUCY2C ligand expression. (A) Immunofluorescence of GUCA2A (red), GUCY2C (green), and nuclei (blue) in mouse colon crypts. (B) Mouse colon organoids cultured in the presence (+) or absence (–) of Wnt3a, and (C) corresponding Guca2a and Guca2b mRNA. (D) GUCA2A and GUCA2B mRNA quantified by RNA-seq from human colorectal tumor (T) (n = 380) and normal (N) (n = 51) tissue from TCGA (COAD/READ datasets). (E) Colon cancer cells express 1 of 3 inducible inhibitors of Wnt signaling: zinc-inducible wild-type APC (HT29 cells), DOX-inducible β-catenin shRNA (LS174T cells), or DOX-inducible dominant negative TCF7L2 (DNTCF; DLD1 and LS174T cells). (F, G) HT29(APC) cells treated with 300 μM zinc for 24 hours express APC, resulting in loss of β-catenin and upregulation of GUCA2A protein, GUCA2A mRNA, and GUCA2B mRNA. (H, I) LS174T(shβ-catenin) cells treated with 1 μg/mL DOX for 72 hours lose β-catenin and upregulate GUCA2A protein, GUCA2A mRNA, and GUCA2B mRNA. (J, K) DLD1(DNTCF) cells treated with 1 μg/mL DOX for 24 hours express DNTCF, upregulating GUCA2A protein, GUCA2A mRNA, and GUCA2B mRNA. (L, M) LS174T(DNTCF) cells treated with 1 μg/mL DOX for 48 hours express DNTCF, upregulating GUCA2A protein, GUCA2A mRNA, and GUCA2B mRNA. (C, FM) Data points represent the average of 3 wells of cells from a single experiment, with the mean of 2–8 independent experiments indicated. Significance was determined by Student’s t test with matched analysis for independent experiments on log2-transformed results. Data are presented relative to noninduced cells. ∗P < .05; ∗∗P < .01; ∗∗∗P < .001; ∗∗∗∗P < .0001.
Figure 2
Figure 2
The GUCY2C ligands are among the most sensitive targets of β-catenin/TCF signaling. HT29(APC) cells were treated with 300 μM zinc for 24 hours, LS174T(shβ-catenin) cells were treated with 1 μg/mL DOX for 72 hours, DLD1(DNTCF) cells were treated with 1 μg/mL DOX for 24 hours, and LS174T(DNTCF) cells were treated with 1 μg/mL DOX for 48 hours. RNA-seq and differential gene expression analysis was performed in cells treated with or without the respective inducing agent. Unbiased gene set enrichment analysis on each cell line compared the ranked log fold change of 17,229 genes to the 50 hallmark gene sets maintained by the Molecular Signatures Database (MSigDB). (A) The Wnt-β-catenin signaling gene set enrichment plot for each cell line, with the corresponding normalized enrichment score and false discovery rate (FDR) q value. (B, C) The top 10 upregulated and downregulated gene sets for DLD1(DNTCF) cells, ranked by normalized enrichment score. Color indicates FDR q value, and size of the data points indicates the number of genes in each gene set. (D) Differential gene expression in the 4 cell lines by RNA-seq reveals 782 upregulated (red) and 507 downregulated (blue) genes upon silencing Wnt signaling. (E) Heatmap of the 1289 differentially expressed genes ranked by log2 fold change. GUCA2A and GUCA2B are the 7th and 12th most upregulated transcripts. RNA-seq results represent the average of 3 replicates.
Figure 3
Figure 3
β-catenin-TCF signaling regulates GUCA2A nuclear transcription. (A, B) Luciferase constructs driven by a constitutive (SV40) promoter and containing the guanylin 3′ UTR or no 3′ UTR, were expressed in (A) DLD1(DNTCF) or (B) LS174T(DNTCF) cells. Luciferase was quantified with (+) or without (–) 1 μg/mL DOX for 24 hours in DLD1 cells or 48 hours in LS174T cells. (C, D) Expression constructs containing the entire human GUCA2A gene from 5′ to 3′ UTR, or the entire murine Guca2a gene under the control of a constitutive (ROSA) promoter were expressed in (C) DLD1(DNTCF) or (D) LS174T(DNTCF) cells. mRNA was quantified with (+) or without (–) 1 μg/mL DOX for 24 hours in DLD1 cells, or 48 hours in LS174T cells. (E) DLD1(DNTCF) cells were treated with 1 μg/mL DOX for 24 hours and (F) HT29(APC) cells were treated with 300 μM zinc for 24 hours. GUCA2A mRNA was quantified in whole cell (W), cytoplasmic (C), or nuclear (N) fractions, with fractionation confirmed by GAPDH (cytoplasmic) or histone H3 (nuclear) protein. (G, H) GUCA2A preRNA was quantified in the (G) DLD1 and (H) HT29 whole cell fractions. (A-H) Data points represent the average of 3 wells of cells from a single experiment, with the mean of 2–4 independent experiments indicated. Significance was determined by (A, B, E, F) 2-way analysis of variance or (C, D, G, H) Student’s t test with matched analysis for independent experiments on log2-transformed results. No significance was identified between any group in individual or combined experiments in A–D. Data are presented relative to noninduced cells. ∗P < .05; ∗∗P < .01; ∗∗∗P < .001.
Figure 4
Figure 4
Regulatory elements in the GUCA locus are silenced in colorectal cancer. Public datasets reveal regulatory features in the GUCA2A locus. (A) CTCF ChIP-seq from mouse intestinal epithelial cells (GSE98724; mm9, chr4:119,296,885–119,349,526). (B) CTCF ChIP-seq from human HCT116 colon cancer cells (GSE92879; hg19, chr1:42,607,745–42,644,356). (C) DNase-seq from sigmoid (top; GSE90366) and transverse colon (bottom; GSE90398). (D) DNase-seq from normal colon crypts (GSE77737). (E) Formaldehyde-assisted identification of regulatory elements (FAIRE) sequencing from normal colon (GSE94935). (F) Clusters of transcription factor density, representing ChIP-seq of 338 factors in 130 cell types (UCSC Genome Browser, ENCODE Transcription Factor Binding track). (G) H3K27ac ChIP-seq and (H) H3K4me1 ChIP-seq identified poised enhancers in normal colon (top) but not in colon cancer (bottom) (GSE77737). Red lines denote CTCF binding sites. Blue boxes denote gene bodies. Sequencing datasets were obtained from NCBI Gene Expression Omnibus and visualized in the UCSC genome browser.
Figure 5
Figure 5
Transcriptional coregulation of GUCA2A and GUCA2B within an insulated domain sensitive to Wnt signaling. (A) RNA-seq volcano plots illustrate the fold change of 17,229 genes upon silencing Wnt signaling in the 4 inducible cell lines, with GUCA2A, GUCA2B, HIVEP3, and FOXJ3 indicated. Each gene is represented as a data point, dotted lines denote 2-fold change, and significance is indicated in red (P > .01) or blue (P ≤ .01). (B-C) qRTPCR of (B) HIVEP3 and (C) FOXJ3 in DLD1(DNTCF) cells treated with (+) or without (–) 1 μg/mL DOX for 24 hours. (D–F) GUCA2A mRNA compared with that of (D) HIVEP3, (E) FOXJ3, or (F) GUCA2B, quantified by RNA-seq from human colorectal tumor (n = 380; black) and normal (n = 51; blue) tissue from TCGA (COAD/READ datasets). Significance was determined by 2-tailed Spearman rank correlation (rs), and linear regression (R2) is indicated by the red line. (G, H) Single-cell gene expression data retrieved from The Human Protein Atlas reveals coexpression of (G) GUCA2A and (H) GUCA2B in normal colon epithelial cell clusters (insets show corresponding colon UMAP plots of cell clusters). (B, C) Data points represent the average of 3 wells of cells from a single experiment, with the mean of 3 independent experiments indicated. Significance was determined by Student’s t test with matched analysis for independent experiments on log2-transformed results. Data are presented relative to noninduced cells. ∗P < .05; ∗∗∗∗P < .0001.
Figure 6
Figure 6
(See previous page). A Pol II-rich super-enhancer upstream of GUCA2A confers Wnt sensitivity. (A) Nine regions of DNase hypersensitivity were identified from sequencing tracks in Figure 4: CTCF ChIP-seq from human HCT116 colon cancer cells (GSE92879) and DNase-seq from transverse colon (GSE90398; hg19, chr1:42,607,745–42,644,356). ChIP-seq of (B) Pol II and (C) H3K27ac in DLD1(DNTCF) cells with (+) or without (–) 1 μg/mL DOX for 24 hours. (D) Corresponding RNA-seq FPKM quantification illustrating greater transcript expression of GUCA2A than GUCA2B in DLD1(DNTCF) cells. (E, F) Nine regions of DNase hypersensitivity were selected and cloned into luciferase reporters. (E) Diagram of enhancer-luciferase reporters driven by a constitutive (SV40) promoter with no upstream enhancer, upstream TCF sites (TOP), upstream mutant TCF sites (FOP), or upstream GUCA2A DNase-sensitive sites in forward (5′-3′) or reverse (3′-5′) orientation. (F) Luciferase constructs were expressed in DLD1(DNTCF) cells, and luciferase was quantified with (+) or without (–) 1 μg/mL DOX for 24 hours. (G, H) A luciferase construct driven by the region from +15 to –10,000 relative to the GUCA2A transcription start site was expressed in (G) DLD1(DNTCF) and (H) LS174T (DNTCF) cells. GUCA2A mRNA, GUCA2B mRNA, and luciferase activity were quantified following 1 μg/mL DOX for 0–48 hours. (I) Luciferase constructs containing 5′ truncations of the region from +15 to –10,000 relative to the GUCA2A transcription start site were expressed in DLD1(DNTCF) and LS174T (DNTCF) cells and luciferase activity was quantified following 1 μg/mL DOX for 24 hours (DLD1) or 48 hours (LS174T). (B, C) ChIP-seq tracks represent the average of 2 replicate immunoprecipitations. (D) RNA-seq results represent the average of 3 replicates. (G, H) Data points represent the average of 3 wells of cells from a single experiment, with the mean of 4 independent experiments indicated. (F, I) Bars represent the average of 4 independent experiments ± SEM. Significance was determined by (G, H) 1-way, or (F, I) 2-way analysis of variance with matched analysis for independent experiments on log2-transformed results. Data are presented relative to noninduced cells. ∗∗P < .01; ∗∗∗P < .001; ∗∗∗∗P < .0001.
Figure 7
Figure 7
Identification of a 2683-bp β-catenin/TCF-sensitive super-enhancer. (A–E) Luciferase constructs driven by the indicated GUCA2A DNA regions were expressed in DLD1(DNTCF) cells. Luciferase activity was quantified with (+) or without (–) 1 μg/mL DOX for 24 hours, and data are presented relative to noninduced cells. (A-B) Luciferase constructs were driven by the region from +15 to –6000 relative to the GUCA2A transcription start site, and harbored deletions of the indicated DNA positions, revealing a 2683-bp region responsible for β-catenin-TCF sensitivity. (C) Luciferase constructs were driven by the GUCA2A promoter (+15 to –133) and core enhancer (–1000 to –3683). (D) Luciferase constructs were driven by a constitutive (SV40) promoter and truncations of the GUCA2A upstream region from +15 to –6000. (E) Luciferase constructs were driven by the GUCA2B promoter (+33 to –100) and GUCA2A core enhancer (–1000 to –3683). Bars represent the average of 4 independent experiments ± SEM. Significance was determined by 2-way analysis of variance with matched analysis for independent experiments on log2-transformed results. ∗P < .05; ∗∗P < .01; ∗∗∗P < .001; ∗∗∗∗P < .0001.
Figure 8
Figure 8
Cas9 deletion confirms a super-enhancer necessary for β-catenin-TCF-sensitive locus control. DLD1(DNTCF) cells expressing Cas9 and untargeted (clone #1) or GUCA2A-locus-targeted gRNAs harbor biallelic deletions encompassing the GUCA2A promoter (clone #2), DNase site #6 (clone #3), DNase site #7 (clone #4), or both DNase sites (clone #5). Expression of (A) GUCA2A protein, (B) GUCA2A mRNA, and (C) GUCA2B mRNA was quantified with (+) or without (–) 1 μg/mL DOX for 24 hours. (D) Hypothetical model of GUCA2A and GUCA2B promoter positioning relative to a Pol II-rich super-enhancer region upstream of GUCA2A, consisting of multiple DNase sites. (E) ChIP-pcr in HT29(APC) cells treated with (+) or without (–) 300 μM zinc for 24 hours reveals enrichment of TCF at the promoter of a Wnt target gene, SP5, with a TCF-specific antibody, but not with control IgG. In contrast, TCF was not detected at sites within 6kb of the GUCA2A TSS: DNase site #5 (GUCA2A promoter), site #6, site #7, or site #8. (F) GUCA2A mRNA expression in HT29(APC) cells stably expressing an untargeted (Ctr) or TCF-targeted shRNA, and treated with (+) or without (–) 300 μM zinc for 24 hours. GUCA2A mRNA expression is retained despite TCF knockdown, illustrated by Western blot. (A–C) Bars represent the average of (A) 2 or (B, C) 3 independent experiments ± SEM, and data are presented relative to noninduced cells. Significance was determined by 2-way analysis of variance with matched analysis for independent experiments on log2-transformed results. (E) Bars represent the mean ± SD of 3 IPs, and data are presented relative to input DNA. Significance was determined by 2-way analysis of variance. (F) Data points represent the average of 3 wells of cells from a single experiment, with the mean of 2 independent experiments indicated. Significance was determined by 2-way analysis of variance with matched analysis for independent experiments on log2-transformed results. Data are presented relative to noninduced cells receiving control shRNA. ∗P < .05; ∗∗P < .01; ∗∗∗P < .001; ∗∗∗∗P < .0001.
Figure 9
Figure 9
Targeting the GUCA2A LCR for Wnt-independent gene control. (A–C) CRISPRi in DLD1(DNTCF) cells stably expressing SID4X.dCas9.KRAB (dCas9.KRAB). (A) GUCA2A mRNA was quantified after stable transduction with 54 individual gRNAs targeting the GUCA2A locus and induction of DNTCF with 1 μg/mL DOX for 24 hours. gRNAs producing significant (P < .05) inhibition of GUCA2A mRNA relative to that of untargeted gRNAs are indicated in red. (B) GUCA2A mRNA and (C) GUCA2B mRNA were quantified after stable transduction with 3–5 gRNAs targeting nothing (sham), the GUCA2A promoter, DNase site #6, or DNase site #7, followed by treatment with 1 μg/mL DOX for 24 hours. (D–F) CRISPRa in DLD1(DNTCF) cells stably expressing dCas9.VP64. (D) GUCA2A mRNA was quantified after stable transduction with 54 gRNAs, as in panel A, in the absence of DOX. (E) GUCA2A mRNA and (F) GUCA2B mRNA were quantified after stable transduction with 3–5 gRNAs, as in panels B and C, in the absence of DOX. Data points represent the average of (A) 2 independent experiments ± SEM or (B) 1 experiment ± SEM. (B, C, E, F) Data points represent the average of 3 wells of cells from a single experiment, with the mean of 3 independent experiments indicated. Significance was determined by 1-way analysis of variance with matched analysis for independent experiments on log2-transformed results. Data are presented relative to cells expressing untargeted gRNAs. ∗∗P < .01; ∗∗∗P < .001; ∗∗∗∗P < .0001.

References

    1. Fearon E.R. Molecular genetics of colorectal cancer. Annu Rev Pathol. 2011;6:479–507. - PubMed
    1. Nusse R., Clevers H. Wnt/beta-catenin signaling, disease, and emerging therapeutic modalities. Cell. 2017;169:985–999. - PubMed
    1. Cancer Genome Atlas Network Comprehensive molecular characterization of human colon and rectal cancer. Nature. 2012;487:330–337. - PMC - PubMed
    1. Rappaport J.A., Waldman S.A. The guanylate cyclase C-cGMP signaling axis opposes intestinal epithelial injury and neoplasia. Front Oncol. 2018;8:299. - PMC - PubMed
    1. Waldman S.A., Camilleri M. Guanylate cyclase-C as a therapeutic target in gastrointestinal disorders. Gut. 2018;67:1543–1552. - PMC - PubMed

Publication types