

Involvement of Calcium-Dependent Pathway and β Subunit-Interaction in Neuronal Migration and Callosal Projection Deficits Caused by the Cav1.2 I1166T Mutation in Developing Mouse Neocortex
- PMID: 34955712
- PMCID: PMC8692569
- DOI: 10.3389/fnins.2021.747951
Involvement of Calcium-Dependent Pathway and β Subunit-Interaction in Neuronal Migration and Callosal Projection Deficits Caused by the Cav1.2 I1166T Mutation in Developing Mouse Neocortex
Abstract
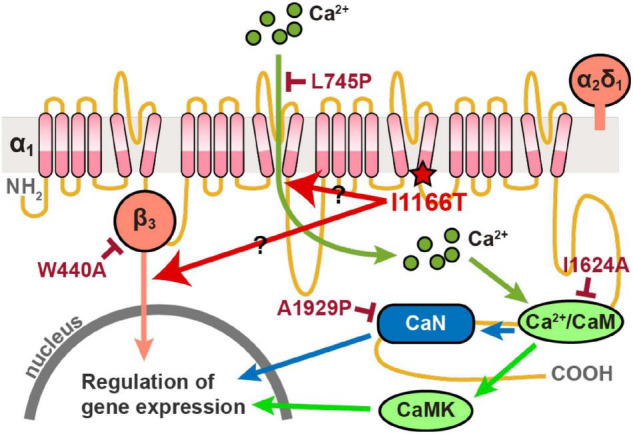
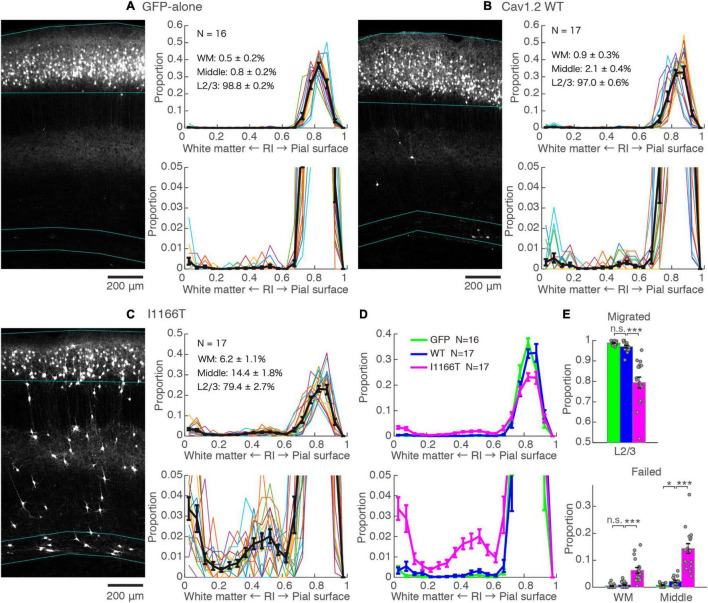
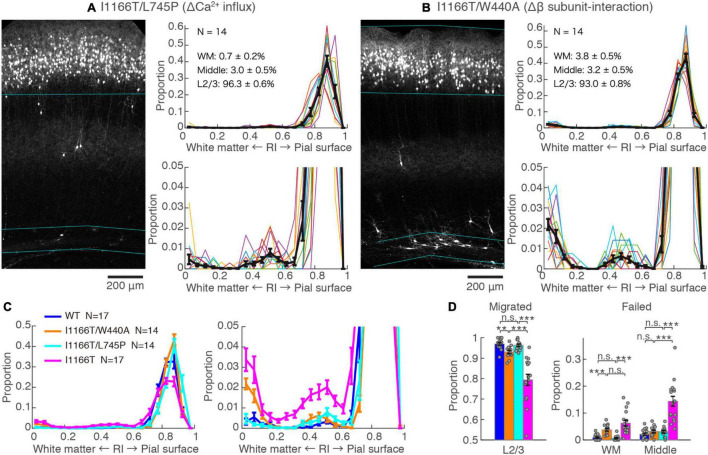
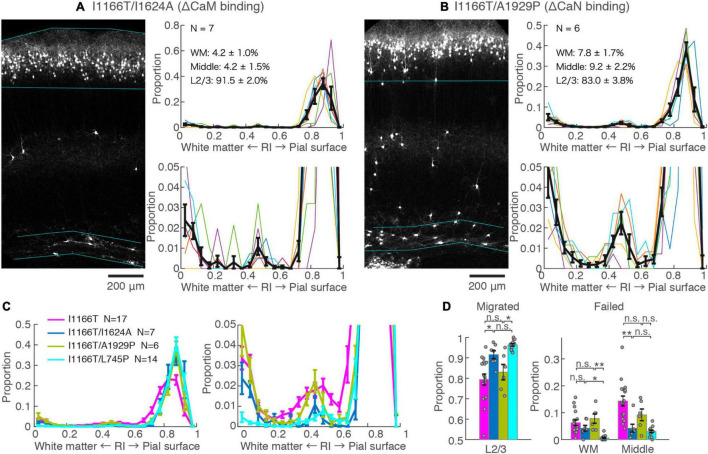
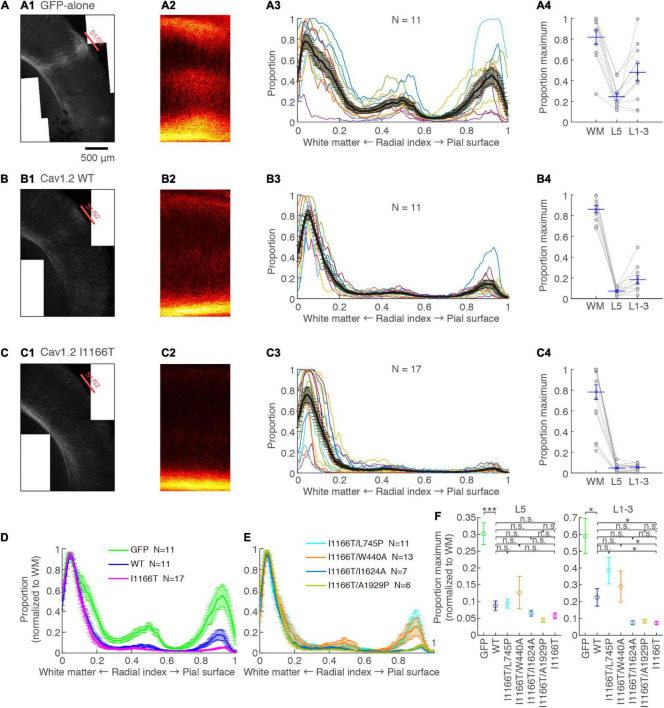
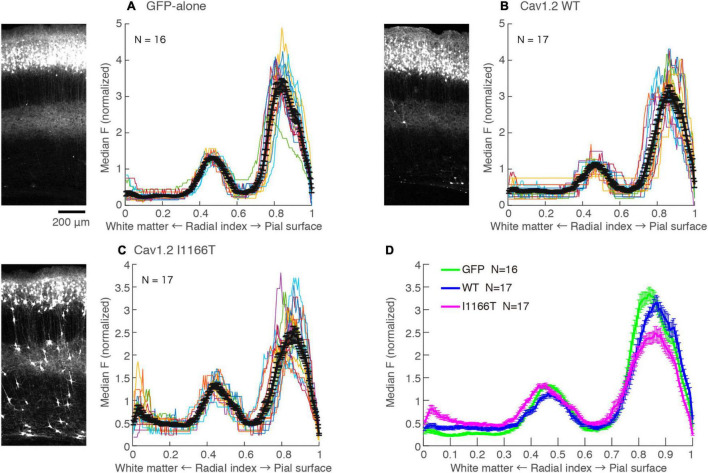
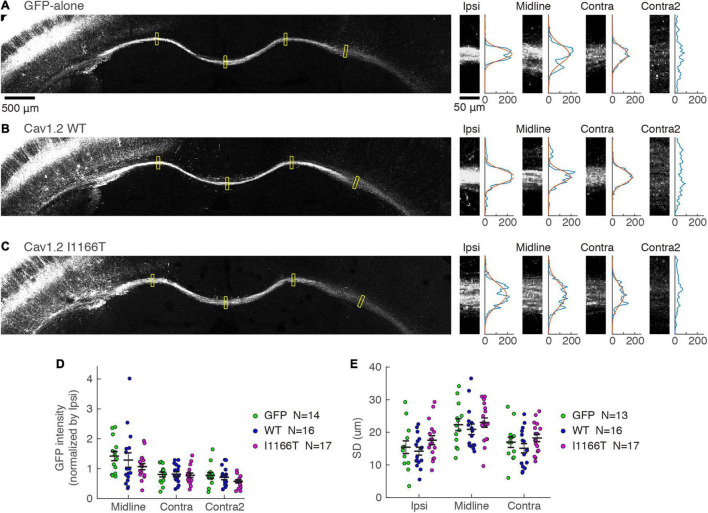
Introduction: Gain-of-function mutations in the L-type Ca2+ channel Cav1.2 cause Timothy syndrome (TS), a multisystem disorder associated with neurologic symptoms, including autism spectrum disorder (ASD), seizures, and intellectual disability. Cav1.2 plays key roles in neural development, and its mutation can affect brain development and connectivity through Ca2+-dependent and -independent mechanisms. Recently, a gain-of-function mutation, I1166T, in Cav1.2 was identified in patients with TS-like disorder. Its channel properties have been analyzed in vitro but in vivo effects of this mutation on brain development remain unexplored. Methods: In utero electroporation was performed on ICR mice at embryonic day 15 to express GFP, wild-type, and mutant Cav1.2 channels into cortical layer 2/3 excitatory neurons in the primary somatosensory area. The brain was fixed at postnatal days 14-16, sliced, and scanned using confocal microscopy. Neuronal migration of electroporated neurons was examined in the cortex of the electroporated hemisphere, and callosal projection was examined in the white matter and contralateral hemisphere. Results: Expression of the I1166T mutant in layer 2/3 neurons caused migration deficits in approximately 20% of electroporated neurons and almost completely diminished axonal arborization in the contralateral hemisphere. Axonal projection in the white matter was not affected. We introduced second mutations onto Cav1.2 I1166T; L745P mutation blocks Ca2+ influx through Cav1.2 channels and inhibits the Ca2+-dependent pathway, and the W440A mutation blocks the interaction of the Cav1.2 α1 subunit to the β subunit. Both second mutations recovered migration and projection. Conclusion: This study demonstrated that the Cav1.2 I1166T mutation could affect two critical steps during cerebrocortical development, migration and axonal projection, in the mouse brain. This is mediated through Ca2+-dependent pathway downstream of Cav1.2 and β subunit-interaction.
Keywords: Timothy syndrome; calcium channel; callosal projection; neocortex; radial migration.
Copyright © 2021 Nakagawa-Tamagawa, Kirino, Sugao, Nagata and Tagawa.
Conflict of interest statement
KS and HN were employees of Sumitomo Dainippon Pharma Co., Ltd. This study received funding from Sumitomo Dainippon Pharma Co., Ltd. The funder had the following involvement with the study: study design. The funder was not involved in data collection, analysis, interpretation, the writing of this article or the decision to submit it for publication. The remaining authors declare that the research was conducted in the absence of any commercial or financial relationships that could be construed as a potential conflict of interest.
Figures
Similar articles
-
A Critical Neurodevelopmental Role for L-Type Voltage-Gated Calcium Channels in Neurite Extension and Radial Migration.J Neurosci. 2018 Jun 13;38(24):5551-5566. doi: 10.1523/JNEUROSCI.2357-17.2018. Epub 2018 May 17. J Neurosci. 2018. PMID: 29773754 Free PMC article.
-
Aberrant calcium channel splicing drives defects in cortical differentiation in Timothy syndrome.Elife. 2019 Dec 23;8:e51037. doi: 10.7554/eLife.51037. Elife. 2019. PMID: 31868578 Free PMC article.
-
β-Subunit of the voltage-gated Ca2+ channel Cav1.2 drives signaling to the nucleus via H-Ras.Proc Natl Acad Sci U S A. 2018 Sep 11;115(37):E8624-E8633. doi: 10.1073/pnas.1805380115. Epub 2018 Aug 27. Proc Natl Acad Sci U S A. 2018. PMID: 30150369 Free PMC article.
-
Cav1.2 channelopathies causing autism: new hallmarks on Timothy syndrome.Pflugers Arch. 2020 Jul;472(7):775-789. doi: 10.1007/s00424-020-02430-0. Epub 2020 Jul 3. Pflugers Arch. 2020. PMID: 32621084 Review.
-
L-type CaV1.2 calcium channels: from in vitro findings to in vivo function.Physiol Rev. 2014 Jan;94(1):303-26. doi: 10.1152/physrev.00016.2013. Physiol Rev. 2014. PMID: 24382889 Review.
Cited by
-
L-type calcium channels and neuropsychiatric diseases: Insights into genetic risk variant-associated genomic regulation and impact on brain development.Channels (Austin). 2023 Dec;17(1):2176984. doi: 10.1080/19336950.2023.2176984. Channels (Austin). 2023. PMID: 36803254 Free PMC article. Review.
-
Diverse axonal morphologies of individual callosal projection neurons reveal new insights into brain connectivity.Curr Opin Neurobiol. 2024 Feb;84:102837. doi: 10.1016/j.conb.2023.102837. Epub 2024 Jan 24. Curr Opin Neurobiol. 2024. PMID: 38271848 Free PMC article. Review.
-
Targeted drug screening for autism based on Cav1.2 calcium ion channel.PLoS One. 2025 May 29;20(5):e0324018. doi: 10.1371/journal.pone.0324018. eCollection 2025. PLoS One. 2025. PMID: 40440280 Free PMC article.
-
Orchestration of Ion Channels and Transporters in Neocortical Development and Neurological Disorders.Front Neurosci. 2022 Feb 14;16:827284. doi: 10.3389/fnins.2022.827284. eCollection 2022. Front Neurosci. 2022. PMID: 35237124 Free PMC article. Review.
-
Making Ramón y Cajal proud: Development of cell identity and diversity in the cerebral cortex.Neuron. 2024 Jul 3;112(13):2091-2111. doi: 10.1016/j.neuron.2024.04.021. Epub 2024 May 15. Neuron. 2024. PMID: 38754415 Free PMC article. Review.
References
LinkOut - more resources
Full Text Sources
Miscellaneous