. 2021 Dec 9:14:779436.
doi: 10.3389/fnmol.2021.779436. eCollection 2021.

Effects of Chemogenetic Inhibition of D1 or D2 Receptor-Containing Neurons of the Substantia Nigra and Striatum in Mice With Tourette Syndrome

Affiliations

Effects of Chemogenetic Inhibition of D1 or D2 Receptor-Containing Neurons of the Substantia Nigra and Striatum in Mice With Tourette Syndrome

Lixue Lin et al. Front Mol Neurosci. .

Abstract

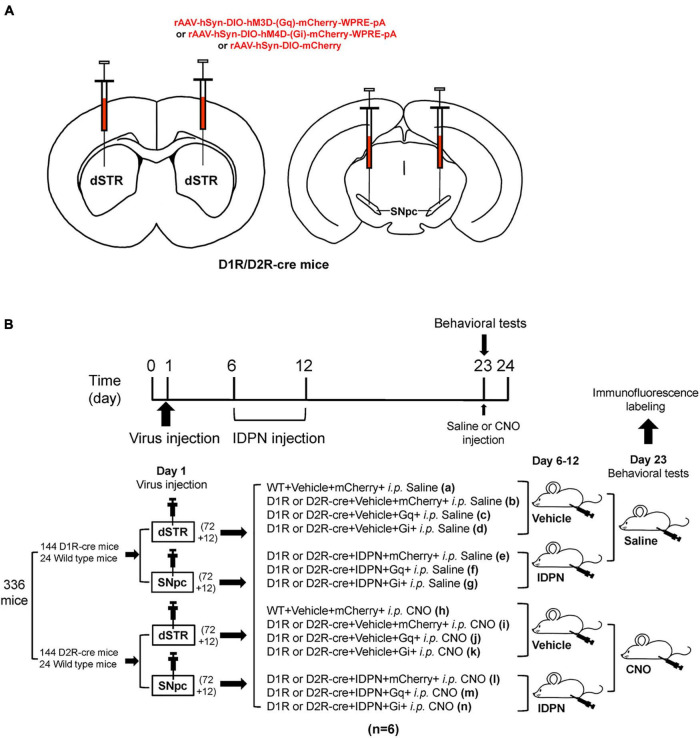
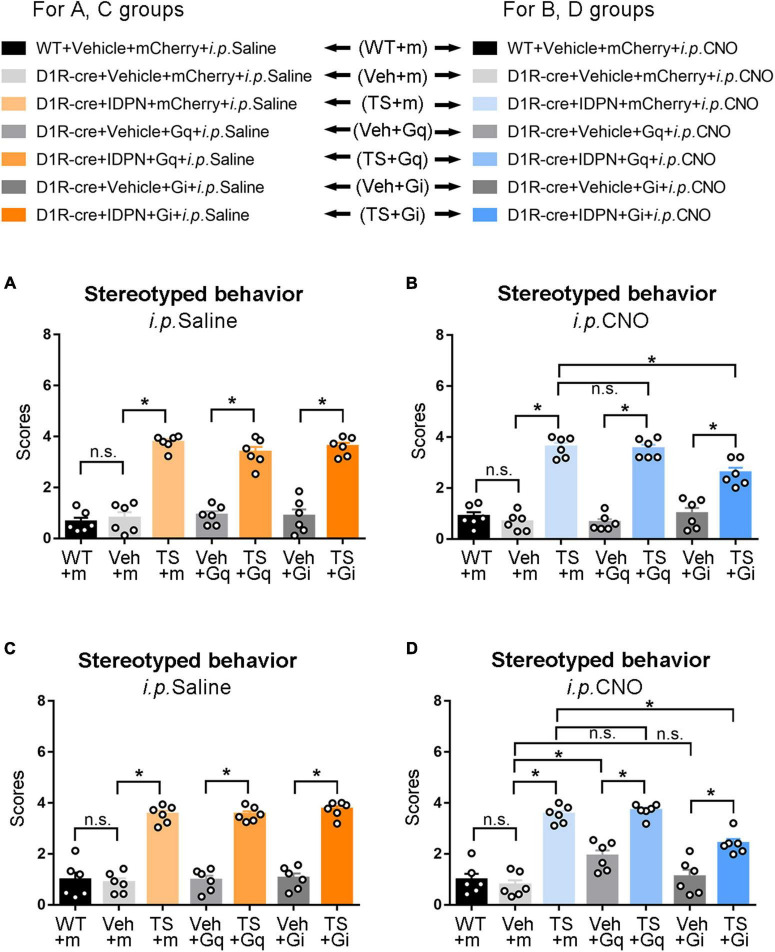
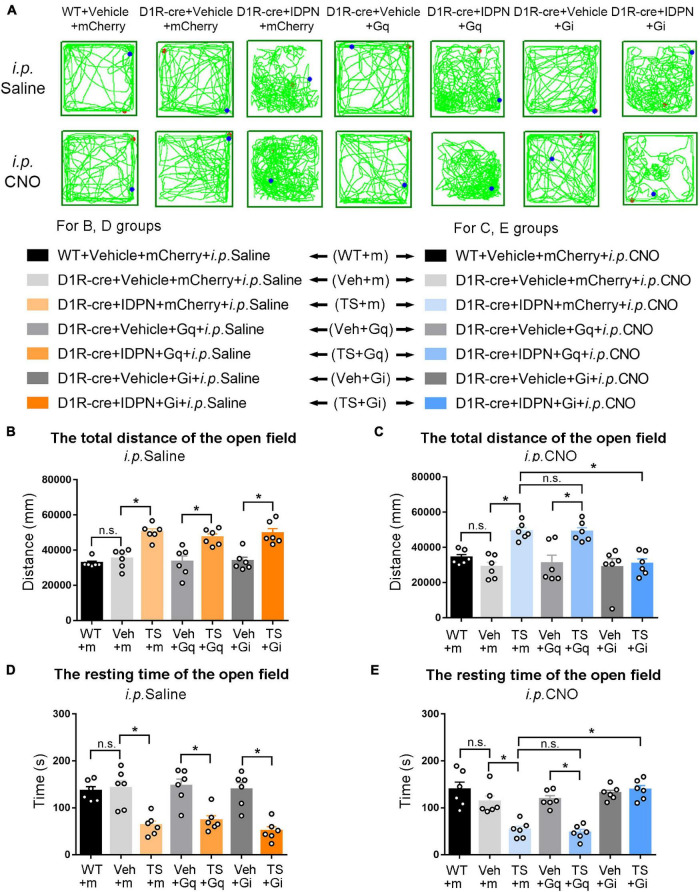
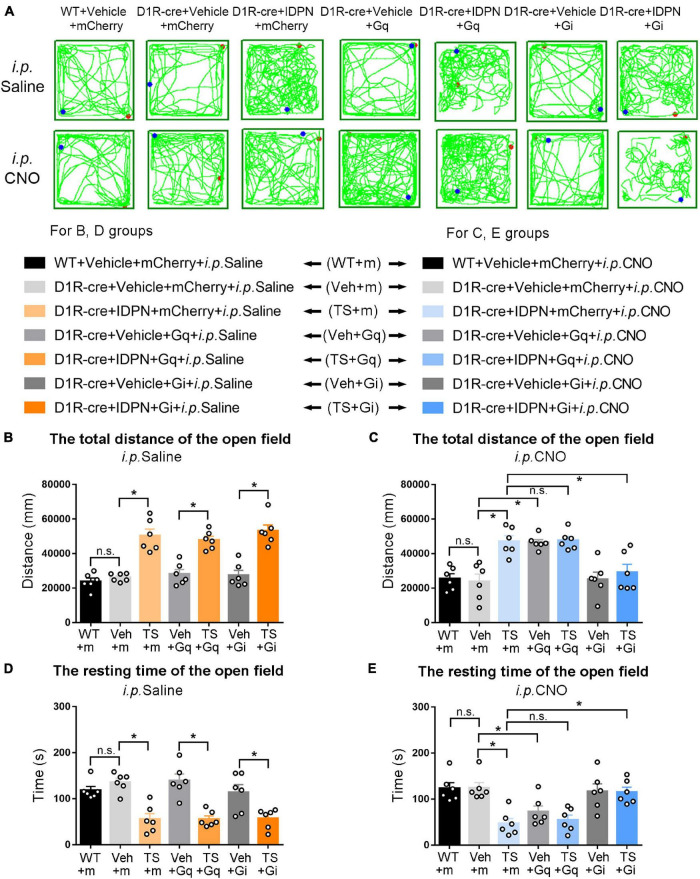
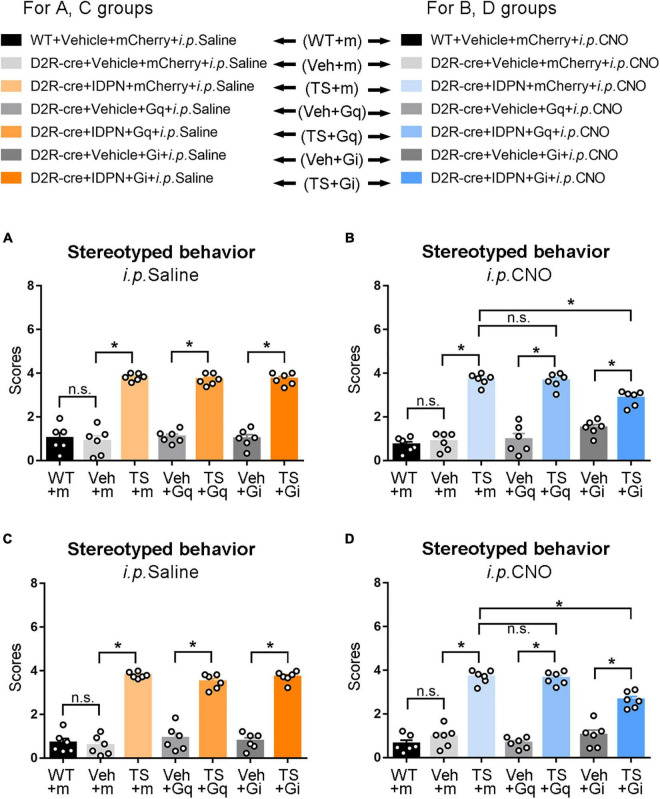
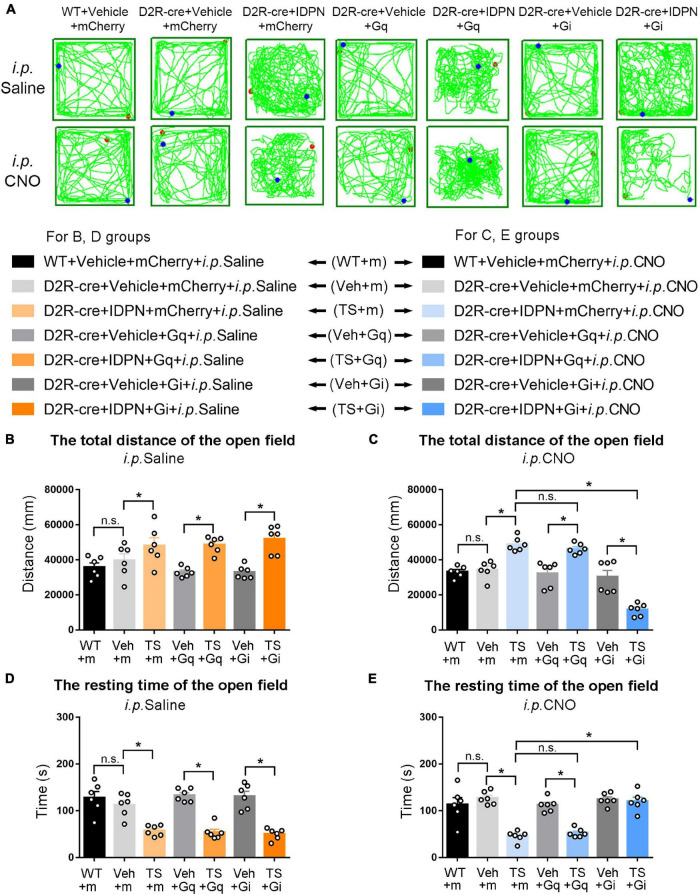
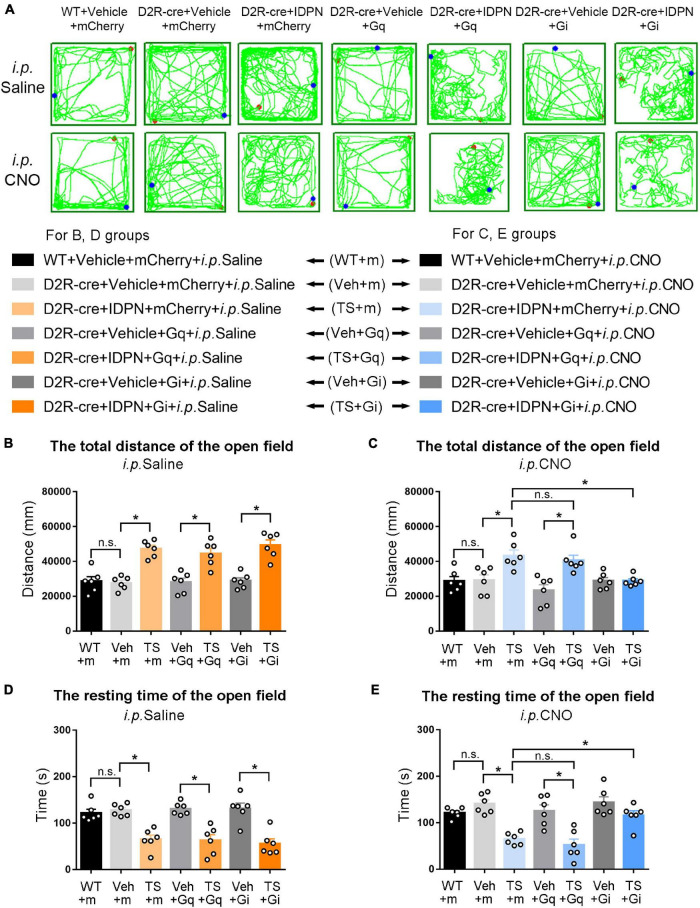
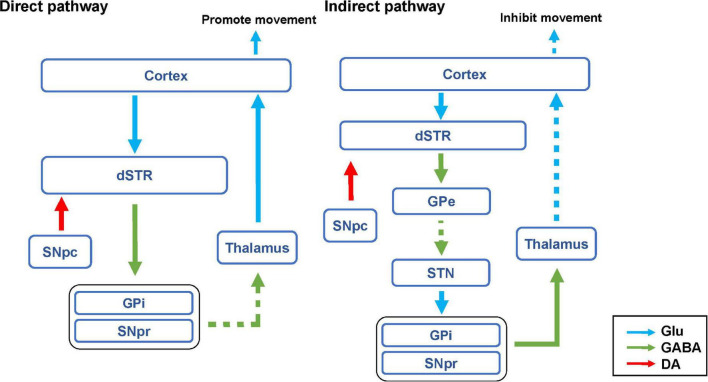
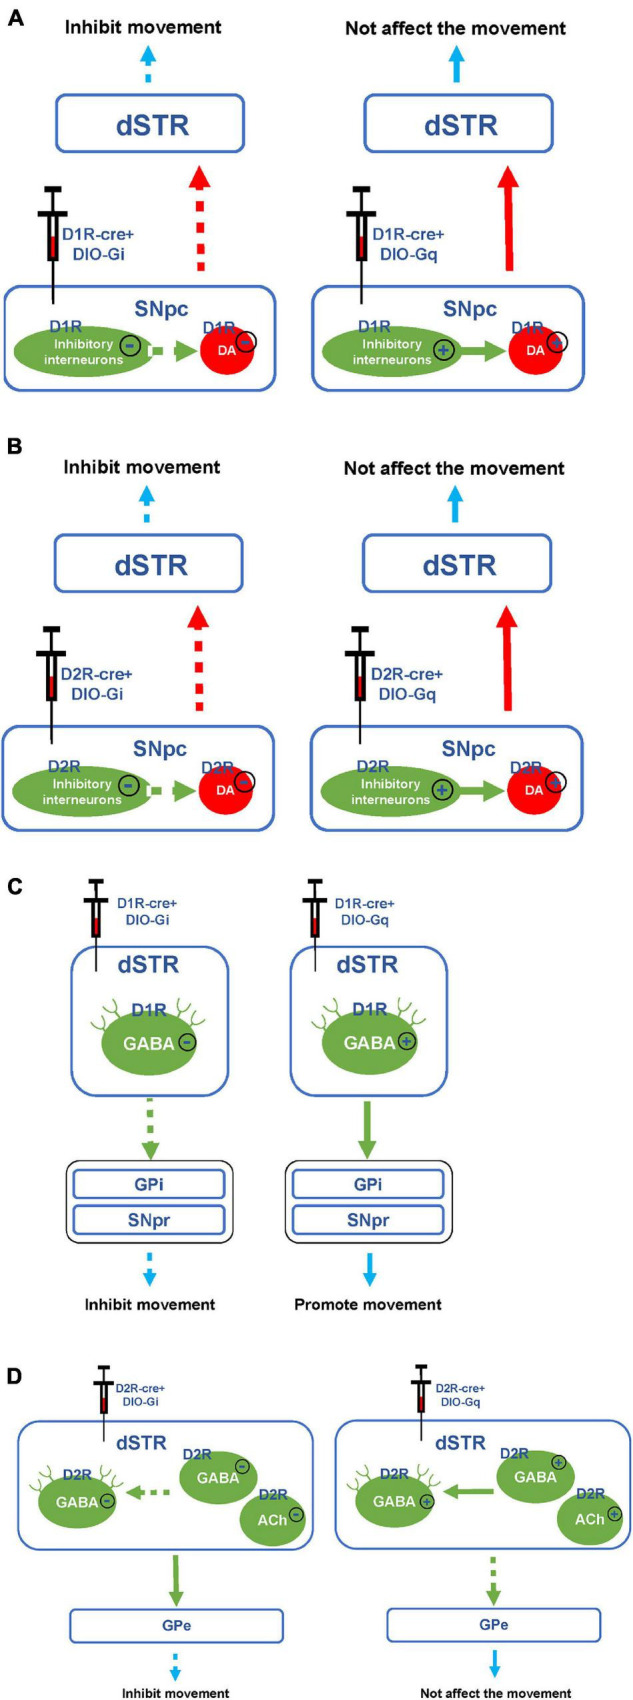
As tourette syndrome (TS) is a common neurobehavioral disorder, the primary symptoms of which include behavioral stereotypies. Dysfunction of the substantia nigra-striatum network could be the main pathogenesis of TS, which is closely associated with dopamine (DA) and its receptors. TS is often resistant to conventional treatments. Therefore, it is necessary to investigate the neurobiological mechanisms underlying its pathogenesis. In this study, we investigated whether chemogenetic activation or inhibition of dopaminergic D1 receptor (D1R)- or D2 receptor (D2R)-containing neurons in the substantia nigra pars compacta (SNpc) or dorsal striatum (dSTR) affected the stereotyped behavior and motor functions of TS mice. Intraperitoneal injection of 3,3'-iminodipropionitrile (IDPN) was used to induce TS in mice. Stereotyped behavior test and open-field, rotarod, and grip strength tests were performed to evaluate stereotyped behavior and motor functions, respectively. Immunofluorescence labeling was used to detect the co-labeling of virus fluorescence and D1R or D2R. We found that chemogenetic inhibition of D1R- or D2R-containing neurons in the SNpc and dSTR alleviated behavioral stereotypies and motor functions in TS mice. Chemogenetic activation of D1R-containing neurons in the dSTR aggravated behavioral stereotypies and motor functions in vehicle-treated mice, but neither was aggravated in TS mice. In conclusion, chemogenetic inhibition of D1R- or D2R-containing neurons in the SNpc and dSTR alleviated behavioral stereotypies of TS, providing a new treatment target for TS. Moreover, the activation of D1R-containing neurons in the dSTR may contribute to the pathogenesis of TS, which can be chosen as a more precise target for treatment.

Keywords: chemogenetic; dopamine receptors; dorsal striatum; substantia nigra pars compacta; tourette syndrome.


Conflict of interest statement

The authors declare that the research was conducted in the absence of any commercial or financial relationships that could be construed as a potential conflict of interest.

Figures

FIGURE 1
FIGURE 1
Experimental design. (A) Schematic diagram of the virus injection area. (B) Experimental design timeline. A total of 336 mice [including 144 D1R-cre mice and 24 wild-type littermate (WT) mice, 144 D2R-cre mice, and 24 WT mice] participated in this experiment. After adaptive feeding for 1 week, they were randomly divided into four large groups (84 mice in each large group), among which 72 D1R-cre mice and 12 WT mice were further divided into two small groups, and 72 D2R-cre mice and 12 WT littermate mice were further divided into two small groups. On the first day, one small group of D1R-cre mice and WT littermate mice, one small group of D2R-cre mice and WT mice were injected with the virus in the bilateral dSTR (200 nL/side), the other two small groups were injected with the virus in the bilateral SNpc (200 nL/side). Eighty-four mice in each large group were randomly divided into 14 groups according to the injections of different drugs or virus, including WT + Vehicle + mCherry + i.p. Saline (group a), D1R or D2R-cre + Vehicle + mCherry + i.p. Saline group (group b), D1R or D2R-cre + Vehicle + Gq + i.p. Saline group (group c), D1R or D2R-cre + Vehicle + Gi + i.p. Saline group (group d), D1R or D2R-cre + IDPN + mCherry + i.p. Saline group (group e), D1R or D2R-cre + IDPN + Gq + i.p. Saline group (group f), D1R or D2R-cre + IDPN + Gi + i.p. Saline group (group g), WT + Vehicle + mCherry + i.p. CNO group (group h), D1R or D2R-cre + Vehicle + mCherry + i.p. CNO group (group i), D1R or D2R-cre + Vehicle + Gq + i.p. CNO group (group j), D1R or D2R-cre + Vehicle + Gi + i.p. CNO group (group k), D1R or D2R-cre + IDPN + mCherry + i.p. CNO group (group l), D1R or D2R-cre + IDPN + Gq + i.p. CNO group (group m) and D1R or D2R-cre + IDPN + Gi + i.p. CNO group (group n) (n = 6 mice in each group). Mice in the groups a, b, e, h, i, and l were injected with a control virus (mCherry). Mice in the groups c, f, j, and m were injected with hM3Dq. Mice in group d, g, k, and n were injected with hM4Di. After the virus injection, all mice were back to the cage to rest for 4 days (days 2–5). On days 6–12, mice in groups e, f, g, l, m, and n were intraperitoneally injected with IDPN at 10:00 a.m. once daily, and mice in the other groups were intraperitoneally injected with 0.9% saline (Vehicle, contrast with IDPN). On the 23rd day, mice in the a–g groups were intraperitoneally injected with 0.9% saline (contrast with CNO), and mice in the h–n groups were intraperitoneally injected with clozapine N-oxide (CNO, Sigma, St. Louis, MO, United States, 1 mg/kg). Thirty minutes later, behavioral tests were carried out to compare the differences between the groups. Brain tissues for immunofluorescence labeled were collected on day 24.
FIGURE 2
FIGURE 2
Effects of activation or inhibition of the D1R-containing neurons in the SNpc and dSTR on stereotyped behavior in mice. (A) Evaluations of stereotyped behavior scores of mice injected with virus in the SNpc 30 min after the injection of saline (i.p. Saline) in the WT + Vehicle + mCherry + i.p. Saline group (WT + m), D1R-cre + Vehicle + mCherry + i.p. Saline group (Veh + m), D1R-cre + IDPN + mCherry + i.p. Saline group (TS + m), D1R-cre + Vehicle + Gq + i.p. Saline group (Veh + Gq), D1R-cre + IDPN + Gq + i.p. Saline group (TS + Gq), D1R-cre + Vehicle + Gi + i.p. Saline group (Veh + Gi), D1R-cre + IDPN + Gi + i.p. Saline group (TS + Gi) on day 23. (B) Evaluations of stereotyped behavior scores of mice injected with virus in the SNpc 30 min after the injection of CNO (i.p. CNO) in the WT + Vehicle + mCherry + i.p. CNO group (WT + m), D1R-cre + Vehicle + mCherry + i.p. CNO group (Veh + m), D1R-cre + IDPN + mCherry + i.p. CNO group (TS + m), D1R-cre + Vehicle + Gq + i.p. CNO group (Veh + Gq), D1R-cre + IDPN + Gq + i.p. CNO group (TS + Gq), D1R-cre + Vehicle + Gi + i.p. CNO group (Veh + Gi), D1R-cre + IDPN + Gi + i.p. CNO group (TS + Gi) on day 23. (C) Evaluations of stereotyped behavior scores of mice injected with virus in the dSTR 30 min after the injection of saline (i.p. Saline) in each group on day 23. (D) Evaluations of stereotyped behavior scores of mice injected with virus in the dSTR 30 min after the injection of CNO (i.p. CNO) in each group on day 23. Data are expressed as mean ± SEM (n = 6 mice in each group), and the black line segment indicates the differences between groups, * represents P < 0.05 between marked groups, n.s. represents P > 0.05 between marked groups.
FIGURE 3
FIGURE 3
Effects of activation or inhibition of D1R-containing neurons in the SNpc on total distance and resting time in the open-field test in mice. (A) Evaluations of the trajectory in the open-field test in mice 30 min after the injection of saline (i.p. Saline) or CNO (i.p. CNO) in the WT + Vehicle + mCherry + i.p. Saline group (WT + m), D1R-cre + Vehicle + mCherry + i.p. Saline group (Veh + m), D1R-cre + IDPN + mCherry + i.p. Saline group (TS + m), D1R-cre + Vehicle + Gq + i.p. Saline group (Veh + Gq), D1R-cre + IDPN + Gq + i.p. Saline group (TS + Gq), D1R-cre + Vehicle + Gi + i.p. Saline group (Veh + Gi), D1R-cre + IDPN + Gi + i.p. Saline group (TS + Gi), WT + Vehicle + mCherry + i.p. CNO group (WT + m), D1R-cre + Vehicle + mCherry + i.p. CNO group (Veh + m), D1R-cre + IDPN + mCherry + i.p. CNO group (TS + m), D1R-cre + Vehicle + Gq + i.p. CNO group (Veh + Gq), D1R-cre + IDPN + Gq + i.p. CNO group (TS + Gq), D1R-cre + Vehicle + Gi + i.p. CNO group (Veh + Gi), D1R-cre + IDPN + Gi + i.p. CNO group (TS + Gi) on day 23. (B) Total distance in the open-field test within 10 min in mice of each group 30 min after the injection of saline (i.p. Saline) on day 23. (C) Total distance in the open-field test within 10 min in mice of each group 30 min after the injection of CNO (i.p. CNO) on day 23. (D) Resting time in the open-field test within 10 min in mice of each group 30 min after the injection of saline (i.p. Saline) on day 23. (E) Resting time in the open-field test within 10 min in mice of each group 30 min after the injection of CNO (i.p. CNO) on day 23. Data are expressed as mean ± SEM (n = 6 mice in each group), and the black line segment indicates the differences between groups, * represents P < 0.05 between marked groups, and n.s. represents P > 0.05 between marked groups.
FIGURE 4
FIGURE 4
Effects of activation or inhibition of D1R-containing neurons in the dSTR on total distance and resting time in the open-field test in mice. (A) Evaluations of the trajectory in the open-field test in mice 30 min after the injection of saline (i.p. Saline) or CNO (i.p. CNO) in the WT + Vehicle + mCherry + i.p. Saline group (WT + m), D1R-cre + Vehicle + mCherry + i.p. Saline group (Veh + m), D1R-cre + IDPN + mCherry + i.p. Saline group (TS + m), D1R-cre + Vehicle + Gq + i.p. Saline group (Veh + Gq), D1R-cre + IDPN + Gq + i.p. Saline group (TS + Gq), D1R-cre + Vehicle + Gi + i.p. Saline group (Veh + Gi), D1R-cre + IDPN + Gi + i.p. Saline group (TS + Gi), WT + Vehicle + mCherry + i.p. CNO group (WT + m), D1R-cre + Vehicle + mCherry + i.p. CNO group (Veh + m), D1R-cre + IDPN + mCherry + i.p. CNO group (TS + m), D1R-cre + Vehicle + Gq + i.p. CNO group (Veh + Gq), D1R-cre + IDPN + Gq + i.p. CNO group (TS + Gq), D1R-cre + Vehicle + Gi + i.p. CNO group (Veh + Gi), D1R-cre + IDPN + Gi + i.p. CNO group (TS + Gi) on day 23. (B) Total distance in the open-field test within 10 min in mice of each group 30 min after the injection of saline (i.p. Saline) on day 23. (C) Total distance in the open-field test within 10 min in mice of each group 30 min after the injection of CNO (i.p. CNO) on day 23. (D) Resting time in the open-field test within 10 min in mice of each group 30 min after the injection of saline (i.p. Saline) on day 23. (E) Resting time in the open-field test within 10 min in mice of each group 30 min after the injection of CNO (i.p. CNO) on day 23. Data are expressed as mean ± SEM (n = 6 mice in each group), and the black line segment indicates the differences between groups, * represents P < 0.05 between marked groups, and n.s. represents P > 0.05 between marked groups.
FIGURE 5
FIGURE 5
Effects of activation or inhibition of the D2R-containing neurons in the SNpc and dSTR on stereotyped behavior in mice. (A) Evaluations of stereotyped behavior scores of mice injected with virus in the SNpc 30 min after the injection of saline (i.p. Saline) in the WT + Vehicle + mCherry + i.p. Saline group (WT + m), D2R-cre + Vehicle + mCherry + i.p. Saline group (Veh + m), D2R-cre + IDPN + mCherry + i.p. Saline group (TS + m), D2R-cre + Vehicle + Gq + i.p. Saline group (Veh + Gq), D2R-cre + IDPN + Gq + i.p. Saline group (TS + Gq), D2R-cre + Vehicle + Gi + i.p. Saline group (Veh + Gi), D2R-cre + IDPN + Gi + i.p. Saline group (TS + Gi) on day 23. (B) Evaluations of stereotyped behavior scores of mice injected with virus in the SNpc 30 min after the injection of CNO (i.p. CNO) in the WT + Vehicle + mCherry + i.p. CNO group (WT + m), D2R-cre + Vehicle + mCherry + i.p. CNO group (Veh + m), D2R-cre + IDPN + mCherry + i.p. CNO group (TS + m), D2R-cre + Vehicle + Gq + i.p. CNO group (Veh + Gq), D2R-cre + IDPN + Gq + i.p. CNO group (TS + Gq), D2R-cre + Vehicle + Gi + i.p. CNO group (Veh + Gi), D2R-cre + IDPN + Gi + i.p. CNO group (TS + Gi) on day 23. (C) Evaluations of stereotyped behavior scores of mice injected with virus in the dSTR 30 min after the injection of saline (i.p. Saline) in each group on day 23. (D) Evaluations of stereotyped behavior scores of mice injected with virus in the dSTR 30 min after the injection of CNO (i.p. CNO) in each group on day 23. Data are expressed as mean ± SEM (n = 6 mice in each group), and the black line segment indicates the differences between groups, * represents P < 0.05 between marked groups, n.s. represents P > 0.05 between marked groups.
FIGURE 6
FIGURE 6
Effects of activation or inhibition of D2R-containing neurons in the SNpc on total distance and resting time in the open-field test in mice. (A) Evaluations of the trajectory in the open-field test in mice 30 min after the injection of saline (i.p. Saline) or CNO (i.p. CNO) in the WT + Vehicle + mCherry + i.p. Saline group (WT + m), D2R-cre + Vehicle + mCherry + i.p. Saline group (Veh + m), D2R-cre + IDPN + mCherry + i.p. Saline group (TS + m), D2R-cre + Vehicle + Gq + i.p. Saline group (Veh + Gq), D2R-cre + IDPN + Gq + i.p. Saline group (TS + Gq), D2R-cre + Vehicle + Gi + i.p. Saline group (Veh + Gi), D2R-cre + IDPN + Gi + i.p. Saline group (TS + Gi), WT + Vehicle + mCherry + i.p. CNO group (WT + m), D2R-cre + Vehicle + mCherry + i.p. CNO group (Veh + m), D2R-cre + IDPN + mCherry + i.p. CNO group (TS + m), D2R-cre + Vehicle + Gq + i.p. CNO group (Veh + Gq), D2R-cre + IDPN + Gq + i.p. CNO group (TS + Gq), D2R-cre + Vehicle + Gi + i.p. CNO group (Veh + Gi), D2R-cre + IDPN + Gi + i.p. CNO group (TS + Gi) on day 23. (B) Total distance in the open-field test within 10 min in mice of each group 30 min after the injection of saline (i.p. Saline) on day 23. (C) Total distance in the open-field test within 10 min in mice of each group 30 min after the injection of CNO (i.p. CNO) on day 23. (D) Resting time in the open-field test within 10 min in mice of each group 30 min after the injection of saline (i.p. Saline) on day 23. (E) Resting time in the open-field test within 10 min in mice of each group 30 min after the injection of CNO (i.p. CNO) on day 23. Data are expressed as mean ± SEM (n = 6 mice in each group), and the black line segment indicates the differences between groups, * represents P < 0.05 between marked groups, and n.s. represents P > 0.05 between marked groups.
FIGURE 7
FIGURE 7
Effects of activation or inhibition of D2R-containing neurons in the dSTR on total distance and resting time in the open-field test in mice. (A) Evaluations of the trajectory in the open-field test in mice 30 min after the injection of saline (i.p. Saline) or CNO (i.p. CNO) in the WT + Vehicle + mCherry + i.p. Saline group (WT + m), D2R-cre + Vehicle + mCherry + i.p. Saline group (Veh + m), D2R-cre + IDPN + mCherry + i.p. Saline group (TS + m), D2R-cre + Vehicle + Gq + i.p. Saline group (Veh + Gq), D2R-cre + IDPN + Gq + i.p. Saline group (TS + Gq), D2R-cre + Vehicle + Gi + i.p. Saline group (Veh + Gi), D2R-cre + IDPN + Gi + i.p. Saline group (TS + Gi), WT + Vehicle + mCherry + i.p. CNO group (WT + m), D2R-cre + Vehicle + mCherry + i.p. CNO group (Veh + m), D2R-cre + IDPN + mCherry + i.p. CNO group (TS + m), D2R-cre + Vehicle + Gq + i.p. CNO group (Veh + Gq), D2R-cre + IDPN + Gq + i.p. CNO group (TS + Gq), D2R-cre + Vehicle + Gi + i.p. CNO group (Veh + Gi), D2R-cre + IDPN + Gi + i.p. CNO group (TS + Gi) on day 23. (B) Total distance in the open-field test within 10 min in mice of each group 30 min after the injection of saline (i.p. Saline) on day 23. (C) Total distance in the open-field test within 10 min in mice of each group 30 min after the injection of CNO (i.p. CNO) on day 23. (D) Resting time in the open-field test within 10 min in mice of each group 30 min after the injection of saline (i.p. Saline) on day 23. (E) Resting time in the open-field test within 10 min in mice of each group 30 min after the injection of CNO (i.p. CNO) on day 23. Data are expressed as mean ± SEM (n = 6 mice in each group), and the black line segment indicates the differences between groups, * represents P < 0.05 between marked groups, and n.s. represents P > 0.05 between marked groups.
FIGURE 8
FIGURE 8
Hypothesis diagram of direct and indirect pathways of basal ganglia motor regulatory system. The blue arrow represents glutamatergic (Glu) neuron transmission. The green arrow indicates GABAergic neuron transmission. The red arrow represents dopaminergic neuron transmission. The solid line represents activation. The dashed line indicates inhibition.
FIGURE 9
FIGURE 9
Hypothesis diagram of experimental mechanism. (A) Hypothesis diagram of chemogenetic inhibition or activation of D1R-containing neurons in the SNpc. (B) Hypothesis diagram of chemogenetic inhibition or activation of D2R-containing neurons in the SNpc. (C) Hypothesis diagram of chemogenetic inhibition or activation of D1R-containing neurons in the dSTR. (D) Hypothesis diagram of chemogenetic inhibition or activation of D2R-containing neurons in the dSTR. The solid line or plus sign indicates activation. The dashed line or minus sign indicates inhibition.

References

    1. Alcantara A. A., Chen V., Herring B. E., Mendenhall J. M., Berlanga M. L. (2003). Localization of dopamine D2 receptors on cholinergic interneurons of the dorsal striatum and nucleus accumbens of the rat. Brain Res. 986 22–29. 10.1016/s0006-8993(03)03165-2 - DOI - PubMed
    1. Andrade P., Visser-Vandewalle V. (2016). DBS in tourette syndrome: where are we standing now? J. Neural Transm. 123 791–796. 10.1007/s00702-016-1569-7 - DOI - PubMed
    1. Assali D. R., Sidikpramana M., Villa A. P., Falkenstein J., Steele A. D. (2021). Type 1 dopamine receptor (D1R)-independent circadian food anticipatory activity in mice. PLoS One 16:e0242897. 10.1371/journal.pone.0242897 - DOI - PMC - PubMed
    1. Avila-Luna A., Rios C., Galvez-Rosas A., Montes S., Arias-Montano J. A., Bueno-Nava A. (2019). Chronic administration of the histamine H3 receptor agonist immepip decreases L-Dopa-induced dyskinesias in 6-hydroxydopamine-lesioned rats. Psychopharmacology 236 1937–1948. 10.1007/s00213-019-5182-y - DOI - PubMed
    1. Baym C. L., Corbett B. A., Wright S. B., Bunge S. A. (2008). Neural correlates of tic severity and cognitive control in children with Tourette syndrome. Brain 131(Pt 1), 165–179. 10.1093/brain/awm278 - DOI - PubMed