. 2021 Dec 10:12:782660.
doi: 10.3389/fphar.2021.782660. eCollection 2021.

Maresin 1 Attenuates Lipopolysaccharide-Induced Acute Kidney Injury via Inhibiting NOX4/ROS/NF-κB Pathway

Affiliations

Maresin 1 Attenuates Lipopolysaccharide-Induced Acute Kidney Injury via Inhibiting NOX4/ROS/NF-κB Pathway

Jiameng Li et al. Front Pharmacol. .

Abstract

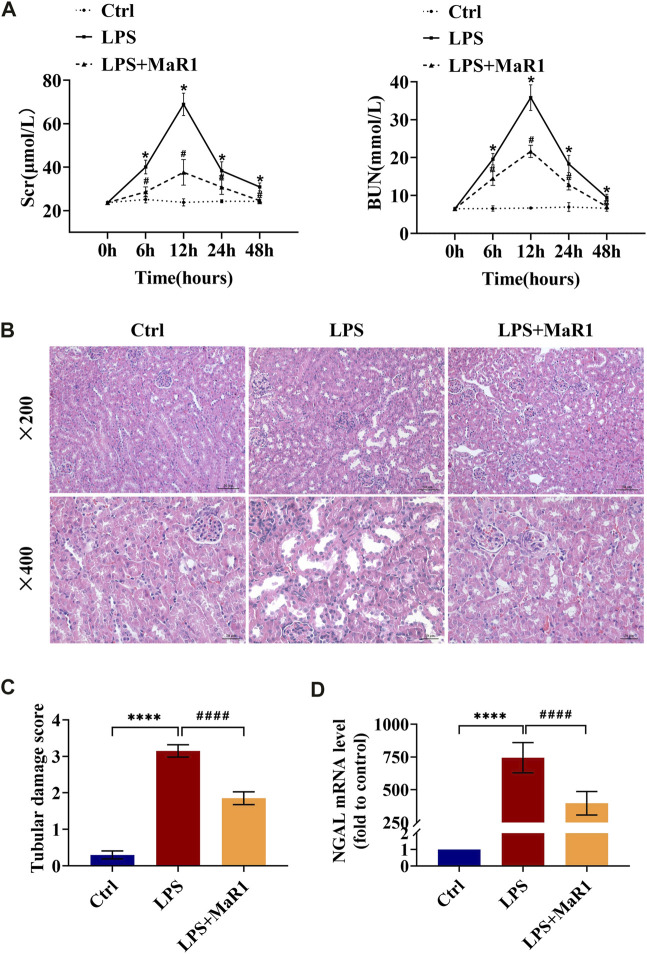
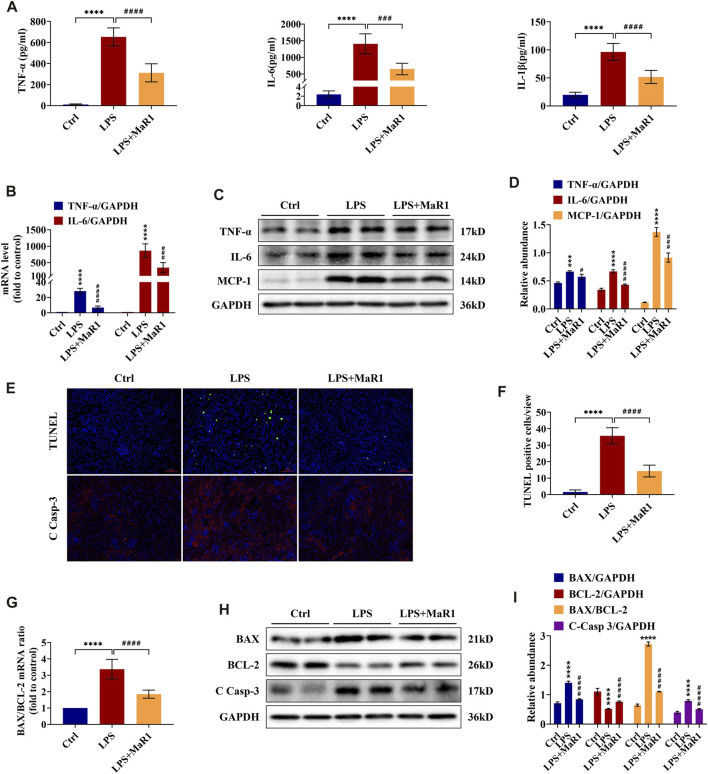
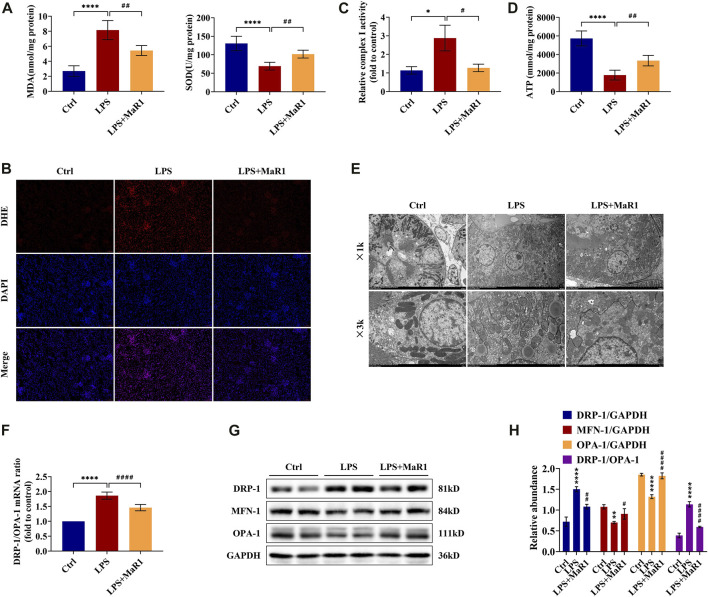
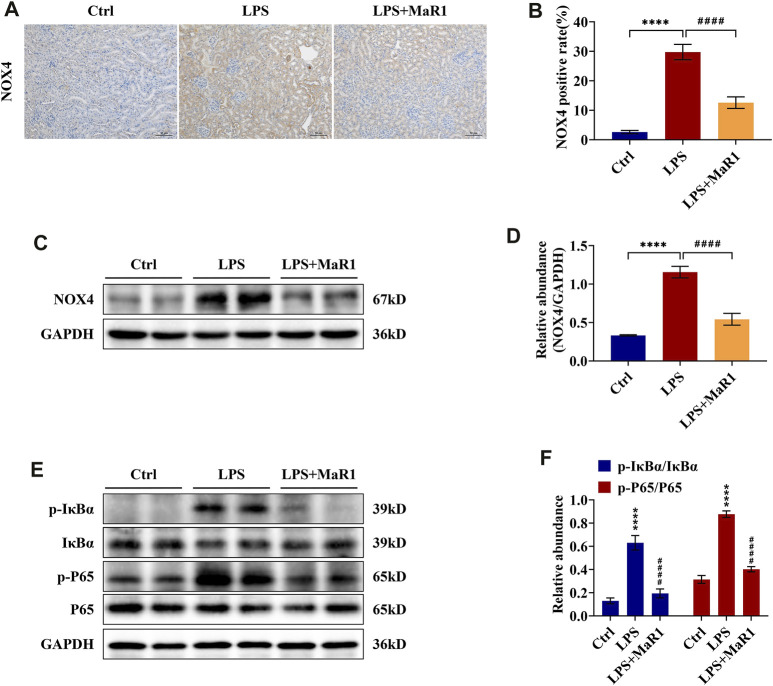
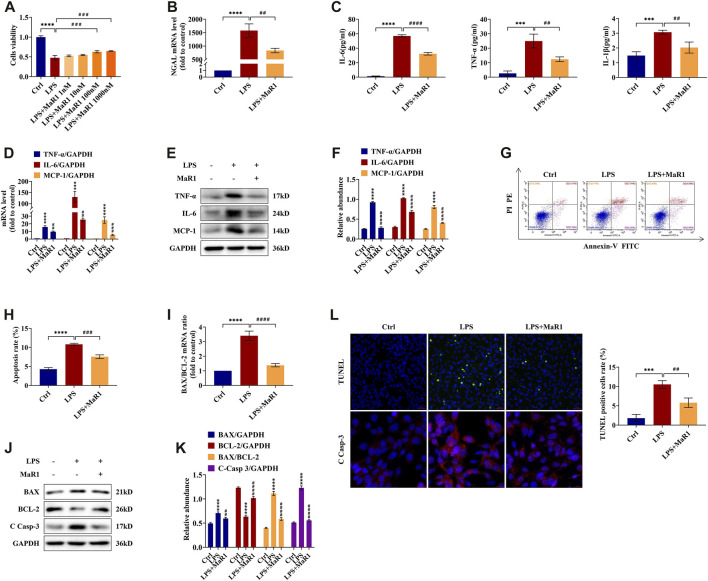
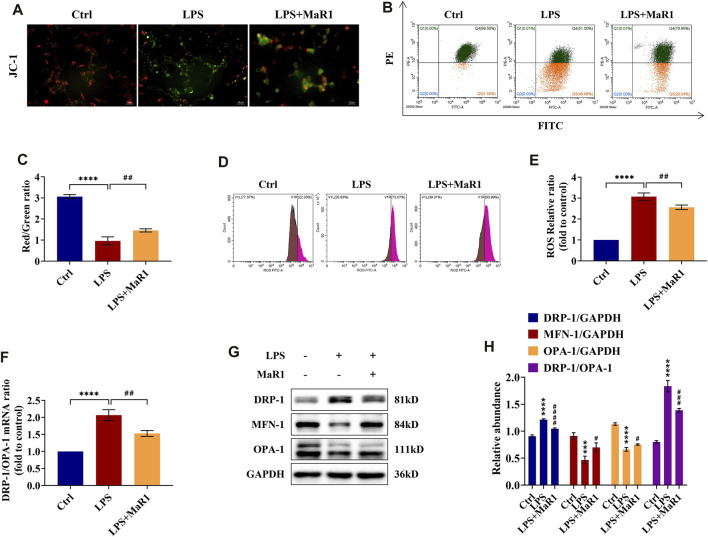
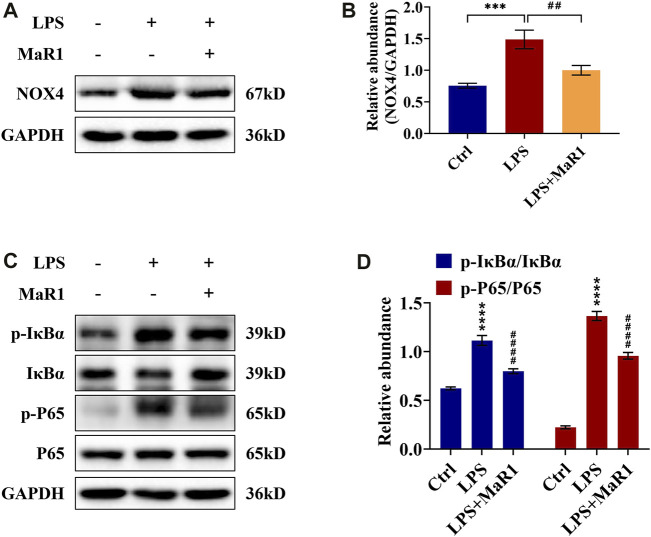
Sepsis-associated acute kidney injury (S-AKI) is a common complication in hospitalized and critically ill patients, which increases the risk of multiple comorbidities and is associated with extremely high mortality. Maresin 1 (MaR1), a lipid mediator derived from the omega-3 fatty acid docosahexaenoic acid has been reported to protect against inflammation and promote the regression of acute inflammation. This study proposed to systematically investigate the renoprotective effects and potential molecular mechanism of MaR1 in septic acute kidney injury. We established a S-AKI animal model by a single intraperitoneal injection of lipopolysaccharide (LPS), 10 mg/kg, on male C57BL/6J mice. LPS-stimulated (100 μg/ml) mouse kidney tubular epithelium cells (TCMK-1) were used to simulate septic AKI in vitro. The results showed that pretreatment with MaR1 significantly reduced serum creatinine and blood urea nitrogen levels as well as tubular damage scores and injury marker neutrophil gelatinase-associated lipocalin in septic AKI mice. Meanwhile, MaR1 administration obviously diminished pro-inflammatory cytokines (TNF-α, IL-6, IL-1β, and MCP-1), downregulated BAX and cleaved caspase-3 expression, and upregulated BCL-2 expression in the injured kidney tissues and TCMK-1 cells. In addition, MaR1 reduced malondialdehyde production and improved the superoxide dismutase activity of renal tissues while inhibiting reactive oxygen species (ROS) production and protecting the mitochondria. Mechanistically, LPS stimulated the expression of the NOX4/ROS/NF-κB p65 signaling pathway in S-AKI kidneys, while MaR1 effectively suppressed the activation of the corresponding pathway. In conclusion, MaR1 attenuated kidney inflammation, apoptosis, oxidative stress, and mitochondrial dysfunction to protect against LPS-induced septic AKI via inhibiting the NOX4/ROS/NF-κB p65 signaling pathway.

Keywords: acute kidney injury; apoptosis; inflammation; lipopolysaccharide; maresin 1; mitochondrial dysfunction.


Conflict of interest statement

The authors declare that the research was conducted in the absence of any commercial or financial relationships that could be construed as a potential conflict of interest.

Figures

FIGURE 1
FIGURE 1
MaR1 alleviated renal injury in lipopolysaccharide (LPS)-induced S-AKI mice. (A) Serum creatinine and blood urea nitrogen levels at 0, 6, 12, 24, and 48 h after LPS intraperitoneal injection in each group of mice. (B) Representative HE staining images of kidney tissues were collected (scale bars = 50 and 20 μm) (time point: 12 h). (C) Pathological tubular damage score. (D) Gene expression of neutrophil gelatinase-associated lipocalin in renal tissues were quantitated using qRT-PCR (time point: 12 h). Data are presented as mean ± SD, n = 5. *p < 0.05, **p < 0.01, ***p < 0.001, ****p < 0.0001; #p < 0.05, ##p < 0.01, ###p < 0.001, ####p < 0.0001 vs. LPS group.
FIGURE 2
FIGURE 2
MaR1 inhibited inflammation and renal cell apoptosis in lipopolysaccharide (LPS)-induced S-AKI mice. (A) The serum levels of TNF-α, IL-6, and IL-1β were determined using assay kits in each group of mice. (B) Gene expression of TNF-α and IL-6 in renal tissues was quantitated using qRT-PCR. (C) The expressions of TNF-α, IL-6, and MCP-1 in renal tissues were analyzed using Western blot. (D) The protein levels of TNF-α, IL-6, and MCP-1 were quantified by densitometry and normalized with GAPDH. (E) TUNEL staining and immunofluorescence staining images of cleaved caspase-3 (C Casp-3) expression in renal sections were collected (scale bars = 50 μm). (F) TUNEL staining positive cells were counted in each group. (G) The gene expression ratio of BAX/BCL-2 in renal tissues was quantitated using qRT-PCR. (H) The expressions of BAX, BCL-2, and C Casp-3 in renal tissues were analyzed using Western blot. (I) The protein levels of BAX, BCL-2, and C Casp-3 were quantified by densitometry and normalized with GAPDH (time point: 12 h). Data are presented as mean ± SD, n = 5. *p < 0.05, **p < 0.01, ***p < 0.001, ****p < 0.0001 vs. control group; #p < 0.05, ##p < 0.01, ###p < 0.001, ####p < 0.0001 vs. LPS group.
FIGURE 3
FIGURE 3
MaR1 attenuated oxidative stress and protected mitochondrial quality in the kidneys of lipopolysaccharide (LPS)-induced S-AKI mice. (A) The levels of malondialdehyde and superoxide dismutase of renal tissues in each group of mice were detected using assay kits. (B) Reactive oxygen species were assessed in situ by staining (scale bar = 50 μm). (C) The relative complex I activity of renal tissues in each group of mice was evaluated using assay kits. (D) The ATP production of renal tissues was detected using assay kits. (E) Photomicrographs were collected by transmission electron microscopy (1k and 3k). (F) The gene expression ratio of DRP-1/OPA-1 in renal tissues was quantitated using qRT-PCR. (G) The expressions of DRP-1, MFN-1, and OPA-1 in renal tissues were analyzed using Western blot. (H) The protein levels of DRP-1, MFN-1, and OPA-1 were quantified by densitometry and normalized with GAPDH (time point: 12 h). Data are presented as mean ± SD, n = 5. *p < 0.05, **p < 0.01, ***p < 0.001, ****p < 0.0001 vs Control group; #p < 0.05, ##p < 0.01, ###p < 0.001, ####p < 0.0001 vs LPS group.
FIGURE 4
FIGURE 4
MaR1 inhibited NOX4 expression and NF-κB pathway activation in the kidneys of lipopolysaccharide (LPS)-induced S-AKI mice. (A) Representative immunohistochemistry images of NOX4 in renal sections were collected (scale bar = 50 μm). (B) Average optical density of NOX4. (C) The expression of NOX4 in renal tissues was analyzed using Western blot. (D) The protein level of NOX4 was quantified by densitometry and normalized with GAPDH. (E) The expressions of p-IκBα, IκBα, p-P65, and P65 in renal tissues were analyzed using Western blot. (F) The protein levels of p-IκBα/IκBα and p-P65/P65 were quantified by densitometry and normalized with GAPDH (time point: 12 h). Data are presented as mean ± SD, n = 5. *p < 0.05, **p < 0.01, ***p < 0.001, ****p < 0.0001 vs. control group; #p < 0.05, ##p < 0.01, ###p < 0.001, ####p < 0.0001 vs. LPS group.
FIGURE 5
FIGURE 5
MaR1 promoted cell survival and prevented the inflammation and apoptosis of lipopolysaccharide (LPS)-stimulated TCMK-1 cells. (A) The effects of LPS (100 μg/ml) and MaR1 (1, 10, 100, and 1,000 nM) on TCMK-1 cells were determined using CCK-8. (B) The gene expression of NGAL in TCMK-1 cells was quantitated using qRT-PCR. (C) The cell supernatant levels of IL-6 and TNF-α, and IL-1β were determined using assay kits in each group of TCMK-1 cells. (D) The gene expressions of TNF-α, IL-6, and MCP-1 in TCMK-1 cells were quantitated using qRT-PCR. (E) The expressions of TNF-α, IL-6, and MCP-1 in TCMK-1 cells were analyzed using Western blot. (F) The protein levels of TNF-α, IL-6, and MCP-1 were normalized with GAPDH. (G) Flow cytometry analysis of apoptosis using Annexin V-FITC and PI staining. (H) Percentage of apoptosis in each group of TCMK-1 cells. (I) The gene expression ratio of BAX/BCL-2 in TCMK-1 cells was quantitated using qRT-PCR. (J) The expressions of BAX, BCL-2, and C Casp-3 in TCMK-1 cells were analyzed using Western blot. (K) The protein levels of BAX, BCL-2, and C Casp-3 were normalized with GAPDH. (L) TUNEL staining (scale bar = 50 μm), percentage of TUNEL-positive cells (%), and immunofluorescence staining of C Casp-3 expression (scale bar = 20 μm) of TCMK-1 cells (time point: 24 h). Data are presented as mean ± SD, n = 5. *p < 0.05, **p < 0.01, ***p < 0.001, ****p < 0.0001 vs. control group; #p < 0.05, ##p < 0.01, ###p < 0.001, ####p < 0.0001 vs. LPS group.
FIGURE 6
FIGURE 6
MaR1 preserved the mitochondrial quality and reduced the reactive oxygen species (ROS) levels of lipopolysaccharide (LPS)-stimulated TCMK-1 cells. (A) Representative pictures of JC-I staining of TCMK-1 cells (scale bar = 50 μm). (B) Flow cytometry analysis of MMP using JC-1 staining. (C) Red/green fluorescence ratio of JC-1 staining of TCMK-1 cells in each group. (D) The ROS levels of TCMK-1 cells were determined by flow cytometry. (E) ROS relative ratio of TCMK-1 cells in each group. (F) The gene expression ratio of DRP-1/OPA-1 in TCMK-1 cells was quantitated using qRT-PCR. (G) The expressions of DRP-1, MFN-1, and OPA-1 in TCMK-1 cells were analyzed using Western blot. (H) The protein levels of DRP-1, MFN-1, and OPA-1 were quantified by densitometry and normalized with GAPDH (time point: 24 h). Data are presented as mean ± SD, n = 5. *p < 0.05, **p < 0.01, ***p < 0.001, ****p < 0.0001 vs. control group; #p < 0.05, ##p < 0.01, ###p < 0.001, ####p < 0.0001 vs. LPS group.
FIGURE 7
FIGURE 7
MaR1 suppressed NOX4 expression and NF-κB pathway activation of lipopolysaccharide (LPS)-stimulated TCMK-1 cells. (A) The expression of NOX4 in TCMK-1 cells was analyzed using Western blot. (B) The protein level of NOX4 in TCMK-1 cells was quantified by densitometry and normalized with GAPDH. (C) The expressions of p-IκBα, IκBα, p-P65, and P65 in TCMK-1 cells were analyzed using Western blot. (D) The protein levels of p-IκBα/IκBα and p-P65/P65 were quantified by densitometry and normalized with GAPDH (time point: 24 h). Data are presented as mean ± SD, n = 5. *p < 0.05, **p < 0.01, ***p < 0.001, ****p < 0.0001 vs. control group; #p < 0.05, ##p < 0.01, ###p < 0.001, ####p < 0.0001 vs. LPS group.

Similar articles

Cited by

References

    1. Bagshaw S. M., Uchino S., Bellomo R., Morimatsu H., Morgera S., Schetz M., et al. (2007). Septic Acute Kidney Injury in Critically Ill Patients: Clinical Characteristics and Outcomes. Clin. J. Am. Soc. Nephrol. 2 (3), 431–439. 10.2215/cjn.03681106 - DOI - PubMed
    1. Bhargava P., Schnellmann R. G. (2017). Mitochondrial Energetics in the Kidney. Nat. Rev. Nephrol. 13 (10), 629–646. 10.1038/nrneph.2017.107 - DOI - PMC - PubMed
    1. Bouchard J., Acharya A., Cerda J., Maccariello E. R., Madarasu R. C., Tolwani A. J., et al. (2015). A Prospective International Multicenter Study of AKI in the Intensive Care Unit. Clin. J. Am. Soc. Nephrol. 10 (8), 1324–1331. 10.2215/cjn.04360514 - DOI - PMC - PubMed
    1. Brooks C., Wei Q., Cho S. G., Dong Z. (2009). Regulation of Mitochondrial Dynamics in Acute Kidney Injury in Cell Culture and Rodent Models. J. Clin. Invest. 119 (5), 1275–1285. 10.1172/jci37829 - DOI - PMC - PubMed
    1. Chatterjee A., Sharma A., Chen M., Toy R., Mottola G., Conte M. S. (2014). The Pro-resolving Lipid Mediator Maresin 1 (MaR1) Attenuates Inflammatory Signaling Pathways in Vascular Smooth Muscle and Endothelial Cells. PLoS One 9 (11), e113480. 10.1371/journal.pone.0113480 - DOI - PMC - PubMed