. 2021 Dec 10:12:772651.
doi: 10.3389/fmicb.2021.772651. eCollection 2021.

Flow Cytometric Analysis of Bacterial Protein Synthesis: Monitoring Vitality After Water Treatment

Affiliations

Flow Cytometric Analysis of Bacterial Protein Synthesis: Monitoring Vitality After Water Treatment

Mathilde Lindivat et al. Front Microbiol. .

Abstract

Bacterial vitality after water disinfection treatment was investigated using bio-orthogonal non-canonical amino acid tagging (BONCAT) and flow cytometry (FCM). Protein synthesis activity and DNA integrity (BONCAT-SYBR Green) was monitored in Escherichia coli monocultures and in natural marine samples after UV irradiation (from 25 to 200 mJ/cm2) and heat treatment (from 15 to 45 min at 55°C). UV irradiation of E. coli caused DNA degradation followed by the decrease in protein synthesis within a period of 24 h. Heat treatment affected both DNA integrity and protein synthesis immediately, with an increased effect over time. Results from the BONCAT method were compared with results from well-known methods such as plate counts (focusing on growth) and LIVE/DEAD™ BacLight™ (focusing on membrane permeability). The methods differed somewhat with respect to vitality levels detected in bacteria after the treatments, but the results were complementary and revealed that cells maintained metabolic activity and membrane integrity despite loss of cell division. Similarly, analysis of protein synthesis in marine bacteria with BONCAT displayed residual activity despite inability to grow or reproduce. Background controls (time zero blanks) prepared using different fixatives (formaldehyde, isopropanol, and acetic acid) and several different bacterial strains revealed that the BONCAT protocol still resulted in labeled, i.e., apparently active, cells. The reason for this is unclear and needs further investigation to be understood. Our results show that BONCAT and FCM can detect, enumerate, and differentiate bacterial cells after physical water treatments such as UV irradiation and heating. The method is reliable to enumerate and explore vitality of single cells, and a great advantage with BONCAT is that all proteins synthesized within cells are analyzed, compared to assays targeting specific elements such as enzyme activity.

Keywords: BONCAT; UV irradiation; bacteria; flow cytometry; heat treatment; vitality; water analysis.


Conflict of interest statement

The authors declare that the research was conducted in the absence of any commercial or financial relationships that could be construed as a potential conflict of interest.

Figures

FIGURE 1
FIGURE 1
Overview of the experimental setup. Escherichia coli was diluted in 1x PBS to a final concentration of 106–107 bacteria/ml. Seawater was directly analyzed after 100 μm prefiltering. Different treatments were applied: UV irradiation with UV doses of 25, 50, 75, 100, and 200 mJ/cm2; heat treatment at 55°C for 15, 30, and 45 min. Controls without treatment were incubated with HPG (positive control) and without HPG (negative control). Dead controls with fixed cells (DF) and heat inactivation (3 min at 80°C) (DT) were added for comparison. Samples were analyzed with plate counts, LIVE/DEAD® BacLight™ staining with PI/SYTO9, and BONCAT.
FIGURE 2
FIGURE 2
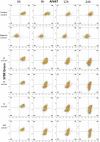
Flow cytometry dot plots of E. coli cells treated with UV irradiation. Effects of UV doses of 25, 50, 75, and 100 mJ/m2 on E. coli were monitored for degradation of DNA and for protein production at 0, 6, 12, and 24 h after treatment. Cells were stained with SYBR Green for DNA detection and AF647 for BONCAT. Between 5,000 and 10,000 cells were analyzed in each dot plot. Quadrant gates were designed from positive and negative HPG control with Q1: dead cells, the presence of intact DNA, negative BONCAT activity; Q2: live cells, the presence of intact DNA, positive BONCAT activity; Q3: dead cells, damaged DNA, negative BONCAT activity; and Q4: damaged cells with damaged DNA and positive BONCAT activity. The results of UV dose of 200 mJ/m2 are not included as they present similar pattern as lower UV doses.
FIGURE 3
FIGURE 3
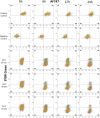
Flow cytometry dot plots of E. coli cells treated with heat. The effects of exposure of E. coli cells to 55°C for 15, 30, and 45 min were monitored for degradation of DNA and for protein production at 0, 6, 12, and 24 h after treatment. The control samples are the same as those used in the UV experiment (Figure 2). Cells were stained with SYBR Green for DNA detection and AF647 for BONCAT. Between 5,000 and 10,000 cells were analyzed in each dot plot. Gates are identical to those used in Figure 2.
FIGURE 4
FIGURE 4
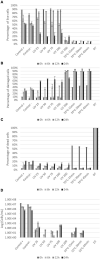
Percentage of live (A), damaged (B), and dead (C) E. coli with LIVE/DEAD® BacLight™ staining at 0, 6, 12, and 24 h after treatments. Plate counts (D) of E. coli at 0, 6, 12, and 24 h after treatments. X-axis show the different treatments the cells are exposed to, whereas the y-axis is the percentage of cells (A–C) or CFU count in log (cell/ml) (D). Notice that small variations between samples are to be expected since the distinction between live and damaged cells can be difficult to define and will be affected by variations in staining.
FIGURE 5
FIGURE 5
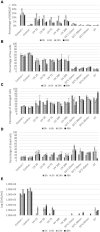
Seawater vitality analysis after treatment: (A) Histogram presenting protein synthesis activity of seawater bacterial communities after UV and heat treatments; (B–D) percentage of live, damaged, and dead cells by LIVE/DEAD® BacLight™ staining. FCM analysis was carried out on 500–1,000 cells at 0, 6, 24, and 48 h after treatments; (E) plate counts from seawater communities at 0, 6, 24, and 48 h after treatments. X-axis shows the different treatments and controls and y-axis represents CFU counts in log (cell/ml).
FIGURE 6
FIGURE 6
Flow cytometry dot plots of Yersinia ruckeri. Cells were treated with acetic acid 7%, 70% isopropanol and fixation with formaldehyde to obtain dead populations. Positive and negative HPG controls were carried out for comparison. All treatments presented a positive protein synthesis activity.
FIGURE 7
FIGURE 7
Effect of different fixatives on HPG uptake in different bacteria. Positive HPG is live cells incubated with HPG, whereas negative HPG is the control sample incubated without HPG. The results for the different fixatives are expressed in percentage of active bacteria (number of positive HPG cells). The percentages were obtained by dividing the positive BONCAT cells (Q2) by the total cell number obtained from SYBR Green staining (Q1+Q2).

References

    1. Allen M. J., Edberg S. C., Reasoner D. J. (2004). Heterotrophic plate count bacteria—what is their significance in drinking water? Int. J. Food Microbiol. 92 265–274. 10.1016/j.ijfoodmicro.2003.08.017 - DOI - PubMed
    1. Ayrapetyan M., Oliver J. D. (2016). The viable but non-culturable state and its relevance in food safety. Curr. Opin. Food Sci. 8 127–133.
    1. Berney M., Hammes F., Bosshard F., Weilenmann H.-U., Egli T. (2007). Assessment and interpretation of bacterial viability by using the LIVE/DEAD BacLight Kit in combination with flow cytometry. Appl. Environ. Microbiol. 73 3283–3290. 10.1128/AEM.02750-06 - DOI - PMC - PubMed
    1. Berney M., Vital M., Hülshoff I., Weilenmann H.-U., Egli T., Hammes F. (2008). Rapid, cultivation-independent assessment of microbial viability in drinking water. Water Res. 42 4010–4018. 10.1016/j.watres.2008.07.017 - DOI - PubMed
    1. Berney M., Weilenmann H.-U., Egli T. (2006). Flow-cytometric study of vital cellular functions in Escherichia coli during solar disinfection (SODIS). Microbiology 152 1719–1729. 10.1099/mic.0.28617-0 - DOI - PubMed

LinkOut - more resources