

Transcriptomics Integrated With Metabolomics Reveal the Effects of Ultraviolet-B Radiation on Flavonoid Biosynthesis in Antarctic Moss
- PMID: 34956286
- PMCID: PMC8692278
- DOI: 10.3389/fpls.2021.788377
Transcriptomics Integrated With Metabolomics Reveal the Effects of Ultraviolet-B Radiation on Flavonoid Biosynthesis in Antarctic Moss
Abstract
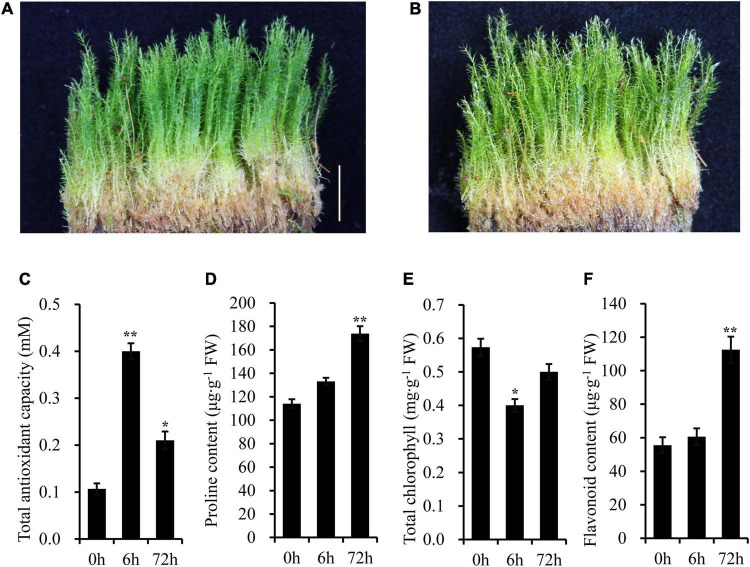
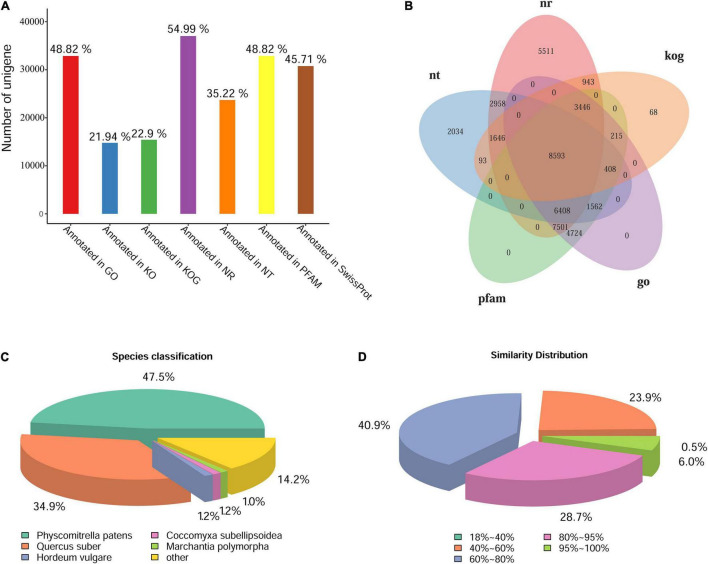
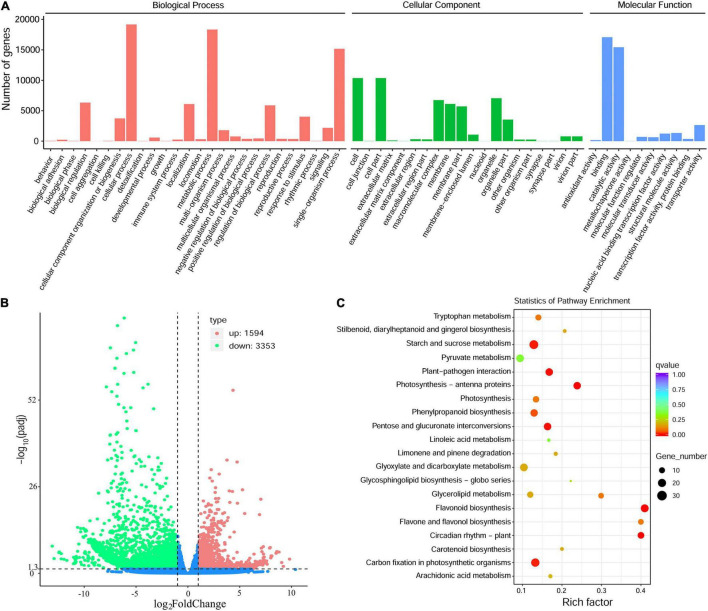
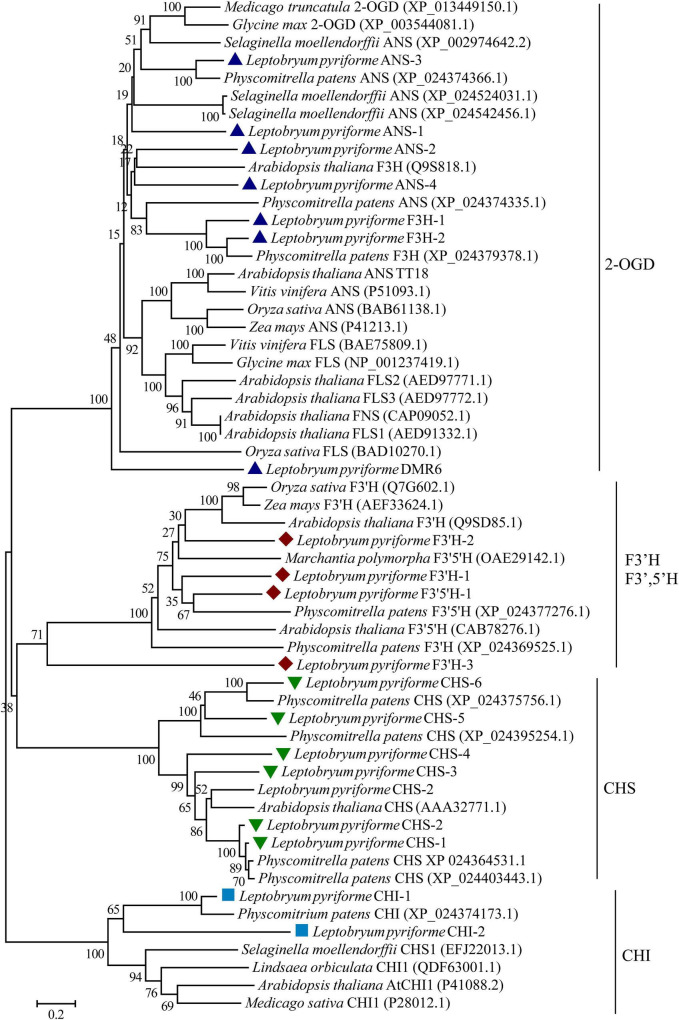
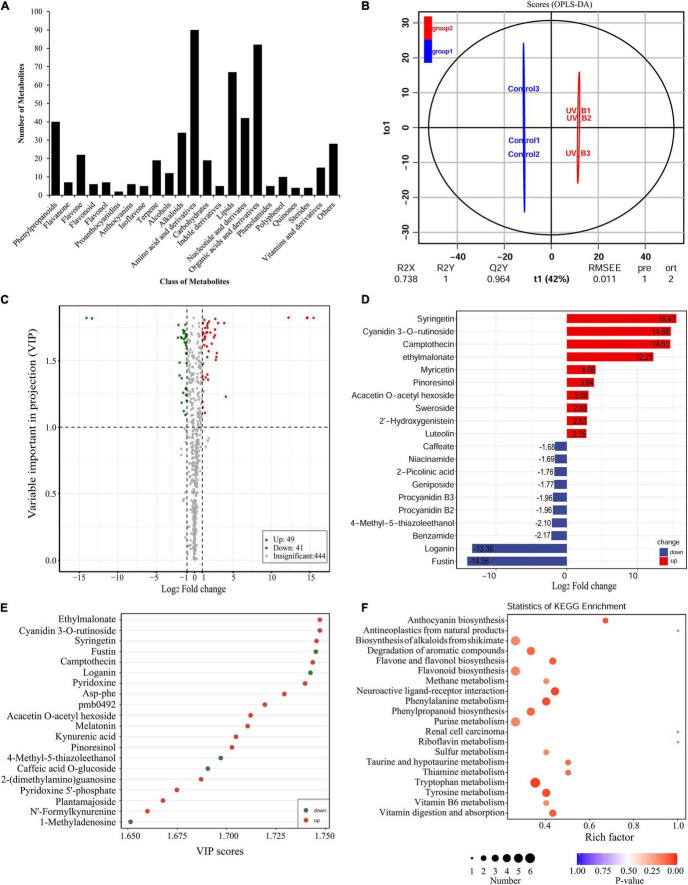
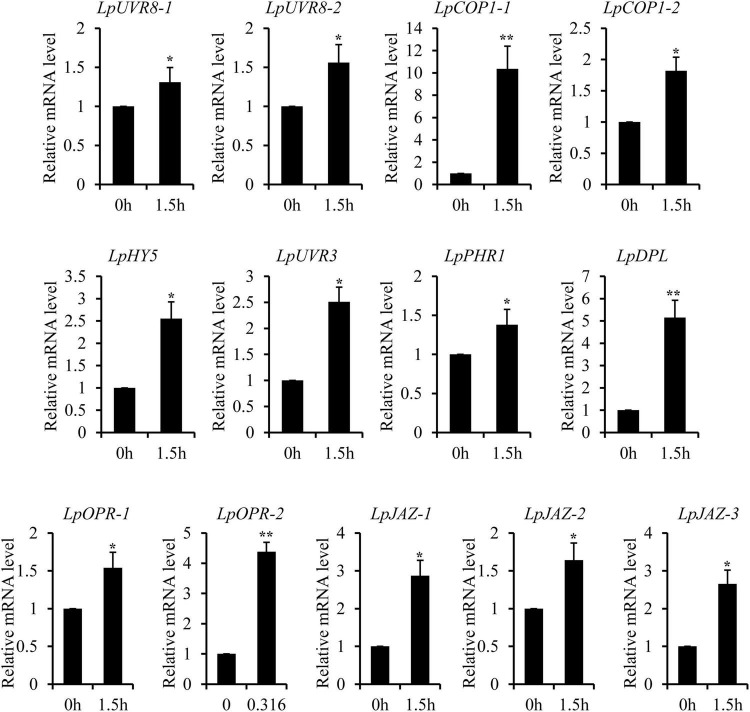
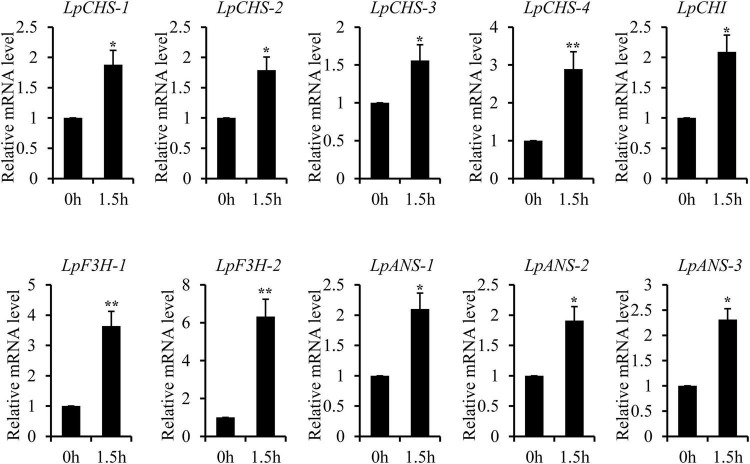
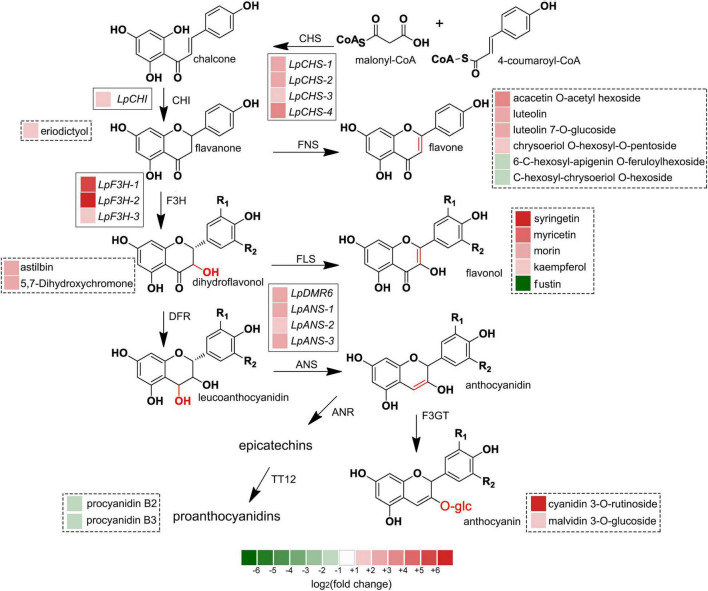
Bryophytes are the dominant vegetation in the Antarctic continent. They have suffered more unpleasant ultraviolet radiation due to the Antarctic ozone layer destruction. However, it remains unclear about the molecular mechanism of Antarctic moss acclimation to UV-B light. Here, the transcriptomics and metabolomics approaches were conducted to uncover transcriptional and metabolic profiling of the Antarctic moss Leptobryum pyriforme under UV-B radiation. Totally, 67,290 unigenes with N50 length of 2,055 bp were assembled. Of them, 1,594 unigenes were significantly up-regulated and 3353 unigenes were markedly down-regulated under UV-B radiation. These differentially expressed genes (DEGs) involved in UV-B signaling, flavonoid biosynthesis, ROS scavenging, and DNA repair. In addition, a total of 531 metabolites were detected, while flavonoids and anthocyanins accounted for 10.36% of the total compounds. There were 49 upregulated metabolites and 41 downregulated metabolites under UV-B radiation. Flavonoids were the most significantly changed metabolites. qPCR analysis showed that UVR8-COP1-HY5 signaling pathway genes and photolyase genes (i.e., LpUVR3, LpPHR1, and LpDPL) were significantly up-regulated under UV-B light. In addition, the expression levels of JA signaling pathway-related genes (i.e., OPR and JAZ) and flavonoid biosynthesis-related genes were also significantly increased under UV-B radiation. The integrative data analysis showed that UVR8-mediated signaling, jasmonate signaling, flavonoid biosynthesis pathway and DNA repair system might contribute to L. pyriforme acclimating to UV-B radiation. Therefore, these findings present a novel knowledge for understanding the adaption of Antarctic moss to polar environments and provide a foundation for assessing the impact of global climate change on Antarctic land plants.
Keywords: abiotic stress; bryophytes; flavonoids; metabolome; transcriptome; ultraviolet-B radiation.
Copyright © 2021 Liu, Fang, Liu, Zhao, Cong and Zhang.
Conflict of interest statement
The authors declare that the research was conducted in the absence of any commercial or financial relationships that could be construed as a potential conflict of interest.
Figures
Similar articles
-
Transcriptional profiling and physiological analysis reveal the critical roles of ROS-scavenging system in the Antarctic moss Pohlia nutans under Ultraviolet-B radiation.Plant Physiol Biochem. 2019 Jan;134:113-122. doi: 10.1016/j.plaphy.2018.10.034. Epub 2018 Nov 9. Plant Physiol Biochem. 2019. PMID: 30448024
-
Integrated transcriptome and metabolome analyses reveal the adaptation of Antarctic moss Pohlia nutans to drought stress.Front Plant Sci. 2022 Aug 11;13:924162. doi: 10.3389/fpls.2022.924162. eCollection 2022. Front Plant Sci. 2022. PMID: 36035699 Free PMC article.
-
Genome-Wide Analysis of Long Non-Coding RNAs Related to UV-B Radiation in the Antarctic Moss Pohlia nutans.Int J Mol Sci. 2023 Mar 17;24(6):5757. doi: 10.3390/ijms24065757. Int J Mol Sci. 2023. PMID: 36982830 Free PMC article.
-
Perception and Signaling of Ultraviolet-B Radiation in Plants.Annu Rev Plant Biol. 2021 Jun 17;72:793-822. doi: 10.1146/annurev-arplant-050718-095946. Epub 2021 Feb 26. Annu Rev Plant Biol. 2021. PMID: 33636992 Review.
-
Depletion of stratospheric ozone over the Antarctic and Arctic: responses of plants of polar terrestrial ecosystems to enhanced UV-B, an overview.Environ Pollut. 2005 Oct;137(3):428-42. doi: 10.1016/j.envpol.2005.01.048. Epub 2005 Apr 21. Environ Pollut. 2005. PMID: 16005756 Review.
Cited by
-
A Moss 2-Oxoglutarate/Fe(II)-Dependent Dioxygenases (2-ODD) Gene of Flavonoids Biosynthesis Positively Regulates Plants Abiotic Stress Tolerance.Front Plant Sci. 2022 Jul 29;13:850062. doi: 10.3389/fpls.2022.850062. eCollection 2022. Front Plant Sci. 2022. PMID: 35968129 Free PMC article.
-
Insights into the Jasmonate Signaling in Basal Land Plant Revealed by the Multi-Omics Analysis of an Antarctic Moss Pohlia nutans Treated with OPDA.Int J Mol Sci. 2022 Nov 4;23(21):13507. doi: 10.3390/ijms232113507. Int J Mol Sci. 2022. PMID: 36362295 Free PMC article.
-
De Novo Transcriptome Assembly and Comparative Analysis of Differentially Expressed Genes Involved in Cold Acclimation and Freezing Tolerance of the Arctic Moss Aulacomnium turgidum (Wahlenb.) Schwaegr.Plants (Basel). 2023 Mar 9;12(6):1250. doi: 10.3390/plants12061250. Plants (Basel). 2023. PMID: 36986936 Free PMC article.
-
Transcriptome analysis of the common moss Bryum pseudotriquetrum grown under Antarctic field condition.AoB Plants. 2024 Aug 10;16(5):plae043. doi: 10.1093/aobpla/plae043. eCollection 2024 Oct. AoB Plants. 2024. PMID: 39347487 Free PMC article.
-
Metabolites and Plant Hormones Related to the Resistance Response to Feeding Stimulation and Leaf Clipping Control in Chinese Pine (Pinus tabuliformis Carr.).Curr Issues Mol Biol. 2023 Jan 30;45(2):1086-1099. doi: 10.3390/cimb45020072. Curr Issues Mol Biol. 2023. PMID: 36826017 Free PMC article.
References
LinkOut - more resources
Full Text Sources