. 2021 Dec 10:9:723978.
doi: 10.3389/fcell.2021.723978. eCollection 2021.

Disruption of Folate Metabolism Causes Poor Alignment and Spacing of Mouse Conceptuses for Multiple Generations

Affiliations

Disruption of Folate Metabolism Causes Poor Alignment and Spacing of Mouse Conceptuses for Multiple Generations

Amy L Wilkinson et al. Front Cell Dev Biol. .

Abstract

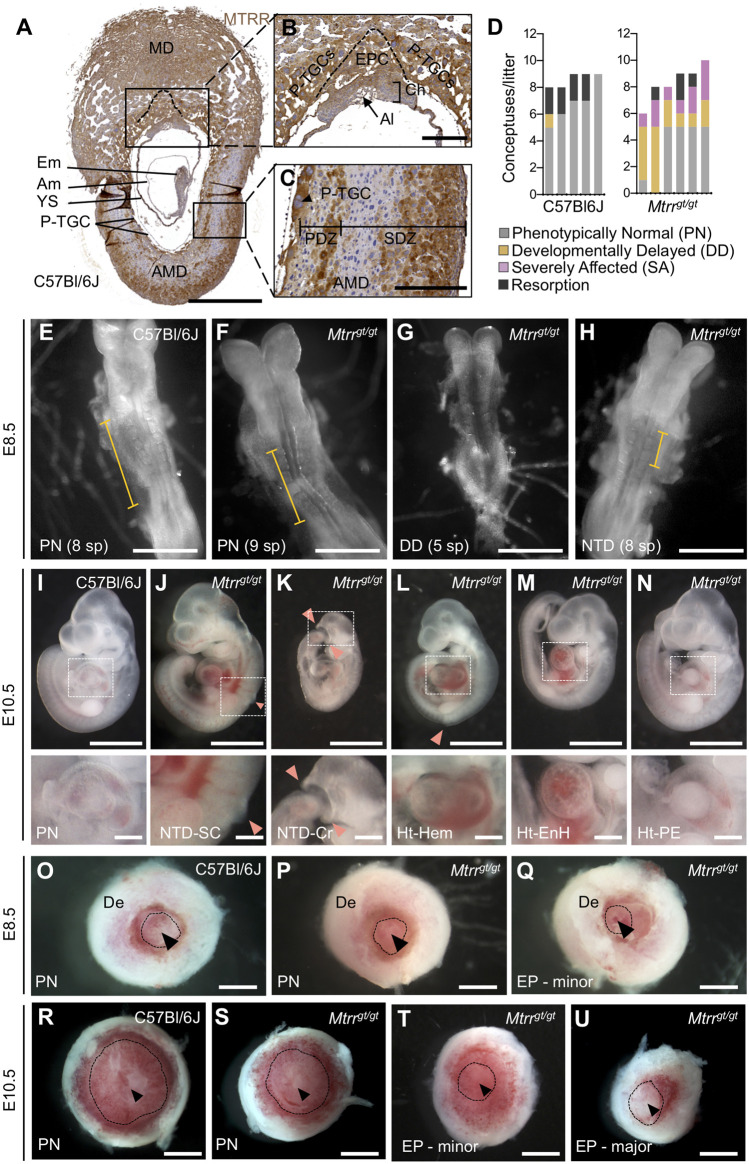
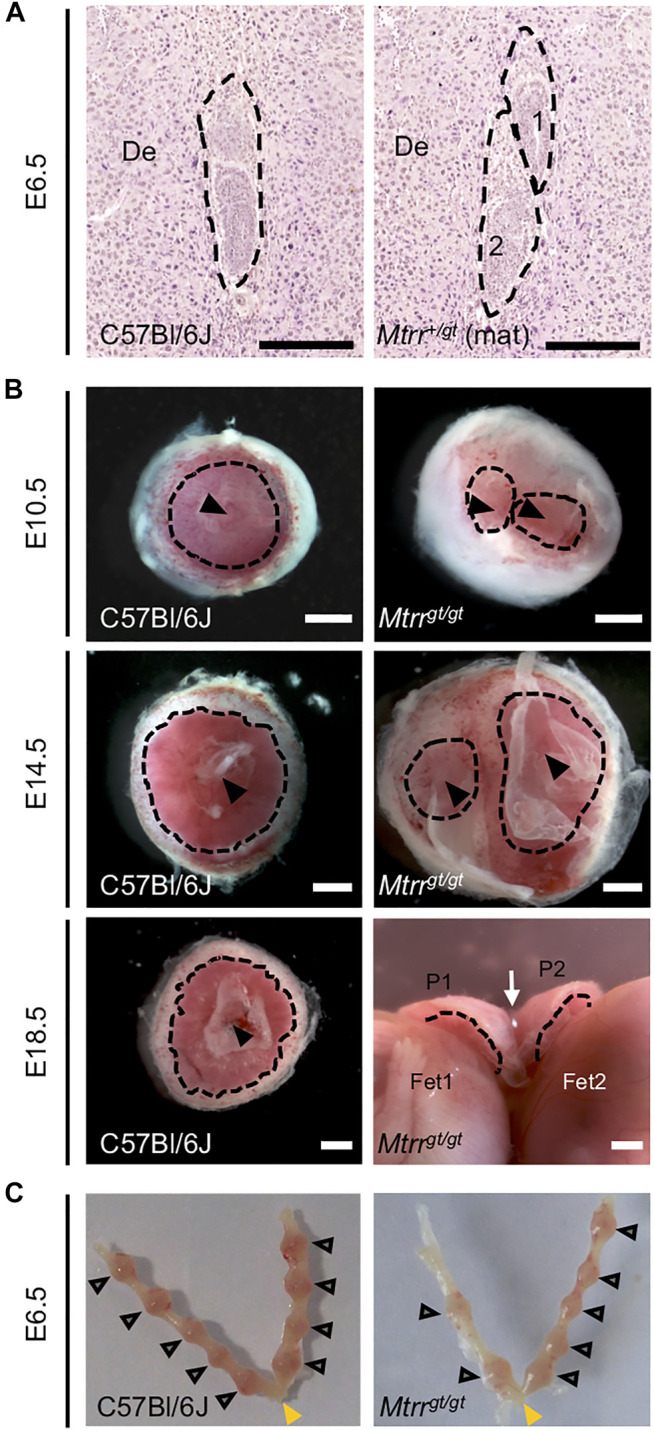
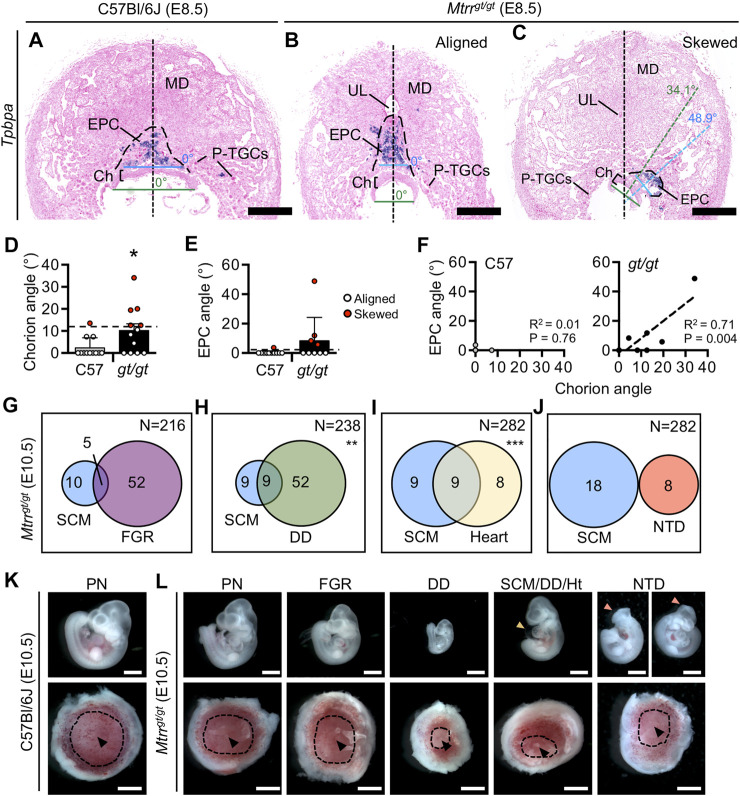
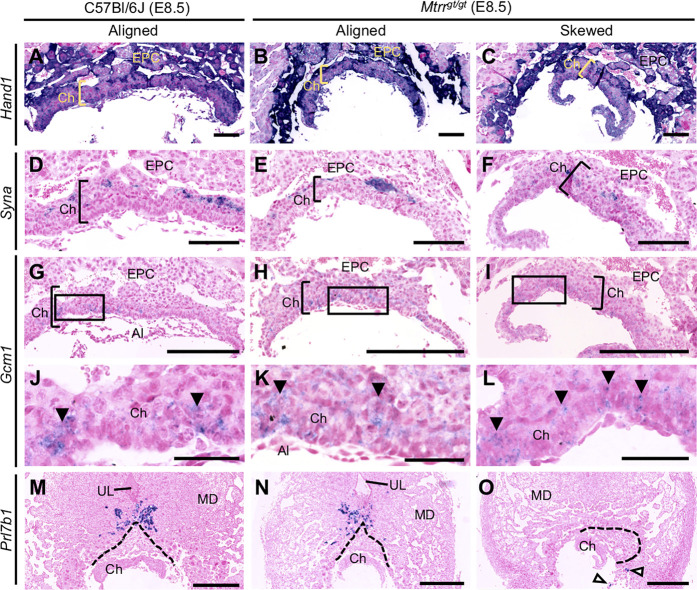
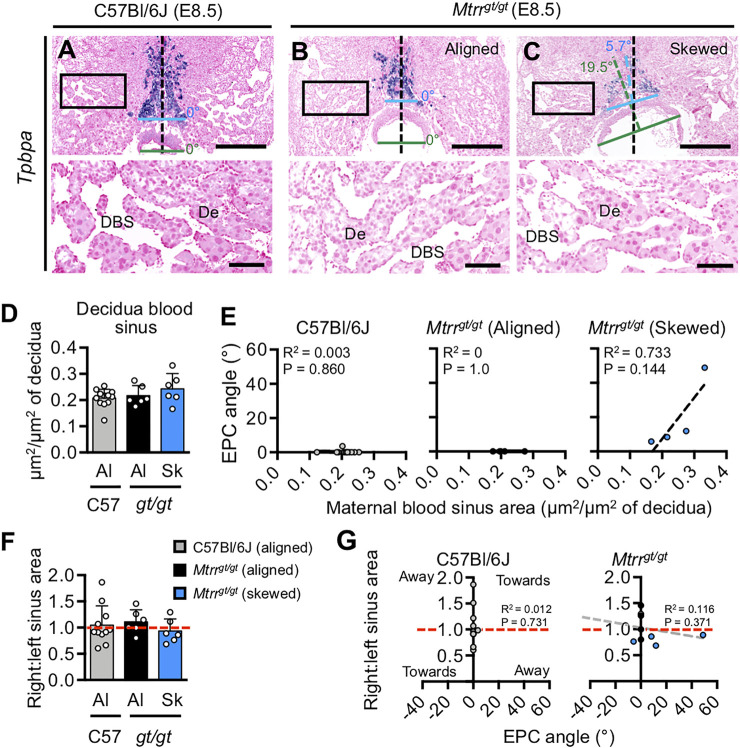
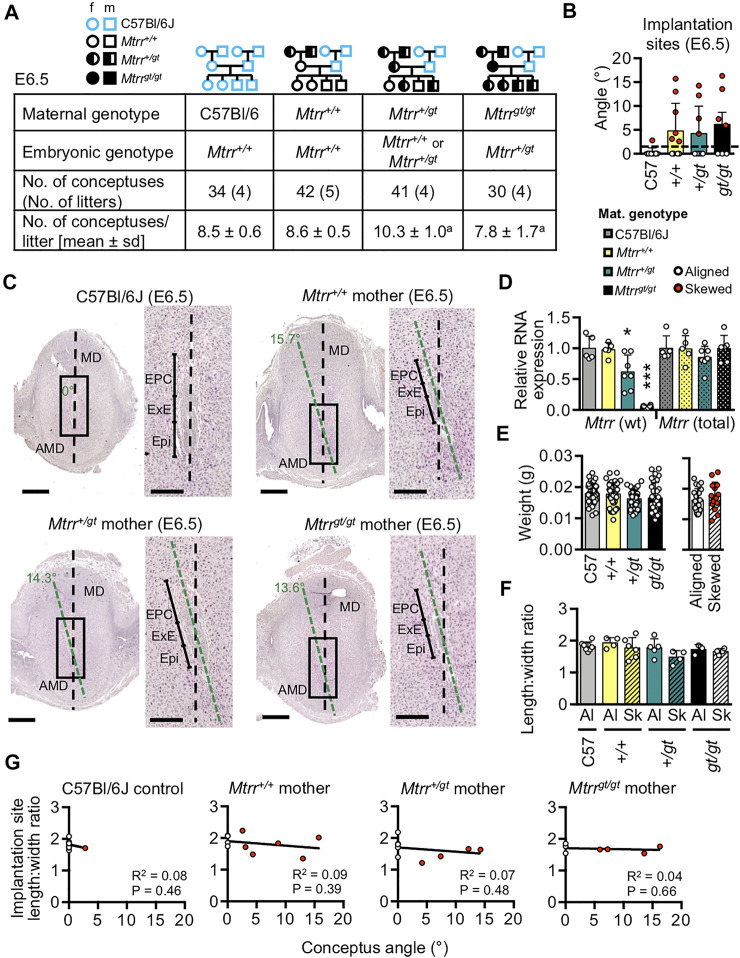
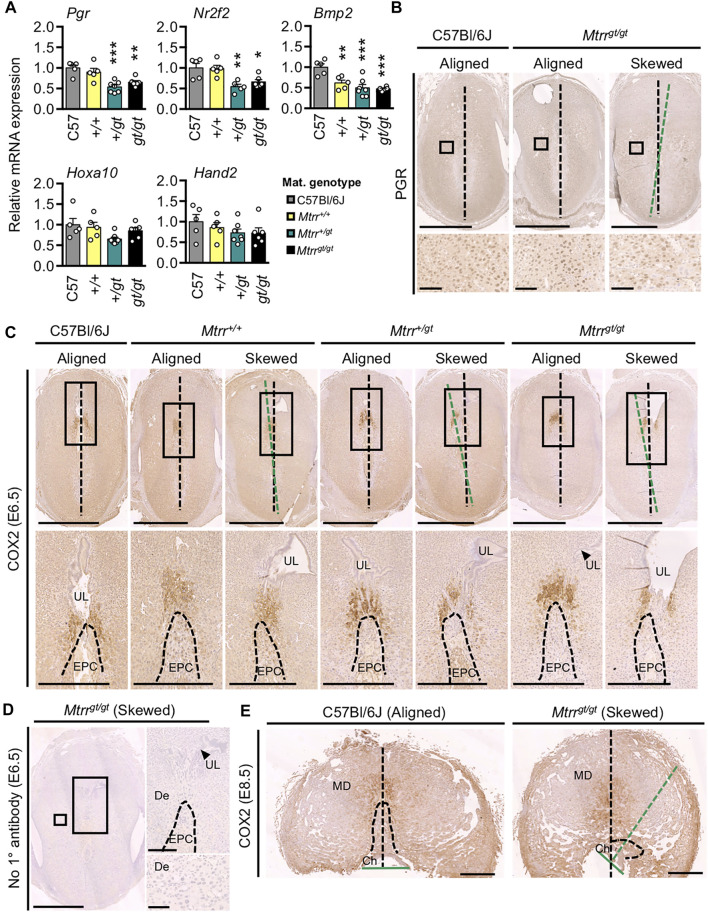
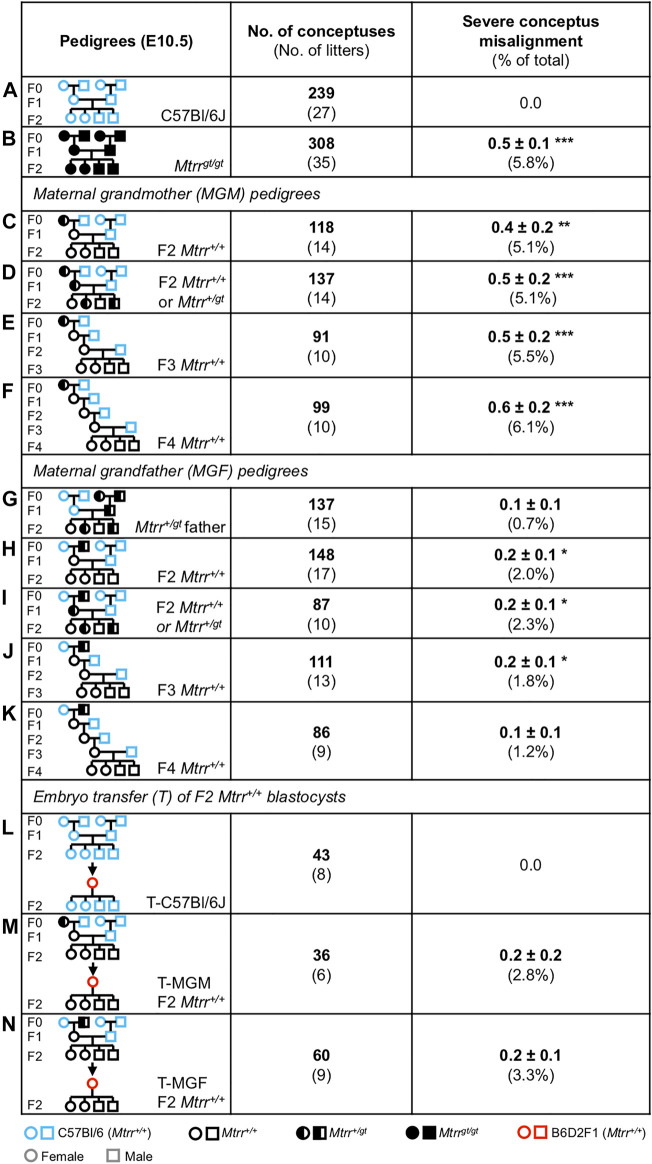
Abnormal uptake or metabolism of folate increases risk of human pregnancy complications, though the mechanism is unclear. Here, we explore how defective folate metabolism influences early development by analysing mice with the hypomorphic Mtrr gt mutation. MTRR is necessary for methyl group utilisation from folate metabolism, and the Mtrr gt allele disrupts this process. We show that the spectrum of phenotypes previously observed in Mtrr gt/gt conceptuses at embryonic day (E) 10.5 is apparent from E8.5 including developmental delay, congenital malformations, and placental phenotypes. Notably, we report misalignment of some Mtrr gt conceptuses within their implantation sites from E6.5. The degree of misorientation occurs across a continuum, with the most severe form visible upon gross dissection. Additionally, some Mtrr gt/gt conceptuses display twinning. Therefore, we implicate folate metabolism in blastocyst orientation and spacing at implantation. Skewed growth likely influences embryo development since developmental delay and heart malformations (but not defects in neural tube closure or trophoblast differentiation) associate with severe misalignment of Mtrr gt/gt conceptuses. Typically, the uterus is thought to guide conceptus orientation. To investigate a uterine effect of the Mtrr gt allele, we manipulate the maternal Mtrr genotype. Misaligned conceptuses were observed in litters of Mtrr +/+ , Mtrr +/gt , and Mtrr gt/gt mothers. While progesterone and/or BMP2 signalling might be disrupted, normal decidual morphology, patterning, and blood perfusion are evident at E6.5 regardless of conceptus orientation. These observations argue against a post-implantation uterine defect as a cause of conceptus misalignment. Since litters of Mtrr +/+ mothers display conceptus misalignment, a grandparental effect is explored. Multigenerational phenotype inheritance is characteristic of the Mtrr gt model, though the mechanism remains unclear. Genetic pedigree analysis reveals that severe conceptus skewing associates with the Mtrr genotype of either maternal grandparent. Moreover, the presence of conceptus skewing after embryo transfer into a control uterus indicates that misalignment is independent of the peri- and/or post-implantation uterus and instead is likely attributed to an embryonic mechanism that is epigenetically inherited. Overall, our data indicates that abnormal folate metabolism influences conceptus orientation over multiple generations with implications for subsequent development. This study casts light on the complex role of folate metabolism during development beyond a direct maternal effect.

Keywords: MTRR; conceptus misalignment; decidua; grandparental effect; transgenerational epigenetic inheritance; trophoblast; twinning.


Conflict of interest statement

The authors declare that the research was conducted in the absence of any commercial or financial relationships that could be construed as a potential conflict of interest.

Figures

FIGURE 1
FIGURE 1
Spectrum of phenotypes observed in Mtrr gt/gt mouse conceptuses at E8.5 and E10.5. (AC) MTRR protein expression (brown) in a wildtype C57Bl/6J implantation site at E8.5. DNA, blue. Boxed regions in (A) shown at higher magnification in (B,C). N = 5 implantation sites, three technical replicates. Dashed line, boundary between EPC and P-TGCs. (D) Graph depicting the frequency of phenotypes per litter at E8.5 from C57Bl/6J control crosses and Mtrr gt/gt crosses. Each bar represents one litter. Grey, phenotypically normal; black, resorption; yellow, developmental delay (<6 somite pairs); pink, severely affected. See also Table 1. (EH) Images of (E) C57Bl/6J and (FH) Mtrr gt/gt embryos captured at E8.5 from (E,F) phenotypically normal (PN), (G) developmentally delayed (DD), or (H) severely affected (SA) conceptuses. The Mtrr gt/gt embryo in (H) displays a neural tube with delayed closure. Yellow bar indicates the length of neural plate that has closed into a tube. (IN) Images of (I) phenotypically normal (PN) C57Bl/6J embryos at E10.5 and (JN) severely affected Mtrr gt/gt embryos at E10.5 displaying (J–L) neural tube closure defects (pink arrowhead) in the (J,L) spinal cord region or (K) cranial region, or (LN) heart malformations including (L) hemorrhage, (M) pericardial edema, or (N) an enlarged heart. Box depicts region of higher magnification directly below. (OU) Images of placentas from (O,R) C57Bl/6J and (P,Q,SU) Mtrr gt/gt conceptuses (OQ) at E8.5 and (RU) at E10.5 that were phenotypically normal (PN) or eccentrically located (EP). Dashed line, approximate outline of chorion. Black arrowhead, region of allantois attachment. Scale bars: (A,OU) 1 mm, (B,C) 250 μm, (EH): 500 μm, (IN) low magnification, 500 μm, high magnification, 100 μm. Al, allantois; Am, amnion; AMD, antimesometrial decidua; Ch, chorion; Cr, cranial; De, decidua; Em, embryo proper; EnH, enlarged heart; EP, eccentric placenta (severe conceptus misalignment); EPC, ectoplacental cone; Hem, hemorrhage; Ht, heart defect; MD, mesometrial decidua; NTD, neural tube defect; PDZ, primary decidual zone; PE, pericardial edema; P-TGCs, parietal trophoblast giant cells; SC, spinal cord; SDZ, secondary decidual zone; sp, somite pairs; YS, yolk sac.
FIGURE 2
FIGURE 2
Twinning observed in Mtrr gt/gt mouse conceptuses across gestation. (A,B) Images depicting twinning at specific stages of development. (A) Histological sections of a C57Bl/6J implantation site at E6.5 with a single conceptus (dashed outline, left-hand image) and of an implantation site at E6.5 with two conceptuses (dashed outlines, right-hand image) derived from Mtrr +/gt mother (Mtrr +/gt mat) and C57Bl/6J father. Scale bar, 250 μm. (B) Whole placentas from singleton C57Bl/6J conceptuses (left-hand images) and twinned Mtrr gt/gt conceptuses (right-hand images) at E10.5, E14.5 and E18.5. Placentas viewed from the fetal-facing chorionic plate. Black dotted line, approximate outline of labryinth; black arrowhead, allantois attachment site; white arrow indicates where the placentas at E18.5 are fused. De, decidua; P, placenta; Fet, fetus. Scale bars, 1 mm. (C) Dissected uteri at E6.5 showing normal conceptus spacing in C57Bl/6J and Mtrr gt/gt litters. Grey arrowheads, individual implantation sites. Yellow arrowhead, cervix.
FIGURE 3
FIGURE 3
Mtrr gt/gt mouse conceptuses at E8.5 demonstrate misaligned orientation with incomplete penetrance. (AC) Histological sections of placentas at E8.5 from (A) a C57Bl/6J conceptus and (B,C) Mtrr gt/gt conceptuses with (B) aligned or (C) skewed orientation. Ectoplacental cone (EPC, outer boundary indicated by dashed line) is depicted by Tpbpa mRNA expression (purple) as determined via in situ hybridization. Black dotted line, bisection of placenta. Green dotted line, bisection of the chorion. Blue dotted line, bisection of the EPC. The angle between the line bisecting the placenta and the chorion or EPC is shown. (D,E) Data showing the average (mean ± s.d.) (D) chorion angle or (E) EPC angle in C57Bl/6J (C57) controls and Mtrr gt/gt (gt/gt) conceptuses at E8.5 (N = 9–12 conceptuses/group). Conceptuses with chorion or EPC angles >2 s.d. above the control mean (black dashed line [chorion = 11.4°; EPC = 2.4°]) were defined as skewed and represented as red data points. Two-tailed Mann-Whitney test, *p = 0.028. (F) Linear regression analysis between chorion and EPC angles for C57Bl/6 conceptuses (C57; N = 10 conceptuses) and Mtrr gt/gt conceptuses (gt/gt; N = 9 conceptuses). (GJ) Venn diagrams depicting overlap between severe conceptus misalignment (SCM) in Mtrr gt/gt conceptuses at E10.5 with embryonic phenotypes including (G) fetal growth restriction, (H) developmental delay, (I) heart malformations, and (J) neural tube closure defects in the spinal cord or in the cranial region. N values in top right of panel indicate total number of Mtrr gt/gt conceptuses assessed. Fisher’s exact test, **p < 0.01, ***p < 0.001. (K,L) Images of embryos (top panel) and placentas (bottom panel) from the same conceptus at E10.5 that belong to the phenotypic groups indicated in (GJ). Phenotypically normal embryos and placentas from C57Bl/6J and Mtrr gt/gt conceptuses at E10.5 are also shown. The heart defect shown is pericardial edema (yellow arrowhead). The neural tube defect shown is an open neural tube in the cranial region (pink arrowhead) and both images show the same embryo in different orientations. Black arrowheads, allantois attachment site in placenta. Dotted line indicates approximate outline of labyrinth/chorion. Scale bars: (AC) 500 μm, (K,L) 1 mm. Ch, chorion; DD, developmental delay; EPC, ectoplacental cone; FGR, fetal growth restriction; Ht, heart defect; MD, mesometrial decidua; NTD, neural tube defect; PN, phenotypically normal; P-TGCs, parietal trophoblast giant cells; SCM, severe conceptus misalignment; UL, uterine lumen remnant.
FIGURE 4
FIGURE 4
Early trophoblast differentiation occurs in Mtrr gt/gt mouse conceptuses at E8.5 regardless of misalignment. Analysis of trophoblast gene marker expression (purple) via in situ hybridization in C57Bl/6J (N = 6) and Mtrr gt/gt (N = 14) placentas at E8.5. Mtrr gt/gt placentas with aligned and skewed orientation are shown. Trophoblast markers included (AC) Hand1 (widespread trophoblast marker including sinusoidal TGC progenitors of the apical chorion), (DF) Syna (indicates syncytiotrophoblast-I progenitors), (GL) Gcm1 (indicates syncytiotrophoblast-II progenitors; branch point initiation sites indicated by clusters of Gcm1+ cells [black arrowheads]), and (MO) Prl7b1 (invasive trophoblast cells; white arrowheads indicate mislocated Prl7b1 + cells). Dotted line indicates outer boundary of the ectoplacental cone. High magnification images in (JL) represent boxed regions in (GI), respectively. Scale bars: (AC) 1 mm, (DF) 125 μm, (GI) 250 μm, (JL) 50 μm, (MO) 500 μm. Al, allantois; Ch, chorion; EPC, ectoplacental cone; MD, mesometrial decidua; UL, uterine lumen remnant.
FIGURE 5
FIGURE 5
Mouse conceptus skewing does not correlate with decidual blood sinus area. (AC) Histological sections of (A) C57Bl/6J and (B,C) Mtrr gt/gt placentas at E8.5. Ectoplacental cones were stained for Tpbpa via in situ hybridization. DNA, pink. Bottom panel represents higher magnification of boxed region in top panel. Placentas with (A,B) aligned and (C) skewed orientation are shown. N = 6–12 placentas/group were assessed. Black dashed line bisects the placenta. Blue dashed line bisects the EPC. Green dashed line bisects the chorion. Skewing angles are indicated for chorion (green) and EPC (blue). De, decidua; DBS, decidual blood sinus. Scale bars: top panel, 500 μm; bottom panel, 100 μm. (D) Graph showing average area of decidual blood sinuses (mean ± s.d.) per total decidua area assessed in histological sections of C57Bl/6J (grey bar) and Mtrr gt/gt (black and blue bars) placentas at E8.5. Aligned (Al) and skewed (Sk) placentas are represented (N = 6–12 placentas/group, with at least three sections assessed per placenta). One-way ANOVA, p = 0.2586. (E) Linear regression analyses of decidua blood sinus area in relation to EPC angle for C57Bl/6J and Mtrr gt/gt conceptuses. Aligned and skewed Mtrr gt/gt placentas were considered separately (N = 6–12 placentas/group). (F) Data depicting the ratio of decidua blood sinus area on the right and left sides of implantation sites from C57Bl/6J (C57) and Mtrr gt/gt (gt/gt) conceptuses at E8.5. Data represented as mean ± sd. Aligned (Al) and skewed (Sk) placentas were considered separately (N = 6–12 placentas/group). Dashed red line indicates a ratio of 1. One-way ANOVA, p = 0.6050. (G) Linear regression analysis to determine whether conceptus skewing occurred towards or away from the greatest decidual blood sinus area. The EPC angle and the ratio of right:left decidua blood sinus area were compared in C57Bl/6J and Mtrr gt/gt conceptuses at E8.5 (N = 6–12 conceptuses/group). Aligned (grey or black dots) and skewed (blue dots) conceptuses are shown. Dashed red line, right:left blood sinus area ratio of 1. Dashed grey line, line of best fit. See also Supplementary Figures 2A,B.
FIGURE 6
FIGURE 6
The effect of maternal Mtrr gt genotype on mouse conceptus skewing at E6.5. (A) Litter parameters at E6.5 obtained when manipulating the maternal Mtrr gt genotype. N = 4 litters/cross with 31–41 conceptuses/cross. Litter sizes: Ordinary one-way ANOVA, p = 0.0351, aDunn multiple comparison test: Mtrr +/gt versus Mtrr gt/gt , p < 0.05. Pedigree key: circle, female; squares, males; blue outline, C57Bl/6J mouse strain; black outline, Mtrr gt mouse strain; white fill, Mtrr +/+ ; half black/half white, Mtrr +/gt ; black fill, Mtrr gt/gt . (B) Graph depicting the average angle of alignment at E6.5 in conceptuses derived from C57Bl/6J, Mtrr +/+ , Mtrr +/gt , or Mtrr gt/gt mothers and C57Bl/6J fathers. White dots, aligned conceptuses. Red dots, conceptuses with angles >2 s.d. above the control mean (indicated by dashed black line). N = 7–10 conceptuses/group. Ordinary one-way ANOVA, p = 0.1438. (C) H&E stained histological sections of implantation sites at E6.5 derived from C57Bl/6J, Mtrr +/+ , Mtrr +/gt , or Mtrr gt/gt mothers and C57Bl/6J fathers (N = 7–10 conceptuses/group). Black dashed line bisects the implantation site. Green dashed line bisects conceptus. Angles indicate the degree of conceptus skewing. Right-hand panel indicates higher magnification of boxed region in left-hand panel. Scale bars, low magnification, 500 μm; high magnification, 250 μm. AMD, antimesometrial decidua; EPC, ectoplacental cone; Epi, epiblast; ExE, extra-embryonic ectoderm; MD, mesometrial decidua. (D) RT-qPCR analysis of relative RNA levels (mean ± s.d.) of the wildtype (wt) Mtrr transcripts and total Mtrr transcripts (wt + gene-trapped transcripts) in whole implantation sites at E6.5 derived from C57Bl/6J, Mtrr +/+ , Mtrr +/gt and Mtrr gt/gt mothers and C57Bl/6J fathers. N = 5–7 implantation sites/group. Values were relative to C57Bl/6J (normalized to 1). One-way ANOVA with Tukey’s multiple comparison test, *p < 0.05, ***p < 0.001. (E) Left-hand graph: average weights of whole implantation sites at E6.5 (mean ± s.d.) derived from C57Bl/6J, Mtrr +/+ , Mtrr +/gt , or Mtrr gt/gt mothers and C57Bl/6J fathers. N = 30–42 conceptuses/group. Alignment not determined. Maternal genotypes are indicated. One-way ANOVA, p = 0.114. Right-hand graph: conceptus weights from Mtrr +/+ , Mtrr +/gt , and Mtrr gt/gt mothers were pooled and divided into aligned orientation (white dots, N = 20 conceptuses) and skewed orientation (red dots; N = 14 conceptuses). Independent t test, p = 0.392. (F) Implantation site shape as determined by the ratio of decidua length (along the mesometrial-antimesometrial axis) and width (along the lateral axis). Maternal genotypes are indicated. Aligned (Al) and skewed (Sk) conceptuses were considered separately (N = 3–8 implantation sites/group). Data presented as mean ± sd. One-way ANOVA, p = 0.1371. (G) Linear regression analysis between conceptus angle and decidua length:width ratio for conceptuses at E6.5 derived from C57Bl/6J, Mtrr +/+ , Mtrr +/gt , and Mtrr gt/gt mothers (N = 7–10 conceptuses/group). White dots, aligned conceptuses; red dots, skewed conceptuses; black line, line of best fit.
FIGURE 7
FIGURE 7
Maternal and grandparental Mtrr gt allele might affect molecular signaling in mouse decidua at E6.5. (A) RT-qPCR analysis of decidualization gene markers in whole implantation sites at E6.5 derived from C57Bl/6J, Mtrr +/+ , Mtrr +/gt or Mtrr gt/gt mothers (N = 5–7 sites/group). Data presented as mean ± s.d., relative to C57Bl/6J controls (normalized to 1). One-way ANOVA with Tukey’s multiple comparison test, *p < 0.05, **p < 0.01, ***p < 0.001. (B) Progesterone receptor (PGR) immunostaining in implantation sites at E6.5 derived from C57Bl/6J mothers and aligned and skewed conceptuses from Mtrr gt/gt mothers. N = 3 sites/genotype were assessed. (C) COX2 immunostaining (brown) in implantation sites at E6.5 derived from C57Bl/6J, Mtrr +/+ , Mtrr +/gt , or Mtrr gt/gt mothers and C57Bl/6J fathers. N = 2–5 sites/maternal genotype were assessed. DNA, blue. Both aligned and skewed conceptuses are shown. In panels (B,C), the degree of skewing is indicated by green dotted line that bisects the conceptus compared to black dotted line that bisects the decidual swelling. (D) No primary antibody control in a skewed Mtrr gt/gt implantation site at E6.5. DNA, blue. (E) COX2 immunostaining (brown) in an aligned C57Bl/6J placenta and skewed Mtrr gt/gt placenta at E8.5. N = 6 sites/genotype. DNA, blue. (BE) Boxed area indicates region of higher magnification in adjacent panel. Black dotted line bisects the implantation site. Green dotted line bisects the conceptus (E6.5) or chorion (E8.5). Maternal genotype is indicated. Scale bars: (B) 500 μm, (C) top, 1 mm; bottom, 500 μm, (D) left, 1 mm; top right, 500 μm; bottom right, 100 μm, (E) 1 mm. Ch, chorion; De, decidua; EPC, ectoplacental cone (dashed line indicates boundary); MD, mesometrial decidua; UL, uterine lumen remnant.
FIGURE 8
FIGURE 8
Severe conceptus misalignment is transgenerationally inherited in the Mtrr gt mouse line via the maternal grandparental lineage. (AK) Frequency of severe conceptus misalignment at E10.5 caused by the (CF) Mtrr +/gt maternal grandmother (MGM) or (HK) Mtrr +/gt maternal grandfather (MGF) compared to (A) C57Bl/6J conceptuses. (B) Mtrr gt/gt and (G) Mtrr +/gt paternal pedigrees were also assessed. (LN) Frequency of severe conceptus misalignment at E10.5 after the transfer of wildtype pre-implantation embryos derived from (M) an Mtrr +/gt MGM and Mtrr +/+ mother (T-MGM) or (N) an Mtrr +/gt MGF and Mtrr +/+ mother (T-MGF) into a B6D2F1 pseudopregnant recipient female. (L) C57Bl/6J embryos were transferred as a control. This experiment was originally performed in (Padmanabhan et al., 2013). Data is displayed as the average number of phenotypically affected conceptuses/litter (±s.e.m.) followed by the percentage of total conceptuses assessed in brackets. Independent t test compared to respective C57Bl/6J controls, *p < 0.05, **p < 0.01, ***p < 0.001. Pedigree key: circle, female; squares, males; blue outline, C57Bl/6J mouse strain; red outline, B6D2F1 mouse strain; black outline, Mtrr gt mouse strain; white fill, Mtrr +/+ ; black fill, Mtrr gt/gt ; half black/half white, Mtrr +/gt .

Similar articles

Cited by

References

    1. Alexander C. M., Hansell E. J., Behrendtsen O., Flannery M. L., Kishnani N. S., Hawkes S. P., et al. (1996). Expression and Function of Matrix Metalloproteinases and Their Inhibitors at the Maternal-Embryonic Boundary During Mouse Embryo Implantation. Development 122 (6), 1723–1736. 10.1242/dev.122.6.1723 - DOI - PubMed
    1. Barak Y., Nelson M. C., Ong E. S., Jones Y. Z., Ruiz-Lozano P., Chien K. R., et al. (1999). PPARγ Is Required for Placental, Cardiac, and Adipose Tissue Development. Mol. Cel. 4 (4), 585–595. 10.1016/s1097-2765(00)80209-9 - DOI - PubMed
    1. Bertozzi T. M., Becker J. L., Blake G. E. T., Bansal A., Nguyen D. K., Fernandez-Twinn D. S., et al. (2021). Variably Methylated Retrotransposons Are Refractory to a Range of Environmental Perturbations. Nat. Genet. 53 (8), 1233–1242. 10.1038/s41588-021-00898-9 - DOI - PMC - PubMed
    1. Blake G. E. T., Zhao X., Yung H. w., Burton G. J., Ferguson-Smith A. C., Hamilton R. S., et al. (2021). Defective Folate Metabolism Causes Germline Epigenetic Instability and Distinguishes Hira as a Phenotype Inheritance Biomarker. Nat. Commun. 12 (1), 3714. 10.1038/s41467-021-24036-5 - DOI - PMC - PubMed
    1. Blake G. E., Watson E. D. (2016). Unravelling the Complex Mechanisms of Transgenerational Epigenetic Inheritance. Curr. Opin. Chem. Biol. 33, 101–107. 10.1016/j.cbpa.2016.06.008 - DOI - PubMed

LinkOut - more resources