. 2022 Jan 21;25(1):103672.
doi: 10.1016/j.isci.2021.103672. Epub 2021 Dec 20.

Integrated miRNA/cytokine/chemokine profiling reveals severity-associated step changes and principal correlates of fatality in COVID-19

Affiliations

Integrated miRNA/cytokine/chemokine profiling reveals severity-associated step changes and principal correlates of fatality in COVID-19

Julie C Wilson et al. iScience. .

Abstract

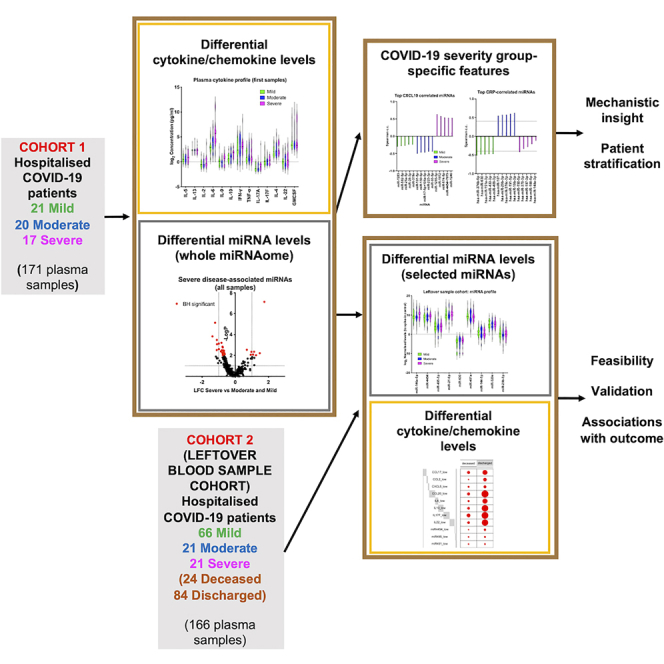
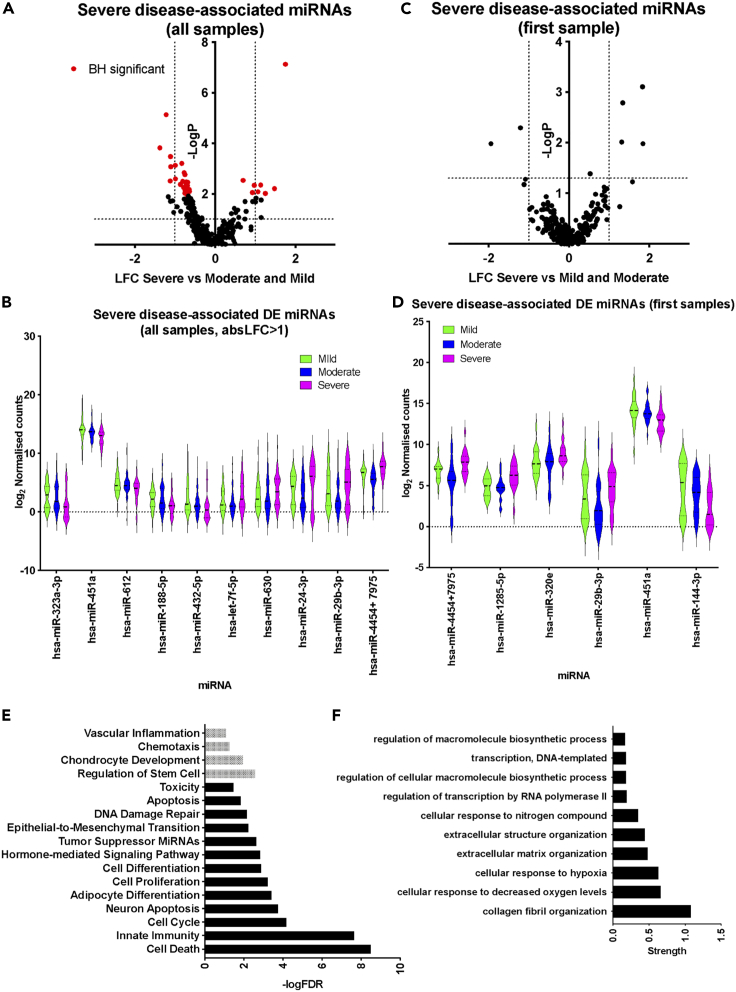
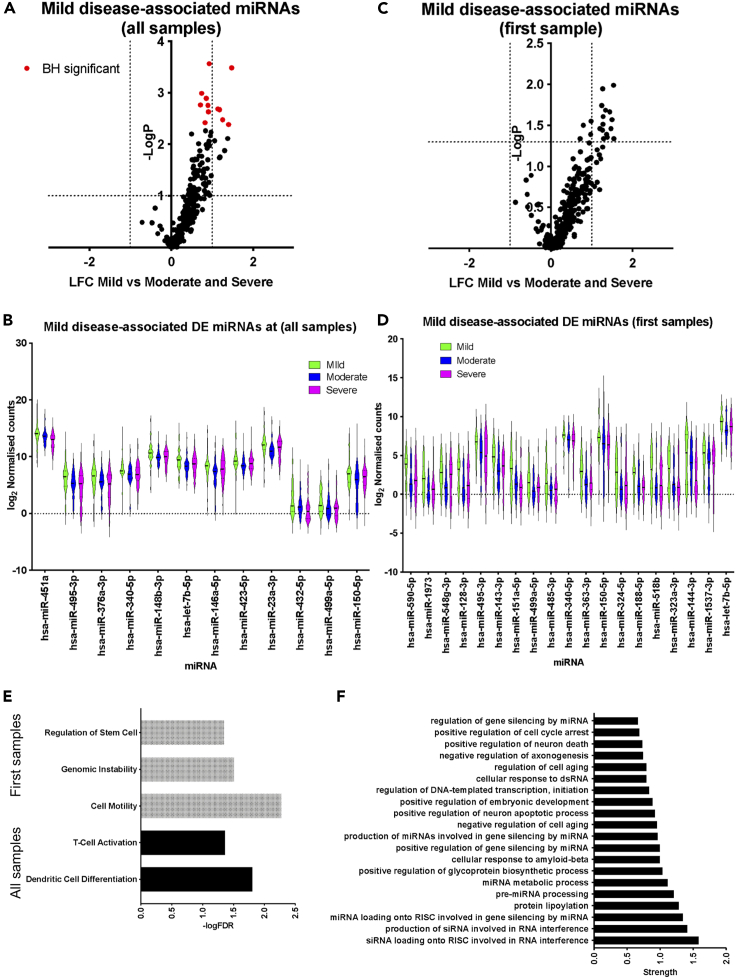
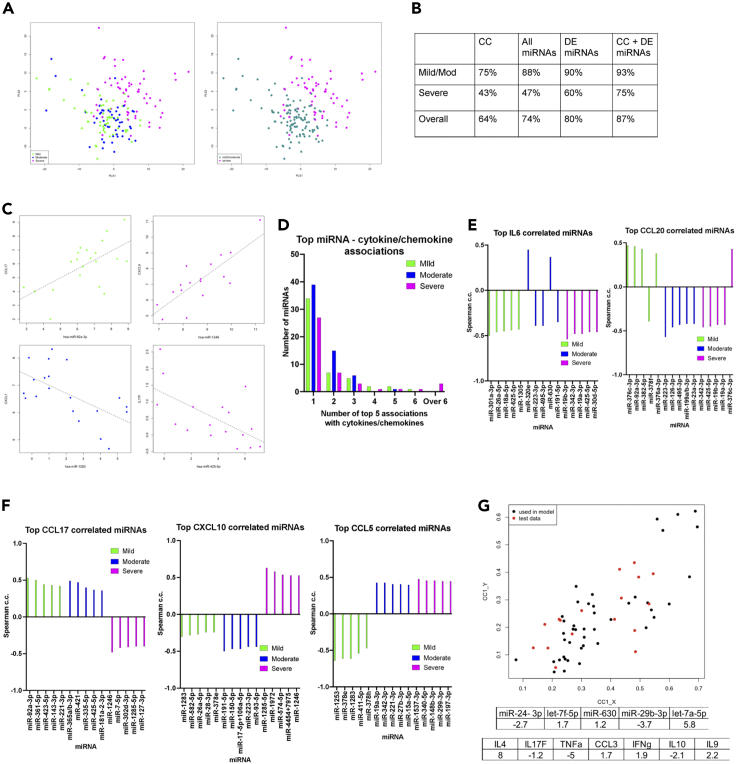
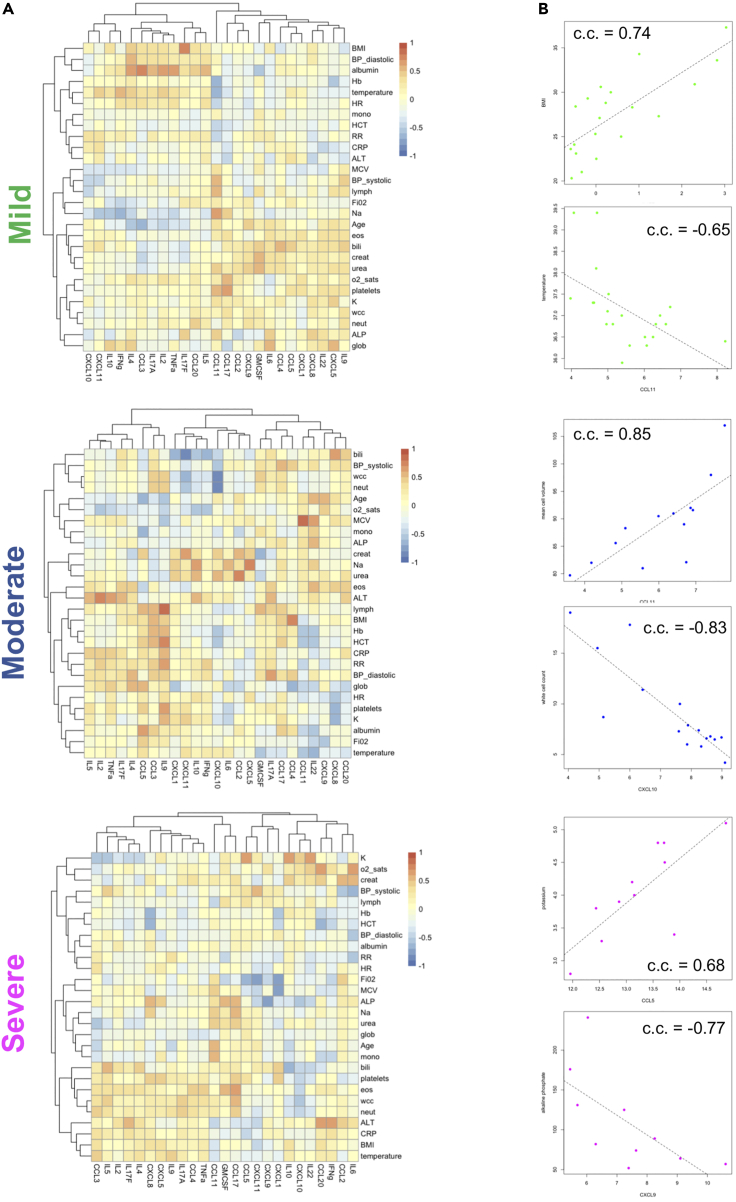
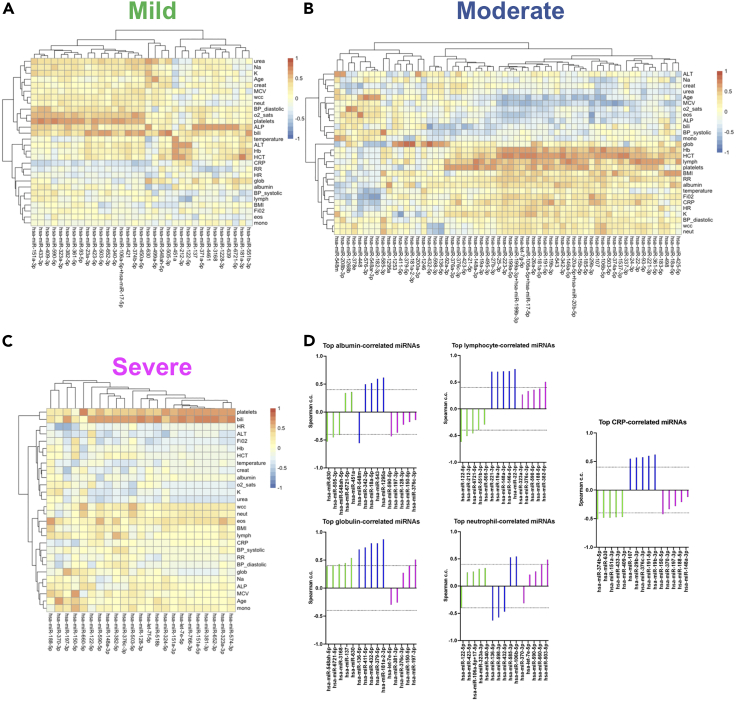
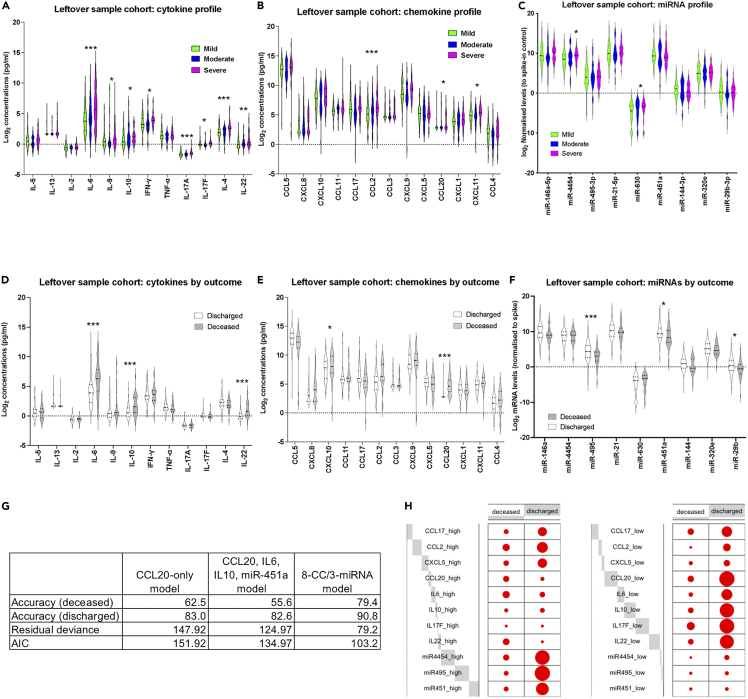
Inflammatory cytokines and chemokines (CC) drive COVID-19 pathology. Yet, patients with similar circulating CC levels present with different disease severity. Here, we determined 171 microRNAomes from 58 hospitalized COVID-19 patients (Cohort 1) and levels of 25 cytokines and chemokines (CC) in the same samples. Combining microRNA (miRNA) and CC measurements allowed for discrimination of severe cases with greater accuracy than using miRNA or CC levels alone. Severity group-specific associations between miRNAs and COVID-19-associated CC (e.g., IL6, CCL20) or clinical hallmarks of COVID-19 (e.g., neutrophilia, hypoalbuminemia) separated patients with similar CC levels but different disease severity. Analysis of an independent cohort of 108 patients from a different center (Cohort 2) demonstrated feasibility of CC/miRNA profiling in leftover hospital blood samples with similar severe disease CC and miRNA profiles, and revealed CCL20, IL6, IL10, and miR-451a as key correlates of fatal COVID-19. These findings highlight that systemic miRNA/CC networks underpin severe COVID-19.

Keywords: Clinical finding; Complex system biology; Health sciences.


Conflict of interest statement

The authors declare no competing interests.

Figures

None
Graphical abstract
Figure 1
Figure 1
Plasma miRNA signatures of severe COVID-19 (A) Volcano plot comparing miRNA expression in severe against mild and moderate samples including all samples as independent observations. Dotted lines correspond to log2 fold change (LFC) greater than one and Mann Whitney p <0.05. Red dots correspond to miRNAs for which adjusted p <0.1 following Benjamini Hochberg (BH) correction. (B) Violin plots of top DE expressed miRNAs in severe samples (adjusted p <0.1 and absolute LFC>1), including all samples. (C) Volcano plot comparing miRNA expression in severe against mild and moderate samples including only the first available samples for each patient. Dotted lines correspond to log2 fold change (LFC) greater than one and Mann Whitney p <0.05. (D) Violin plots of DE expressed miRNAs in severe samples when only the first sample per patient is included (p <0.05 and absolute LFC>1). (E) Significantly overrepresented functional terms within upregulated (shown in black) and downregulated (shown in gray) miRNAs in severe cases (shown in red in (A)), including all samples as independent variables. (F) Significantly overrepresented gene ontology process terms among predicted targets of miRNAs upregulated in severe cases (red dots in the top right quadrant in (A).
Figure 2
Figure 2
Plasma miRNA signatures of mild COVID-19 (A) Volcano plot comparing miRNA expression in mild against moderate and severe samples including all samples as independent observations. Dotted lines correspond to absolute LFC greater than one and Mann Whitney p <0.05. Red dots correspond to miRNAs for which adjusted p <0.1 following BH correction. (B) Violin plots of DE expressed miRNAs in mild samples (adjusted p <0.1), including all samples. (C) Volcano plot comparing miRNA expression in mild against moderate and severe samples including only the first available samples for each patient. Dotted lines correspond to absolute LFC greater than one and Mann Whitney p < 0.05. (D) Violin plots of DE expressed miRNAs in mild samples when only the first sample per patient is included (p <0.05 and absolute LFC >1). (E) Significantly overrepresented functional terms for miRNAs upregulated in mild samples when all samples (shown in black) or only first samples (shown in gray) are analyzed. (F) Significantly overrepresented gene ontology process terms among predicted targets of miRNAs upregulated in mild cases (red dots in the top right quadrant in (A).
Figure 3
Figure 3
Circulating cytokine and chemokine signatures of COVID-19 (A) Violin plots of measured cytokines in mild (green), moderate (blue), and severe (magenta) samples, including all samples. Stars indicate significance for the comparison of severe against mild and moderate as follows: ∗ adjusted p <0.05, ∗∗ adjusted p <0.01, ∗∗∗ adjusted p <0.005. (B) As in A, but analysis includes only first available samples per patient. (C) As in A, but for circulating chemokines. (D) As in C, but analysis includes only first available samples per patient. (E) Heatmaps showing Spearman correlation between cytokines and chemokines for mild, moderate, and severe groups separately. The average value over all available measurements for each patient was used in the calculation of correlations. (F) Plots of IFNγ against CCL20 levels in mild (green), moderate (blue), and severe (magenta) patients. Correlation coefficients (c.c.) are shown above each scatter plot.
Figure 4
Figure 4
Integration of miRNA, and cytokine and chemokine signatures (A) Score plots for the first two latent variables from PLSR obtained using cytokine and chemokine data together with DE miRNA measurements. The plot on the left was obtained using all three severity levels (mild, moderate, and severe), whereas that on the right was obtained using only two classes (severe and mild/moderate). (B) Results from PLSR with patients considered in two groups for different datasets with continuous output values assigned to the nearest discrete class number. Accuracies shown were obtained using leave-one-patient-out cross validation, using only cytokine and chemokine (CC) values, all miRNA values, only DE miRNAs values, or combining all CC values with DE miRNAs. (C) Example scatterplots showing strong, severity group-specific correlations in mild (green), moderate (blue), or severe (magenta) patients. (D) Number of miRNAs (Y axis) in the top 5 strongest correlations with 1, 2, 3, 4, 5, 6, or over 6 cytokines/chemokines per severity group. See Table S4 (E) Spearman correlation coefficients for top 5 correlated miRNAs with IL6 and CCL20 in mild (green), moderate (blue), and severe (magenta) groups. (F) As in E, but for CCL17, CXCL10, and CCL5. (G) Canonical correlation analysis (CCA) to relate the miRNAs associated with cell death in the severe group (Figure 1E) with cytokines and chemokines. Cytokines/chemokines with individual absolute correlation greater than 0.4 (for the severe group) with any of these miRNAs were included in the analysis. The canonical scores plot shows data (from individual samples) for the12 patients used to determine the canonical covariates (c.c. = 0.8, p = 4.8 × 10−6) in black. The coefficients obtained are shown in the table and are used to obtain the canonical scores for 5 randomly chosen patients reserved as an independent test set (plotted in red).
Figure 5
Figure 5
Correlation analysis of cytokine and chemokine profiles with clinical parameters (A) Heatmaps showing Spearman correlation coefficients (c.c.) between cytokines and chemokines and clinical measurements for mild, moderate, and severe groups. The first cytokine/chemokine value was used for each patient. (B) Example scatter plots for strong, severity group-specific correlations between cytokines/chemokines and clinical parameters in mild (green), moderate (blue), or severe (magenta) patients. Correlation coefficients (c.c.) are also shown.
Figure 6
Figure 6
Severity-specific correlations between miRNAs and COVID-19-associated clinical parameters (A) Heatmap showing Spearman correlation coefficients (c.c.) between miRNAs and clinical measurements for the mild group of patients. Values shown for miRNAs with absolute c.c. >0.6 with at least one clinical parameter. The first miRNA value was used for each patient. (B) As in A, but for moderate cases. (C) As in A, but for severe cases. (D) Spearman correlation coefficients for top 5 correlated miRNAs with indicated clinical parameters in mild (green), moderate (blue), and severe (magenta) groups.
Figure 7
Figure 7
miRNA/CC correlates of fatal COVID-19 identified in a leftover blood sample cohort (A) Violin plots of measured cytokines in mild (green), moderate (blue), and severe (magenta) samples, in the leftover blood sample cohort. Stars indicate significance for the comparison of severe against mild and moderate as follows: ∗ adjusted p <0.05, ∗∗ adjusted p <0.01, ∗∗∗ adjusted p <0.005. (B) As in A, but for chemokine levels. (C) As in A, but for miRNA levels. (D) Violin plots of measured cytokines in samples from discharged (white) and deceased (gray) patients, in the leftover blood sample cohort. Stars indicate significance for the comparison of severe against mild and moderate as follows: ∗ adjusted p <0.05, ∗∗ adjusted p <0.01, ∗∗∗ adjusted p <0.005. (E) As in D, but for chemokine levels. (F) As in D, but for miRNA levels. (G) Results of forward regression models including accuracy for deceased and discharged patients, residual deviance, and AIC. Results are shown for the CCL20-only model, the CCL20/IL6/IL10/miR-451a model, and the 3 miRNAs/11 CC models (see Table S11). (H) Balloon plots for the parameters included in the 3 miRNAs/11 CC model. The size of each dot reflects the number of patients in the deceased or discharged group with high (left panel), or low (right panel) levels of the shown CCs and miRNAs. Gray blocks indicate the proportion of the total counts (high or low) each variable accounts for. See STAR methods for definition of high and low values.

References

    1. Agarwal V., Bell G.W., Nam J.W., Bartel D.P. Predicting effective microRNA target sites in mammalian mRNAs. Elife. 2015;4:e05005. doi: 10.7554/eLife.05005. - DOI - PMC - PubMed
    1. Ahn S.H., Gu D., Koh Y., Lee H.S., Chi S.W. AGO CLIP-based imputation of potent siRNA sequences targeting SARS-CoV-2 with antifibrotic miRNA-like activity. Sci. Rep. 2021;11:19161. doi: 10.1038/s41598-021-98708-z. - DOI - PMC - PubMed
    1. Aslani M., Mortazavi-Jahromi S.S., Mirshafiey A. Cytokine storm in the pathophysiology of COVID-19: possible functional disturbances of miRNAs. Int. Immunopharmacol. 2021;101:108172. doi: 10.1016/j.intimp.2021.108172. - DOI - PMC - PubMed
    1. Bergamaschi L., Mescia F., Turner L., Hanson A.L., Kotagiri P., Dunmore B.J., Ruffieux H., De Sa A., Huhn O., Morgan M.D., et al. Longitudinal analysis reveals that delayed bystander CD8+ T cell activation and early immune pathology distinguish severe COVID-19 from mild disease. Immunity. 2021;54:1257–1275.e8. doi: 10.1016/j.immuni.2021.05.010. - DOI - PMC - PubMed
    1. Bost P., Giladi A., Liu Y., Bendjelal Y., Xu G., David E., Blecher-Gonen R., Cohen M., Medaglia C., Li H., et al. Host-viral infection maps reveal signatures of severe COVID-19 patients. Cell. 2020;181:1475–1488.e12. doi: 10.1016/j.cell.2020.05.006. - DOI - PMC - PubMed