

Machine learning enables new insights into genetic contributions to liver fat accumulation
- PMID: 34957434
- PMCID: PMC8699145
- DOI: 10.1016/j.xgen.2021.100066
Machine learning enables new insights into genetic contributions to liver fat accumulation
Abstract
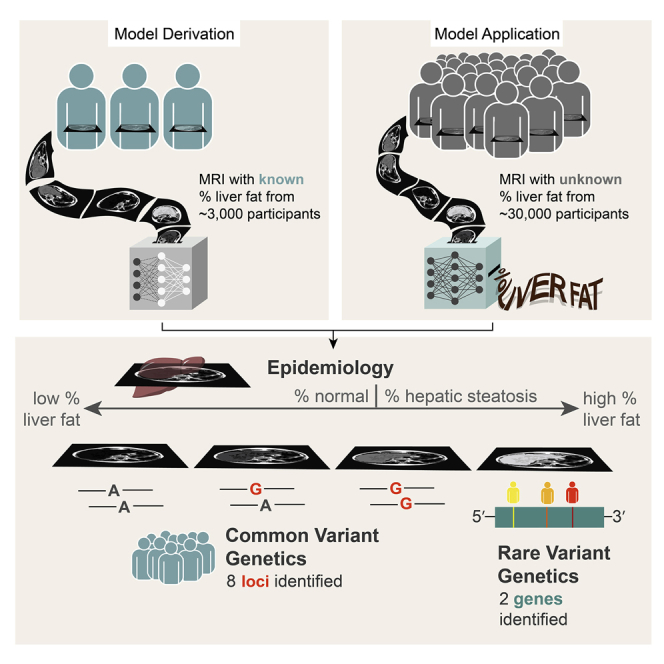
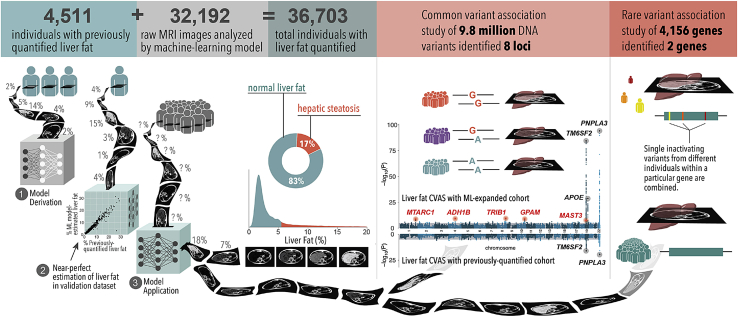
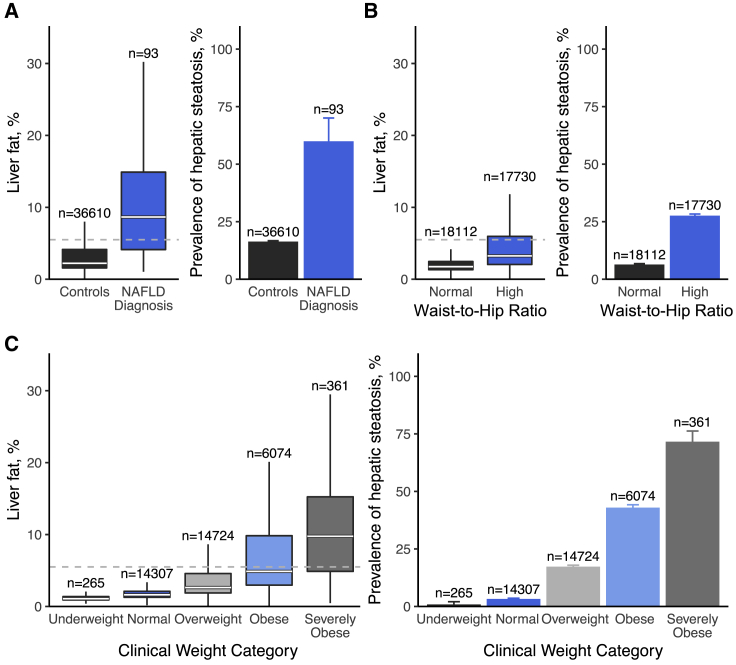
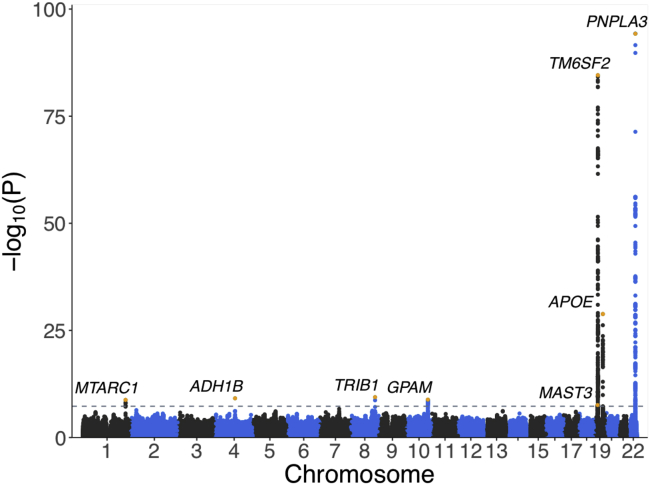
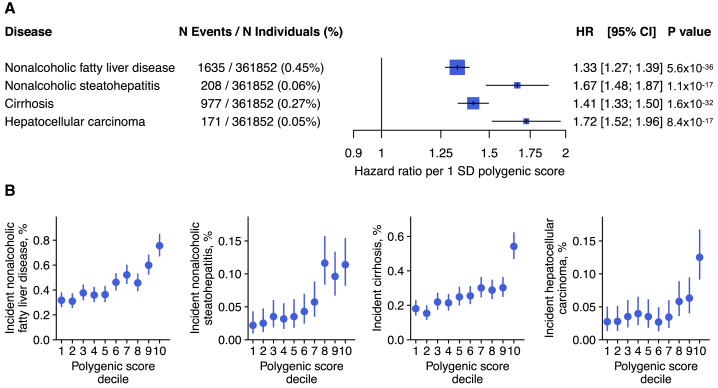
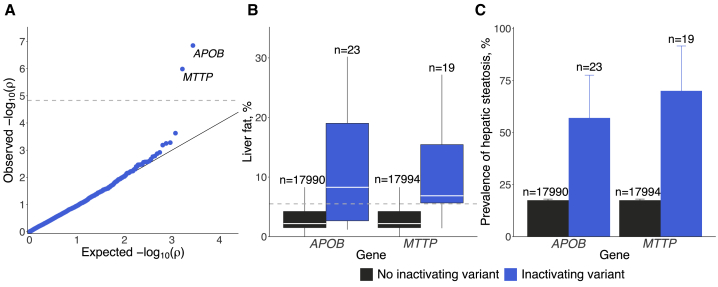
Excess liver fat, called hepatic steatosis, is a leading risk factor for end-stage liver disease and cardiometabolic diseases but often remains undiagnosed in clinical practice because of the need for direct imaging assessments. We developed an abdominal MRI-based machine-learning algorithm to accurately estimate liver fat (correlation coefficients, 0.97-0.99) from a truth dataset of 4,511 middle-aged UK Biobank participants, enabling quantification in 32,192 additional individuals. 17% of participants had predicted liver fat levels indicative of steatosis, and liver fat could not have been reliably estimated based on clinical factors such as BMI. A genome-wide association study of common genetic variants and liver fat replicated three known associations and identified five newly associated variants in or near the MTARC1, ADH1B, TRIB1, GPAM, and MAST3 genes (p < 3 × 10⁻⁸). A polygenic score integrating these eight genetic variants was strongly associated with future risk of chronic liver disease (hazard ratio > 1.32 per SD score, p < 9 × 10-17). Rare inactivating variants in the APOB or MTTP genes were identified in 0.8% of individuals with steatosis and conferred more than 6-fold risk (p < 2 × 10⁻⁵), highlighting a molecular subtype of hepatic steatosis characterized by defective secretion of apolipoprotein B-containing lipoproteins. We demonstrate that our imaging-based machine-learning model accurately estimates liver fat and may be useful in epidemiological and genetic studies of hepatic steatosis.
Conflict of interest statement
M.E.H. is currently an employee and shareholder of Regeneron Pharmaceuticals. J.P.P. has served as a consultant for Maze Therapeutics. R.L. serves as a consultant or advisory board member for Arrowhead Pharmaceuticals; AstraZeneca; Boehringer-Ingelheim; Bristol Myers Squibb; Celgene; Cirius; CohBar; Galmed; Gemphire; Gilead; Glympse bio; Intercept; Ionis; Inipharma; Merck; Metacrine, Inc.; NGM Biopharmaceuticals; Novo Nordisk; Pfizer; and Viking Therapeutics. In addition, his institution has received grant support from Allergan, Boehringer-Ingelheim, Bristol Myers Squibb, Eli Lilly and Company, Galmed Pharmaceuticals, Genfit, Gilead, Intercept, Janssen, Madrigal Pharmaceuticals, NGM Biopharmaceuticals, Novartis, Pfizer, pH Pharma, and Siemens. He is also co-founder of Liponexus, Inc. A.Y.Z. is an employee of Color Health. J.R.H. was an employee of Color Health and is currently an employee of Maze Therapeutics. K.E.C. serves on the advisory boards of Novo Nordisk and BMS, has consulted for Gilead, and has received grant funding from BMS, Boehringer-Ingelheim, and Novartis. T.G.S. has served as a consultant for Aetion. A.P. is employed as a Venture Partner at GV, a venture capital group within Alphabet; he is also supported by a grant from Bayer AG to the Broad Institute, focused on machine learning for clinical trial design. S.N.F. and P.B. are supported by grants from Bayer AG and IBM applying machine learning in cardiovascular disease. P.B. has served as a consultant to Novartis. P.T.E. is supported by a grant from Bayer AG to the Broad Institute, focused on the genetics and therapeutics of cardiovascular diseases. P.T.E. has also served on advisory boards or consulted for Bayer AG, Quest Diagnostics, MyoKardia, and Novartis. A.V.K. has served as a scientific advisor to Sanofi, Amgen, Maze Therapeutics, Navitor Pharmaceuticals, Sarepta Therapeutics, Verve Therapeutics, Veritas International, Color Health, Third Rock Ventures, and Columbia University (NIH); received speaking fees from Illumina, MedGenome, Amgen, and the Novartis Institute for Biomedical Research; and received sponsored research agreements from the Novartis Institute for Biomedical Research and IBM Research.
Figures
References
-
- Loomba R., Sanyal A.J. The global NAFLD epidemic. Nat. Rev. Gastroenterol. Hepatol. 2013;10:686–690. - PubMed
Grants and funding
- N01 HC095168/HL/NHLBI NIH HHS/United States
- K24 HL105780/HL/NHLBI NIH HHS/United States
- 75N92020D00001/HL/NHLBI NIH HHS/United States
- P42 ES010337/ES/NIEHS NIH HHS/United States
- N01 HC095167/HL/NHLBI NIH HHS/United States
- P30 DK120515/DK/NIDDK NIH HHS/United States
- P30 DK063491/DK/NIDDK NIH HHS/United States
- HHSN268201500003I/HL/NHLBI NIH HHS/United States
- UL1 TR000040/TR/NCATS NIH HHS/United States
- R01 DK106419/DK/NIDDK NIH HHS/United States
- K23 DK119460/DK/NIDDK NIH HHS/United States
- K23 DK122104/DK/NIDDK NIH HHS/United States
- 75N92020D00002/HL/NHLBI NIH HHS/United States
- HHSN268201500003C/HL/NHLBI NIH HHS/United States
- R01 HL071739/HL/NHLBI NIH HHS/United States
- N01 HC095161/HL/NHLBI NIH HHS/United States
- 75N92020D00005/HL/NHLBI NIH HHS/United States
- UL1 TR001079/TR/NCATS NIH HHS/United States
- N02 HL064278/HL/NHLBI NIH HHS/United States
- N01 HC095169/HL/NHLBI NIH HHS/United States
- R01 HL092577/HL/NHLBI NIH HHS/United States
- MC_QA137853/MRC_/Medical Research Council/United Kingdom
- U01 HG011719/HG/NHGRI NIH HHS/United States
- UL1 TR001442/TR/NCATS NIH HHS/United States
- N01 HC095159/HL/NHLBI NIH HHS/United States
- R01 HL128914/HL/NHLBI NIH HHS/United States
- 75N92020D00003/HL/NHLBI NIH HHS/United States
- UL1 TR001420/TR/NCATS NIH HHS/United States
- 75N92020D00004/HL/NHLBI NIH HHS/United States
- N01 HC095163/HL/NHLBI NIH HHS/United States
- 75N92020D00007/HL/NHLBI NIH HHS/United States
- N01 HC095166/HL/NHLBI NIH HHS/United States
- MC_PC_17228/MRC_/Medical Research Council/United Kingdom
- N01 HC095162/HL/NHLBI NIH HHS/United States
- 75N92020D00006/HL/NHLBI NIH HHS/United States
- UL1 TR001881/TR/NCATS NIH HHS/United States
- N01 HC095165/HL/NHLBI NIH HHS/United States
- N01 HC095164/HL/NHLBI NIH HHS/United States
- K08 HG010155/HG/NHGRI NIH HHS/United States
- N01 HC095160/HL/NHLBI NIH HHS/United States
LinkOut - more resources
Full Text Sources
Other Literature Sources
Miscellaneous
