. 2022 Jan;26(1):19-37.
doi: 10.1007/s40291-021-00570-2. Epub 2021 Dec 26.

Evaluation of the Suitability of RNAscope as a Technique to Measure Gene Expression in Clinical Diagnostics: A Systematic Review

Affiliations

Evaluation of the Suitability of RNAscope as a Technique to Measure Gene Expression in Clinical Diagnostics: A Systematic Review

Sameeha Atout et al. Mol Diagn Ther. 2022 Jan.

Abstract

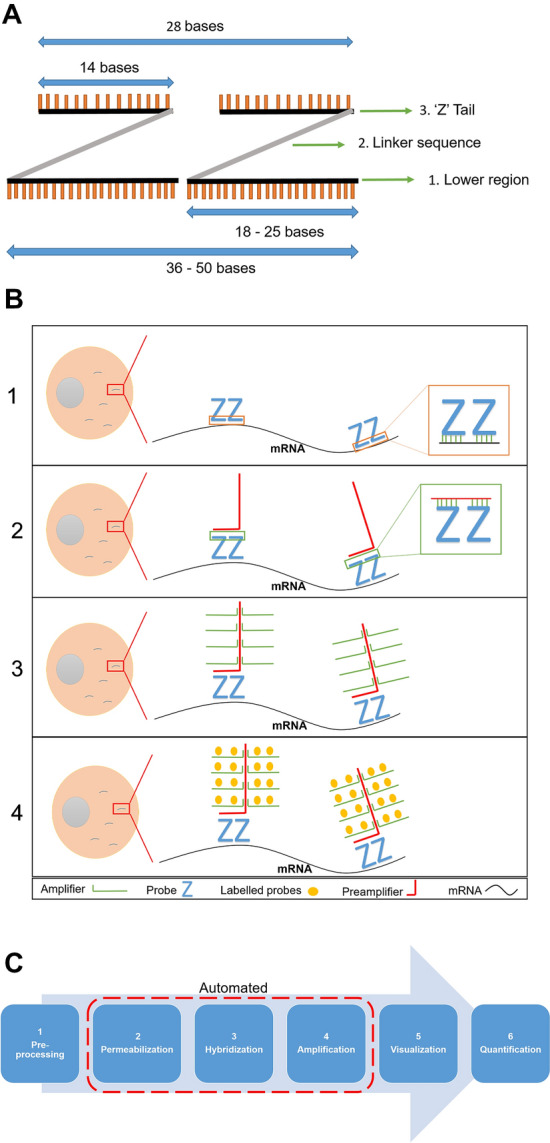
Objective: To evaluate the application of RNAscope in the clinical diagnostic field compared to the current 'gold standard' methods employed for testing gene expression levels, including immunohistochemistry (IHC), quantitative real time PCR (qPCR), and quantitative reverse transcriptase PCR (qRT-PCR), and to detect genes, including DNA in situ hybridisation (DNA ISH).

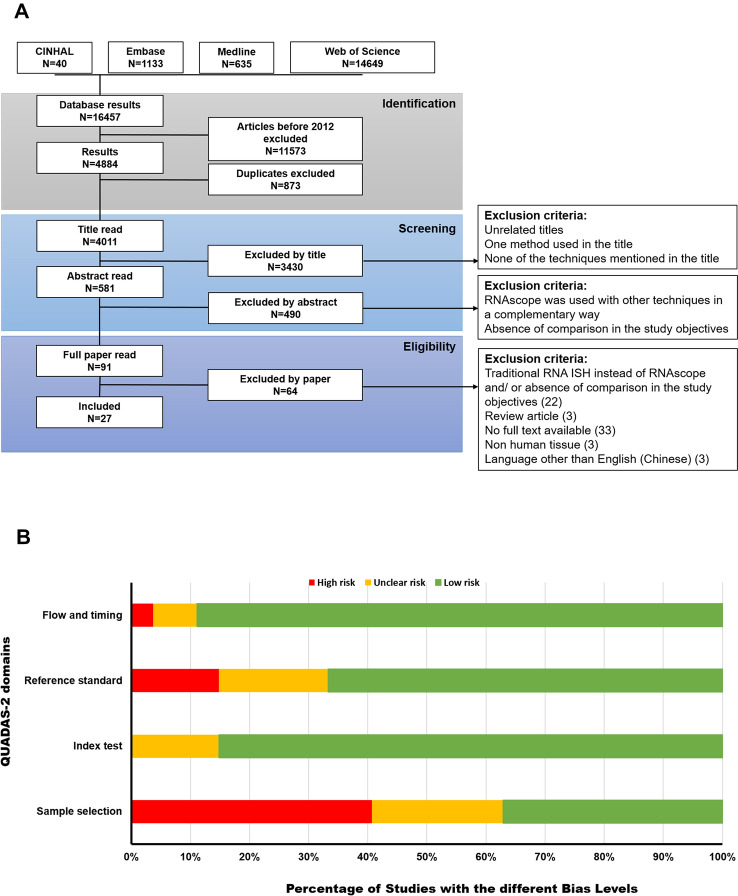
Methods: This systematic review searched CINAHL, Medline, Embase and Web of Science databases for studies that were conducted after 2012 and that compared RNAscope with one or more of the 'gold standard' techniques in human samples. QUADAS-2 test was used for the evaluation of the articles' risk of bias. The results were reviewed narratively and analysed qualitatively.

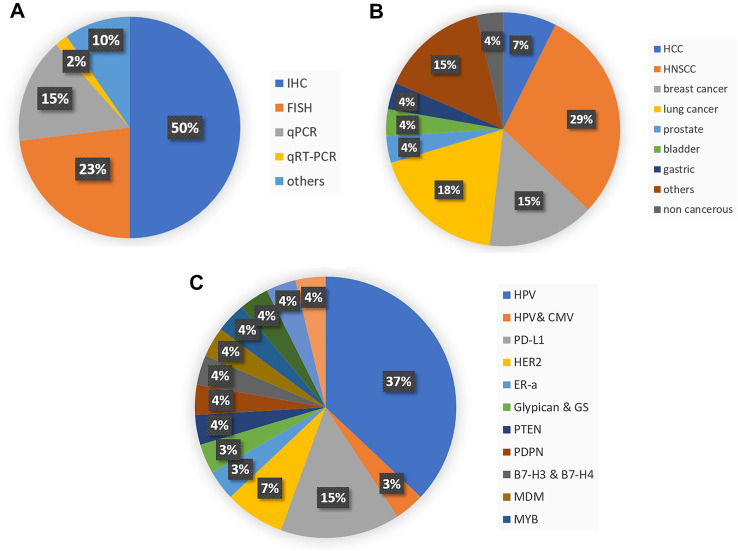
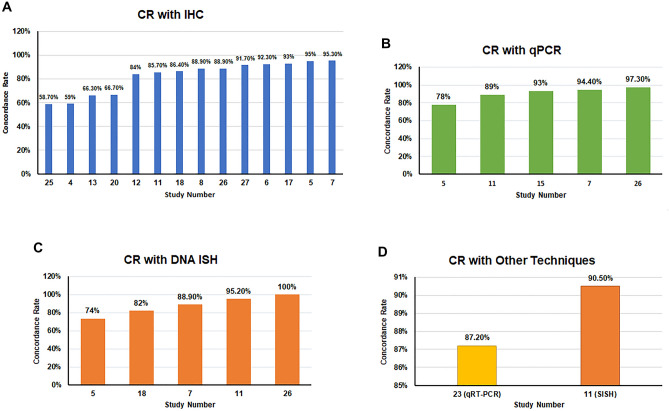
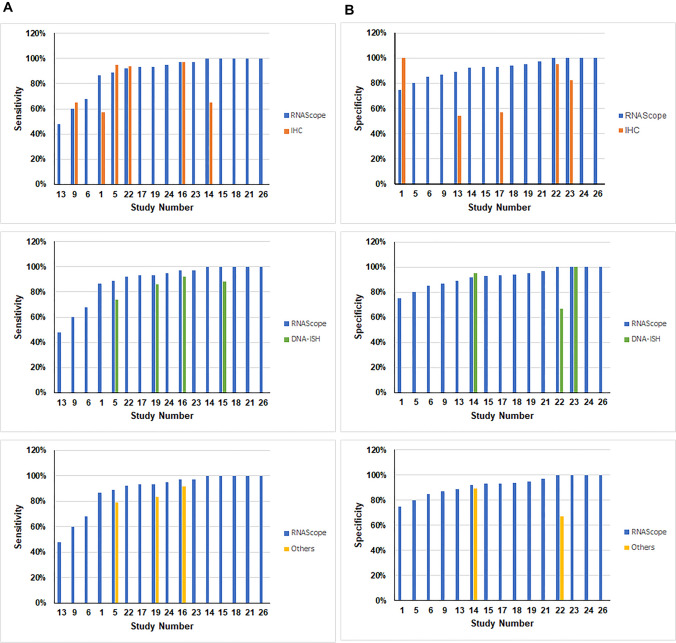
Results: A total of 27 articles (all retrospective studies) were obtained and reviewed. The 27 articles showed a range of low to middle risk of bias scores, as assessed by QUADAS-2 test. 26 articles studied RNAscope within cancer samples. RNAscope was compared to different techniques throughout the included studies (IHC, qPCR, qRT-PCR and DNA ISH). The results confirmed that RNAscope is a highly sensitive and specific method that has a high concordance rate (CR) with qPCR, qRT-PCR, and DNA ISH (81.8-100%). However, the CR with IHC was lower than expected (58.7-95.3%), which is mostly due to the different products that each technique measures (RNA vs. protein).

Discussion: This is the first systematic review to be conducted on the use of RNAscope in the clinical diagnostic field. RNAscope was found to be a reliable and robust method that could complement gold standard techniques currently used in clinical diagnostics to measure gene expression levels or for gene detection. However, there were not enough data to suggest that RNAscope could stand alone in the clinical diagnostic setting, indicating further prospective studies to validate diagnostic accuracy values, in keeping with relevant regulations, followed by cost evaluation are required.


Conflict of interest statement

The authors declare no conflicts of interest.

Figures

Fig. 1
Fig. 1
The elements of ‘Z’ probes. A The constituents of ‘Z’ probe dimers are: (1) the lower region that comprises 18–25 bases per each ‘Z’ probe; (2) linker sequence; (3) the tail that comprises 14 bases per each ‘Z’ probe. This figure panel was created with Powerpoint using data from Wang et al. [3]. B The sequential steps of RNAscope involve: (1) binding of double ‘Z’ probes to a complementary sequence; (2) attachment of pre-amplifier to double ‘Z’ pair tail; (3) binding of amplification molecules (amplifiers) to pre-amplifier; (4) attachment of the labelled probes to their specific sites on the amplifiers. This figure panel was created with Powerpoint using data from Erben and Buonanno [8] and Wang et al. [3]. C The presented flow-chart illustrates the RNAscope workflow process and highlights which parts can be automated (steps 2, 3 and 4). This figure panel was created with Powerpoint using data from [, –12]
Fig. 2
Fig. 2
PRISMA flow diagram and assessment of risk of bias. A The presented flow-chart outlines and summarizes the main research steps that were taken in the sequential selection of the articles included in the systematic review, including an explanation of the exclusion criteria for each step. Adapted from PRISMA [32]. B The presented bar-chart illustrates the percentage of studies for each RoB level within each domain for the included studies as determined using QUADAS-2 tool. Green represents a low risk, yellow represents an unclear risk, and red represents a high risk
Fig. 3
Fig. 3
Evaluation of study characteristics from the 27 articles. The presented pie charts illustrate: A the percentage of studies using specified current gold standard techniques that were compared to RNAscope; B the percentages of studies using samples from specified types of cancer in the included articles; C the percentages of studies using specified markers within the included articles. AdCC adenoid cystic carcinoma, BC breast cancer, CMV cytomegalovirus, EBV Epstein-Barr virus, ERα estrogen receptor α, HNSCC head and neck squamous cell carcinoma, HCC hepatocellular carcinoma, HER-2 human epidermal growth factor receptor 2, NSCLC non-small-cell lung carcinoma, PDPN podoplanin, PTEN phosphatase and tensin homolog, PT phyllodes tumours, PD-L1 programmed death-ligand 1, SCC squamous cell carcinoma, SPARC secreted protein acidic and rich in cysteine, TTF1 Thyroid Transcription Factor 1
Fig. 4
Fig. 4
Evaluation of the concordance rate (CR) between the results of RNAscope and IHC, qPCR, DNA ISH. The presented bar charts illustrate the CR results from: A 14 studies that compared RNAscope to IHC; B five studies that compared RNAscope to qPCR; C four studies that compared RNAscope to DNA ISH; and D two studies that compared RNAscope to other studies like qRT-PCR and SISH
Fig. 5
Fig. 5
The sensitivity and specificity ratios of RNAscope versus other techniques. The presented bar charts illustrate: A sensitivity ratios for RNAscope (13 studies) and other techniques whose values were co-reported in the same studies. Top graph—IHC (co-reported in six studies); middle graph—DNA ISH (co-reported in four studies); lower graph—DNA PCR (co-reported in three studies) and B specificity ratios for RNAscope (11 studies) and other techniques whose values were co-reported in the same studies. Top graph—IHC (co-reported in five studies); middle graph—DNA ISH (co-reported in two studies); lower graph—DNA PCR (co-reported in two studies)

References

    1. Enguita FJ. New promising circulating RNA biomarkers for early diagnosis of lung adenocarcinoma. Ann Transl Med. 2019;3:S130. doi: 10.21037/atm.2019.05.70. - DOI - PMC - PubMed
    1. Sandvik AK, Alsberg BK, Nørsett KG, Yadetie F, Waldum HL, Lægreid A. Gene expression analysis and clinical diagnosis. Clin Chim Acta. 2006;363(1):157–164. doi: 10.1016/j.cccn.2005.05.046. - DOI - PubMed
    1. Wang F, Flanagan J, Su N, Wang LC, Bui S, Nielson A, et al. RNAscope: a novel in situ RNA analysis platform for formalin-fixed, paraffin-embedded tissues. J Mol Diagn. 2012;14(1):22–29. doi: 10.1016/j.jmoldx.2011.08.002. - DOI - PMC - PubMed
    1. Baena-Del Valle JA, Zheng Q, Hicks JL, Fedor H, Trock BJ, Morrissey C, et al. Rapid loss of RNA detection by in situ hybridization in stored tissue blocks and preservation by cold storage of unstained slides. Am J Clin Pathol. 2017;148(5):398–415. doi: 10.1093/ajcp/aqx094. - DOI - PMC - PubMed
    1. Houseley J, Tollervey D. The many pathways of RNA degradation. Cell. 2009;136(4):763–776. doi: 10.1016/j.cell.2009.01.019. - DOI - PubMed

Publication types