

Single-cell transcriptomics of LepR-positive skeletal cells reveals heterogeneous stress-dependent stem and progenitor pools
- PMID: 34957577
- PMCID: PMC8844986
- DOI: 10.15252/embj.2021108415
Single-cell transcriptomics of LepR-positive skeletal cells reveals heterogeneous stress-dependent stem and progenitor pools
Abstract
Leptin receptor (LepR)-positive cells are key components of the bone marrow hematopoietic microenvironment, and highly enrich skeletal stem and progenitor cells that maintain homeostasis of the adult skeleton. However, the heterogeneity and lineage hierarchy within this population has been elusive. Using genetic lineage tracing and single-cell RNA sequencing, we found that Lepr-Cre labels most bone marrow stromal cells and osteogenic lineage cells in adult long bones. Integrated analysis of Lepr-Cre-traced cells under homeostatic and stress conditions revealed dynamic changes of the adipogenic, osteogenic, and periosteal lineages. Importantly, we discovered a Notch3+ bone marrow sub-population that is slow-cycling and closely associated with the vasculatures, as well as key transcriptional networks promoting osteo-chondrogenic differentiation. We also identified a Sca-1+ periosteal sub-population with high clonogenic activity but limited osteo-chondrogenic potential. Together, we mapped the transcriptomic landscape of adult LepR+ stem and progenitor cells and uncovered cellular and molecular mechanisms underlying their maintenance and lineage specification.
Keywords: LepR+ cells; bone marrow stromal cells; periosteum; single-cell RNA-seq; skeletal stem/progenitor cells.
© 2021 The Authors.
Figures
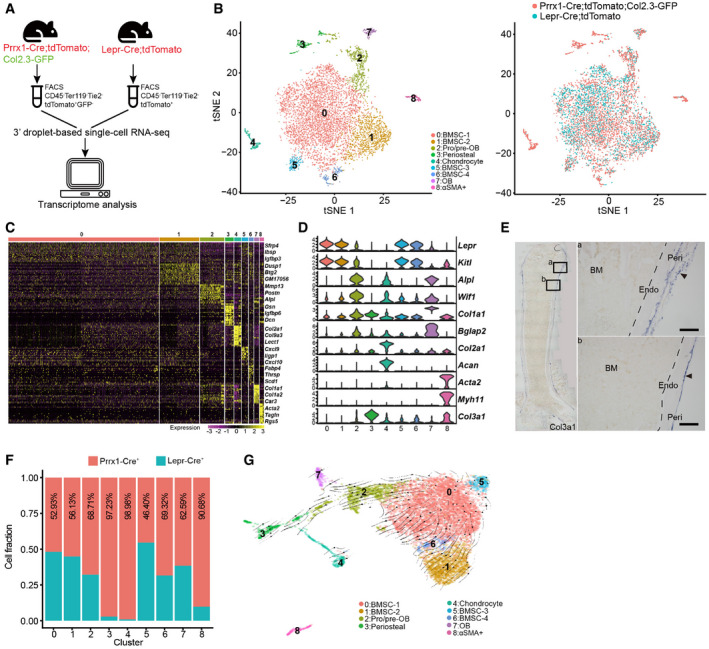
Schematic overview of the scRNA‐seq workflow.
t‐SNE plots showing integrated analysis of Prrx1‐Cre‐ (8‐week‐old mice, n = 3 males) and Lepr‐Cre‐traced (8‐week‐old mice, n = 4 males) cells. Cells were colored by clusters (left) or samples (right). Top 20 PCs were chosen for the clustering.
Heatmap showing the relative expression levels (row‐wide Z score) of the 20 most significant markers for each cluster (rows) across cells in the 9 clusters (columns). Bars on the top were colored as in (B).
Violin plots showing the expression of feature genes for each cluster.
In situ hybridization of Col3a1 on femur sections. Col3a1 was expressed in the perichondral (a) and periosteal (b) regions, but not in the bone marrow. B: Bone; BM: Bone marrow; Peri: Periosteum; Endo: Endosteum. Scale bars are 100 µm. Arrowheads indicated the periosteum.
Relative contribution to each cluster by Prrx1‐Cre‐ and Lepr‐Cre‐traced cells after normalization to total cells (4,170 cells in Prrx1‐Cre, 3,050 cells in Lepr‐Cre).
UMAP plot showing the inferred trajectories by RNA velocity analysis.
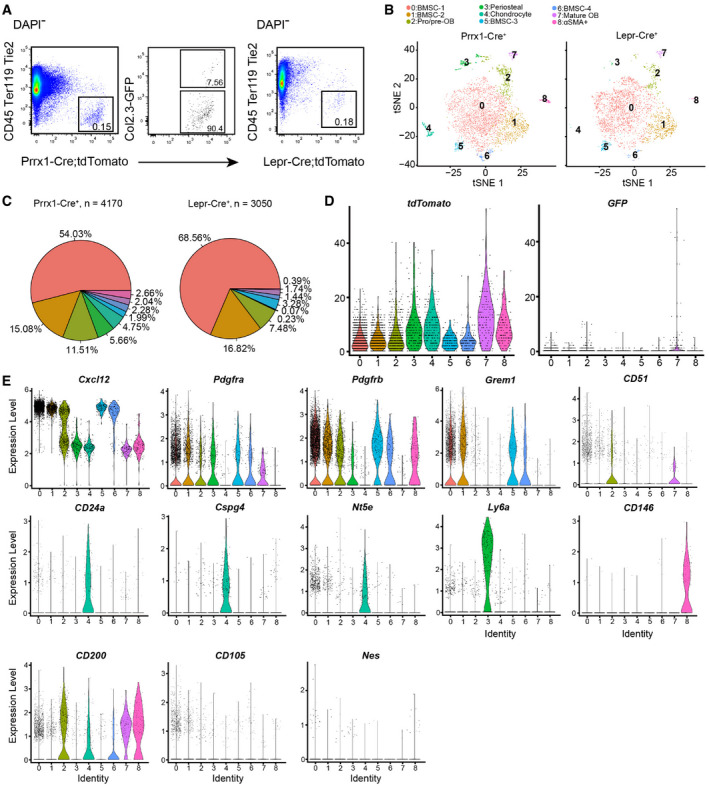
Flow cytometry gating strategy for Prrx1‐Cre; tdTomato; Col2.3‐GFP and Lepr‐Cre; tdTomato mice.
t‐SNE plots showing cells sorted from Prrx1‐Cre; tdTomato; Col2.3‐GFP (left) and Lepr‐Cre; tdTomato mice (right). Cells were colored by clustering.
Pie graphs showing the cell frequency distribution. Colored as in (B).
Violin plots showing the expression levels of tdTomato (left) and GFP (right) transcripts. Clusters are colored as in (B).
Violin plots showing the expression levels of skeletal stem and progenitor cell markers in each cluster (colored as in B).
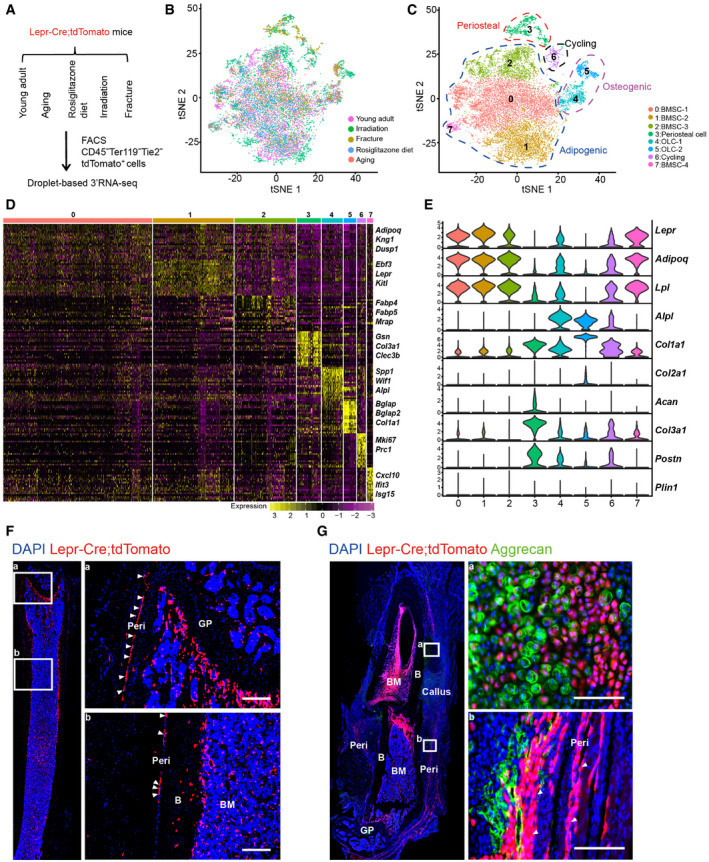
- A
Schematic overview of scRNA‐seq strategies in Lepr‐Cre; tdTomato mice. Young adult: 8‐week‐old mice (4 males and 2 females); Aging: 12‐month‐old mice (4 females); Rosiglitazone diet: 10‐week‐old mice (feeding started at 5 weeks old, 2 females); Irradiation: 8‐week‐old mice (sub‐lethally irradiated at 7 weeks old, 2 males and 2 females); Fracture: 8‐week‐old mice (femur fractured at 7 weeks old, 2 males and 2 females).
- B, C
t‐SNE plots showing 17,224 CD45− Ter119− Tie2− tdTomato+ single cells from all 5 conditions. Cells are colored by conditions (B) or clustering (C). The adipogenic, osteogenic, periosteal, and cycling cells were highlighted by dotted lines in (C). Top 20 PCs were chosen for the clustering.
- D
Heatmap showing the relative expression levels (row‐wide Z score) of the 20 most significant markers for each cluster (rows) across cells in the 8 clusters (columns). Bars on the top were colored as in (C).
- E
Violin plots showing the expression of feature genes for each cluster.
- F
Immunofluorescent images of the distal femur in 8‐week‐old Lepr‐Cre; tdTomato mice. Arrowheads indicated tdTomato+ periosteal cells. Two representative periosteal regions were magnified (a and b). GP: Growth plate. B: Bone. BM: Bone marrow. Peri: Periosteum. Scale bars are 100 µm.
- G
Immunofluorescent images of the distal femur in 8‐week‐old Lepr‐Cre; tdTomato mice 7 days after fracture. Aggrecan (green), tdTomato (red), DAPI (blue). Arrowheads indicated tdTomato+ periosteal cells. Two representative regions were magnified (a and b). Scale bars are 100 µm.
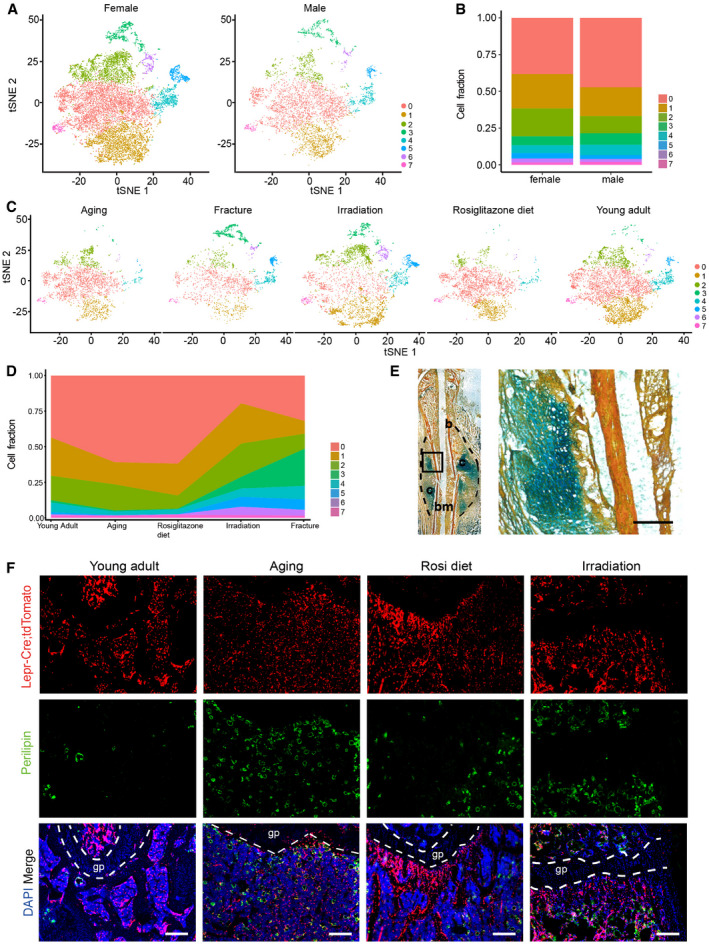
t‐SNE plots showing segregation of female and male cells. Colored as in Fig 2C.
Cluster frequencies after segregation of female and male cells.
t‐SNE plots showing Lepr‐Cre‐traced cells split by conditions. Colored as in Fig 2C.
Frequencies of different clusters under homeostatic and stress conditions.
Movat’s pentachrome staining of the bone callus 7 days after femur fracture. Bone (b), cartilage (c), and bone marrow (bm) regions were indicated (left panel). The dashed area indicates the fracture callus. An enlarged view of the boxed cartilaginous area in the left panel is shown on the right. Scale bar is 100 µm.
Immunofluorescent images of Perilipin (green) in the distal femur metaphysis of Lepr‐Cre; tdTomato mice under homeostatic and adipogenic stress conditions. gp: Growth plate. Scale bars are 100 µm.
- A
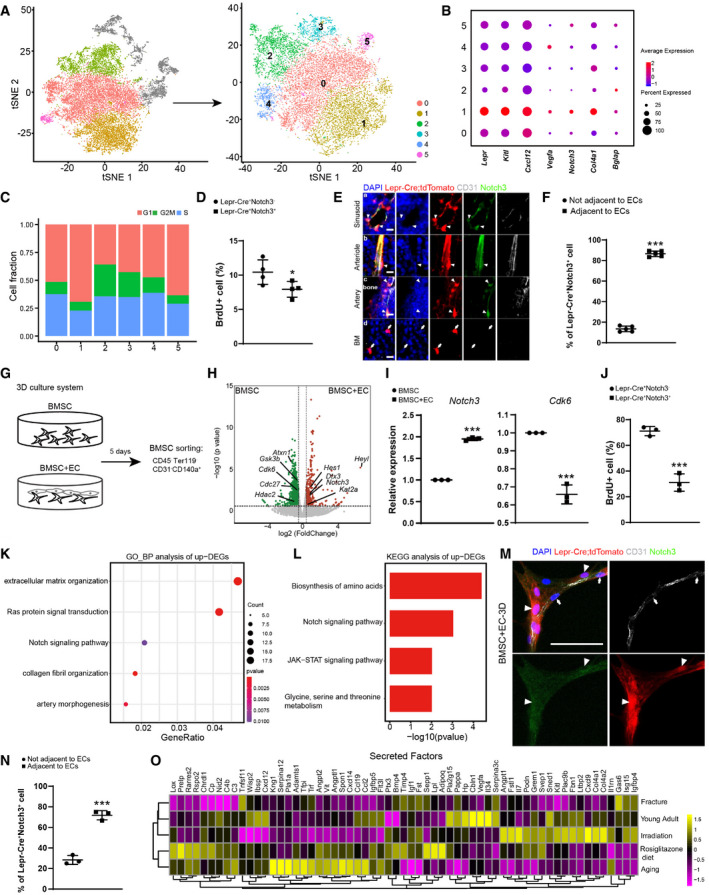
t‐SNE plots showing the original (left) and re‐clustered (right) adipogenic lineage cells by integrated analysis of homeostatic and stress conditions. Top 15 PCs were chosen for the clustering.
- B
Dot plots showing the gene expression patterns of selected genes in each cluster.
- C
Stacked bar charts showing the cell cycle status in all clusters.
- D
Flow cytometry analysis of BrdU incorporation in uncultured Lepr‐Cre+Notch3+/− BMSCs (n = 4 independent experiments). Eight‐week‐old Lepr‐Cre; tdTomato mice were given a single intraperitoneal injection of BrdU (100 mg/kg body mass) and maintained on 0.5 mg/ml of BrdU in the drinking water for 14 days.
- E
Immunofluorescent images of the distal femur in 8‐week‐old Lepr‐Cre; tdTomato mice. Notch3 (green), tdTomato (red), CD31 (gray), DAPI (blue). Sinusoid (a), arteriole (b), artery (c), and avascular bone marrow (BM, d) regions are shown. Arrowheads indicated Notch3+ tdTomato+ adventitial cells closely associated with ECs. Arrows indicated Notch3− tdTomato+ reticular cells in the bone marrow that were not associated with ECs. Scale bars are 10 µm.
- F
Localization quantification of Lepr‐Cre+Notch3+ cells relative to bone marrow ECs (n = 5 biological replicates from three independent experiments). Cells within 5 µm diameter of ECs were considered adjacent.
- G
Graphical illustration of the 3D co‐culture system.
- H
Volcano plot showing DEGs in the bulk RNA‐seq analysis (n = 3 biological replicates). Green dots represent down‐regulated genes. Red dots represent up‐regulated genes.
- I
qPCR analysis of Notch3 and Cdk6 expression (n = 3 independent experiments).
- J
Flow cytometry analysis of BrdU incorporation in Lepr‐Cre+Notch3+/− BMSCs after 3D co‐cultured with bone marrow ECs (n = 3 independent experiments). BrdU was administered at a final concentration of 10 µM from culture day 1 to day 5.
- K, L
GO terms (K) and KEGG pathways (L) enriched in up‐regulated genes.
- M
Representative confocal images of BMSCs 3D co‐cultured with bone marrow ECs. Z‐stack projection is shown. Notch3 (green), tdTomato (red), CD31 (gray), DAPI (blue). Arrowheads indicated Notch3+tdTomato+ adventitial cells. Arrows indicated bone marrow ECs. Scale bar is 50 µm.
- N
Localization quantification of Lepr‐Cre+Notch3+ cells relative to bone marrow ECs after 3D co‐culture (n = 3 biological replicates from three independent experiments). Cells within 25 µm diameter of ECs were considered adjacent.
- O
Heatmap showing the average expression levels (column‐wide Z score) of secreted factors with clustering.
- A
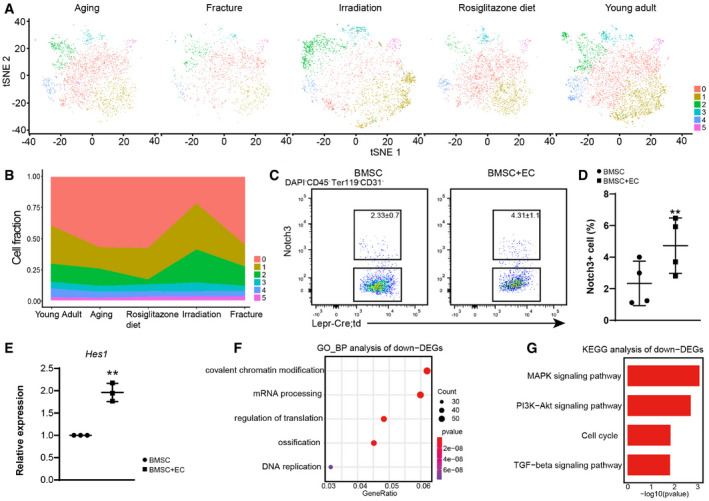
t‐SNE plots showing adipogenic sub‐clusters split by conditions. Colored as in Fig 3A.
- B
Frequencies of different adipogenic clusters under homeostatic and stress conditions.
- C, D
Flow cytometry quantification of Lepr‐Cre+Notch3+ BMSCs cultured with or without bone marrow ECs ex vivo (n = 4 independent experiments). The statistical significance of differences was analyzed by two‐tailed paired Student’s t‐test.
- E
qPCR analysis of Hes1 expression (n = 3 independent experiments). The statistical significance of differences was analyzed by two‐tailed unpaired Student’s t‐test.
- F, G
GO terms (F) and KEGG pathways (G) enriched in down‐regulated genes.
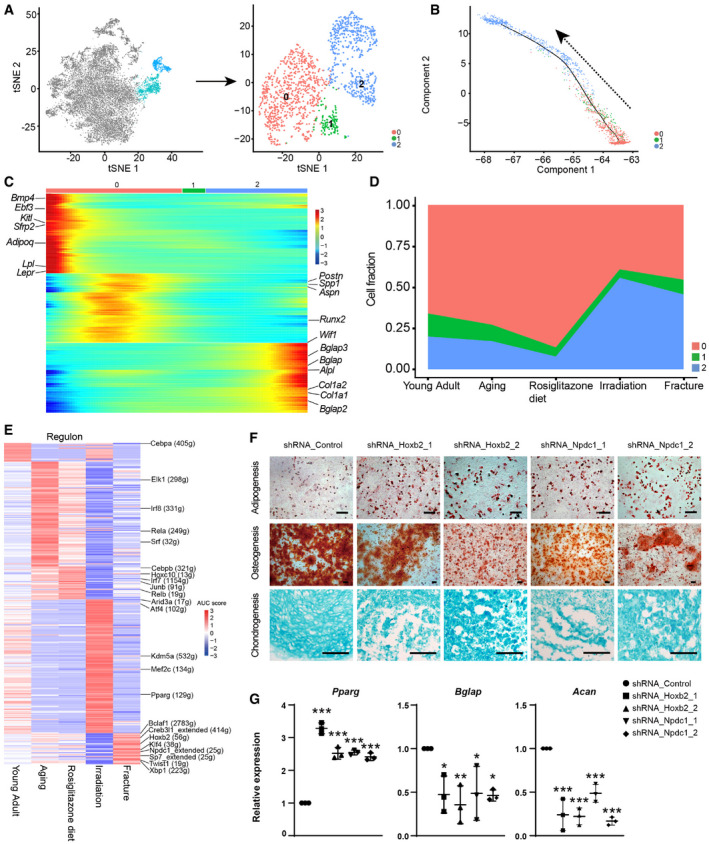
t‐SNE plots showing the original (left) and re‐clustered (right) osteogenic lineage cells by integrated analysis of homeostatic and stress conditions. Top 10 PCs were chosen for the clustering.
Pseudotime analysis by Monocle 2. Arrow indicated inferred direction of the differentiation trajectory.
Heatmap showing pseudotime‐dependent gene expression. Bars on the top were colored as in (A). Representative genes are highlighted on both sides.
Frequencies of different osteogenic clusters under homeostatic and stress conditions.
Heatmap showing the AUC score of regulons enriched in each stress. Z‐score (row scaling) was calculated. Representative regulons were highlighted on the right.
Representative images of adipogenic, osteogenic and chondrogenic differentiation following shRNA knockdown in Lepr‐Cre+ BMSCs. Scale bars are 100 µm.
qPCR analysis of the expression levels of Pparg, Bglap, and Acan in control or knockdown group (n = 3 independent experiments). The statistical significance of differences was analyzed by one‐way ANOVAs with Tukey’s multiple comparison tests. Data represented Mean ± SD. *P < 0.05, **P < 0.01, ***P < 0.001.
- A
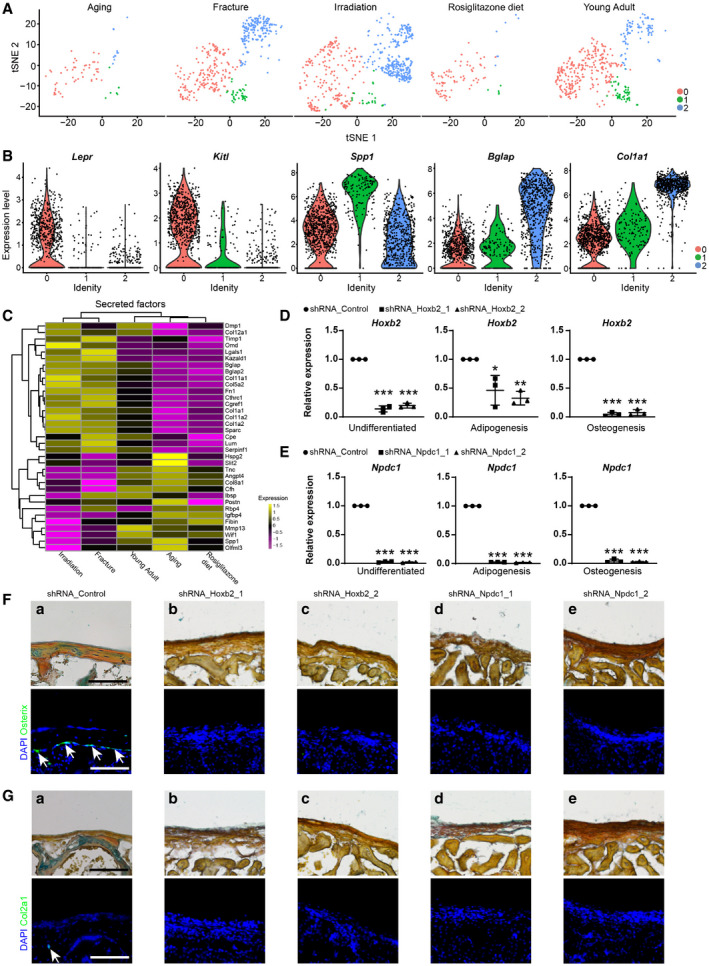
t‐SNE plots showing osteogenic sub‐clusters split by conditions. Colored as in Fig 4A.
- B
Violin plots showing the expression levels of selected marker genes in each sub‐cluster.
- C
Heatmap showing the secreted factors enriched in osteogenic clusters under homeostatic and stress conditions with clustering. Z‐score (row scaling) was calculated.
- D, E
qPCR analysis of Hoxb2 (D) and Npdc1 (E) knockdown efficiency in BMSC before and after adipogenic or osteogenic differentiation (n = 3 independent experiments). The statistical significance of differences was analyzed by two‐tailed unpaired Student’s t test. Data represented Mean ± SD. *P < 0.05, **P < 0.01, ***P < 0.001.
- F
Representative renal sub‐capsular transplantation images. Movat’s pentachrome (upper panels) and immunostaining of Osterix (Sp7, lower panels) were performed to analyze bone ossicles 4 weeks after transplantation of control (a), Hoxb2‐ (b and c) or Npdc1‐deficient (d and e) BMSCs. Yellow stain: bone matrix and fibrotic tissue; Blue stain: cartilage matrix. Arrows indicated Osterix+ osteolineage cells. DAPI indicated the nucleus. Scale bars are 50 μm.
- G
Representative renal sub‐capsular transplantation images. Movat’s pentachrome (upper panels) and immunostaining of Col2a1 (lower panels) were performed to analyze bone ossicles 4 weeks after transplantation of control (a), Hoxb2‐ (b and c) or Npdc1‐deficient (d and e) BMSCs. Yellow stain: bone matrix and fibrotic tissue; Blue stain: cartilage matrix. Arrow indicated Col2a1+ chondrocyte. DAPI indicated the nucleus. Scale bars are 50 μm.
- A
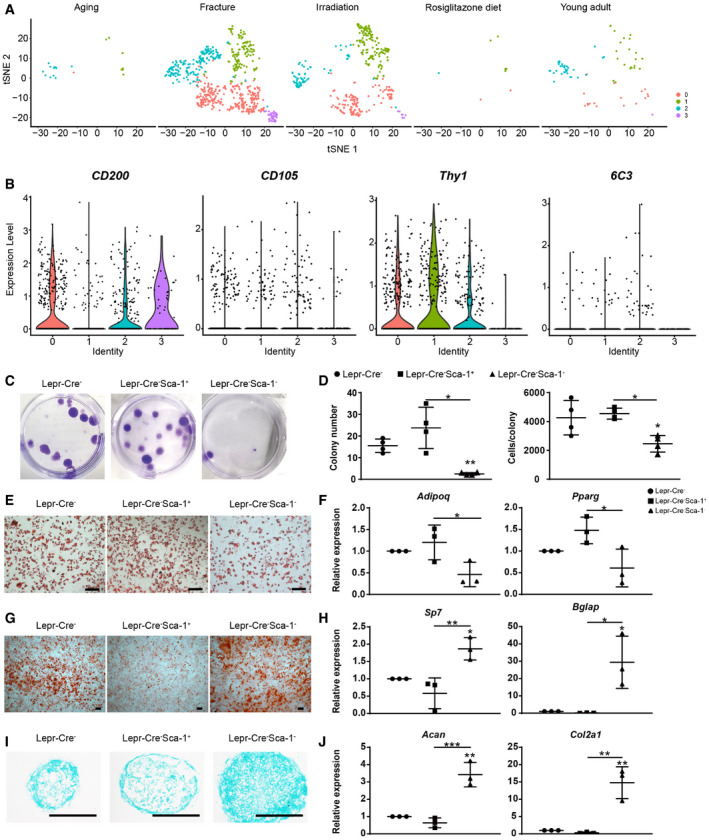
t‐SNE plots showing periosteal sub‐clusters split by conditions. Colored as in Fig 5A.
- B
Violin plots showing the expression of PSC marker genes in each sub‐cluster.
- C, D
Representative CFU‐F colony images with quantifications. Two hundred DAPI− CD45− Ter119− Tie2− tdTomato− (Lepr‐Cre−), DAPI− CD45− Ter119− Tie2− tdTomato− Sca‐1+ (Lepr‐Cre− Sca‐1+) or DAPI− CD45− Ter119− Tie2− tdTomato− Sca‐1− (Lepr‐Cre− Sca‐1−) cells were sorted from the limb bone periosteum of Lepr‐Cre; tdTomato mice and cultured for 8 days before crystal violet staining (C) and quantifications (D). The average number of CFU‐F colonies formed and the average cell number per colony are shown (D) (n = 4 independent experiments).
- E, F
Representative oil red staining after 7 days of adipogenic differentiation in Lepr‐Cre+ and Lepr‐Cre− subsets (E) and qPCR analysis of Adipoq and Pparg expression (F) (n = 3 independent experiments). Scale bars are 100 µm.
- G, H
Representative alizarin red staining after 14 days of osteogenic differentiation (G) in Lepr‐Cre− subsets and qPCR analysis of Sp7 and Bglap (H) (n = 3 independent experiments). Scale bars are 200 µm.
- I, J
Representative alcian blue staining after 21 days of chondrogenic differentiation (I) in Lepr‐Cre− subsets and qPCR analysis of Acan and Col2a1 expression (J) (n = 3 independent experiments). Scale bars are 100 µm.
- A
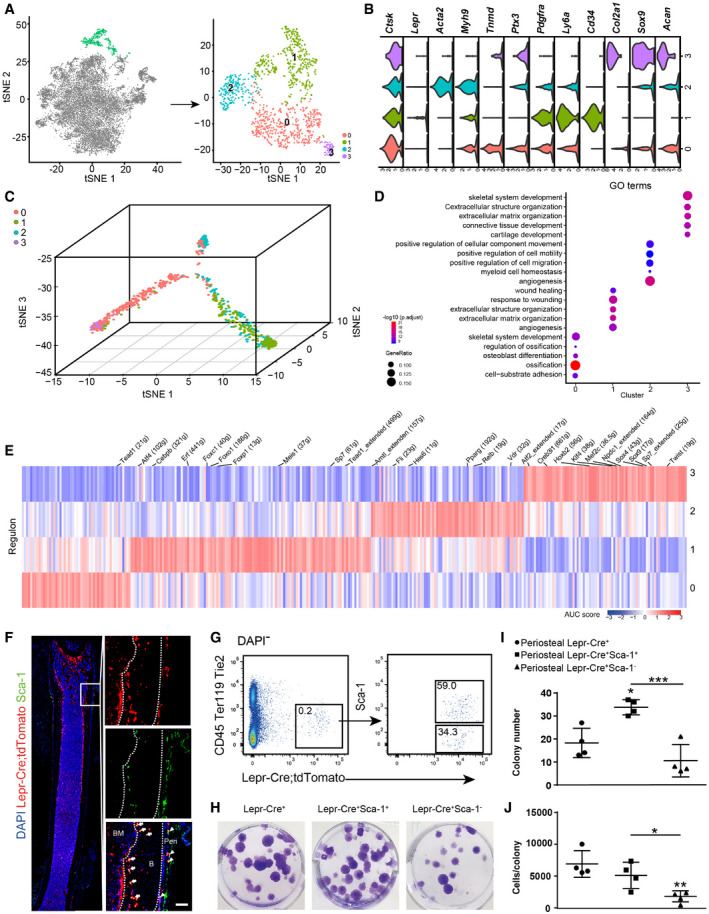
t‐SNE plots showing the original (left) and re‐clustered (right) periosteal lineage cells by integrated analysis of homeostatic and stress conditions. Top 10 PCs were chosen for the clustering.
- B
Violin plots showing the expression of feature genes for each cluster.
- C
Pseudotime trajectories of four clusters. Cells are colored as in (A).
- D
Dot plots showing the top5 GO terms enriched for each cluster.
- E
Heatmap showing the AUC score of regulons enriched in each cluster. Z‐score (column scaling) was calculated. Representative regulons are highlighted on the top.
- F
Immunostaining of Sca‐1 on femur sections of 8‐week‐old Lepr‐Cre; tdTomato mice. Arrows indicate Sca‐1+ tdTomato+ cells inside cortical bones of the femur diaphysis. Arrowheads indicate Sca‐1+ tdTomato+ cells in the femur periosteum. B: Bone. BM: Bone marrow. Peri: Periosteum. Scale bar is 100 µm.
- G
Representative flow cytometry plots of long bone periosteum in 8‐week‐old Lepr‐Cre; tdTomato mice. The percentage of DAPI− CD45− Ter119− Tie2− tdTomato+ Sca‐1+/− cells are shown.
- H
Representative CFU‐F colony images. Two hundred DAPI− CD45− Ter119− Tie2− tdTomato+ (Lepr‐Cre+), DAPI− CD45− Ter119− Tie2− tdTomato+ Sca‐1+ (Lepr‐Cre+Sca‐1+), or DAPI− CD45− Ter119− Tie2− tdTomato+ Sca‐1− (Lepr‐Cre+ Sca‐1−) cells were sorted from the limb bone periosteum of Lepr‐Cre; tdTomato mice and cultured for 8 days, followed by crystal violet staining.
- I, J
The average number of CFU‐F colonies formed (I) and the average cell number per colony (J) are shown (n = 4 independent experiments). The statistical significance of differences was assessed using one‐way ANOVAs with Tukey’s multiple comparison tests. All data represented Mean ± SD. *P < 0.05, **P < 0.01, ***P < 0.001.
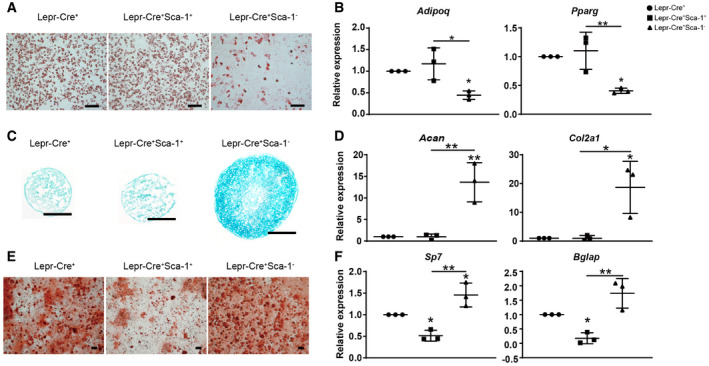
- A, B
Representative oil red staining after 7 days of adipogenic differentiation in Lepr‐Cre+ subsets (A) and qPCR analysis of Adipoq and Pparg expression (B) (n = 3 independent experiments). Scale bars are 100 µm.
- C, D
In vitro chondrogenic differentiation of sorted periosteal cells. Representative alcian blue staining after chondrogenic differentiation for 21 days and cryosection (C). Scale bars are 100 µm. Chondrogenic efficiencies were quantified by qPCR analysis of Acan and Col2a1 expression (D) (n = 3 independent experiments).
- E, F
In vitro osteogenic differentiation of sorted periosteal cells. Representative alizarin red staining after osteogenic differentiation for 14 days. Scale bars are 200 µm. Osteogenic efficiencies were quantified by qPCR analysis of Sp7 and Bglap expression (F) (n = 3 independent experiments).
Comment in
-
To the bones: mapping the skeletal LEPR+ pool to component cell types.EMBO J. 2022 Feb 15;41(4):e110343. doi: 10.15252/embj.2021110343. Epub 2022 Jan 10. EMBO J. 2022. PMID: 35005783 Free PMC article.
References
Publication types
MeSH terms
Substances
Associated data
- Actions
LinkOut - more resources
Full Text Sources
Medical
Molecular Biology Databases
Research Materials
Miscellaneous
