

Reduced Electroencephalogram Complexity in Postoperative Delirium
- PMID: 34958346
- PMCID: PMC8893195
- DOI: 10.1093/gerona/glab352
Reduced Electroencephalogram Complexity in Postoperative Delirium
Abstract
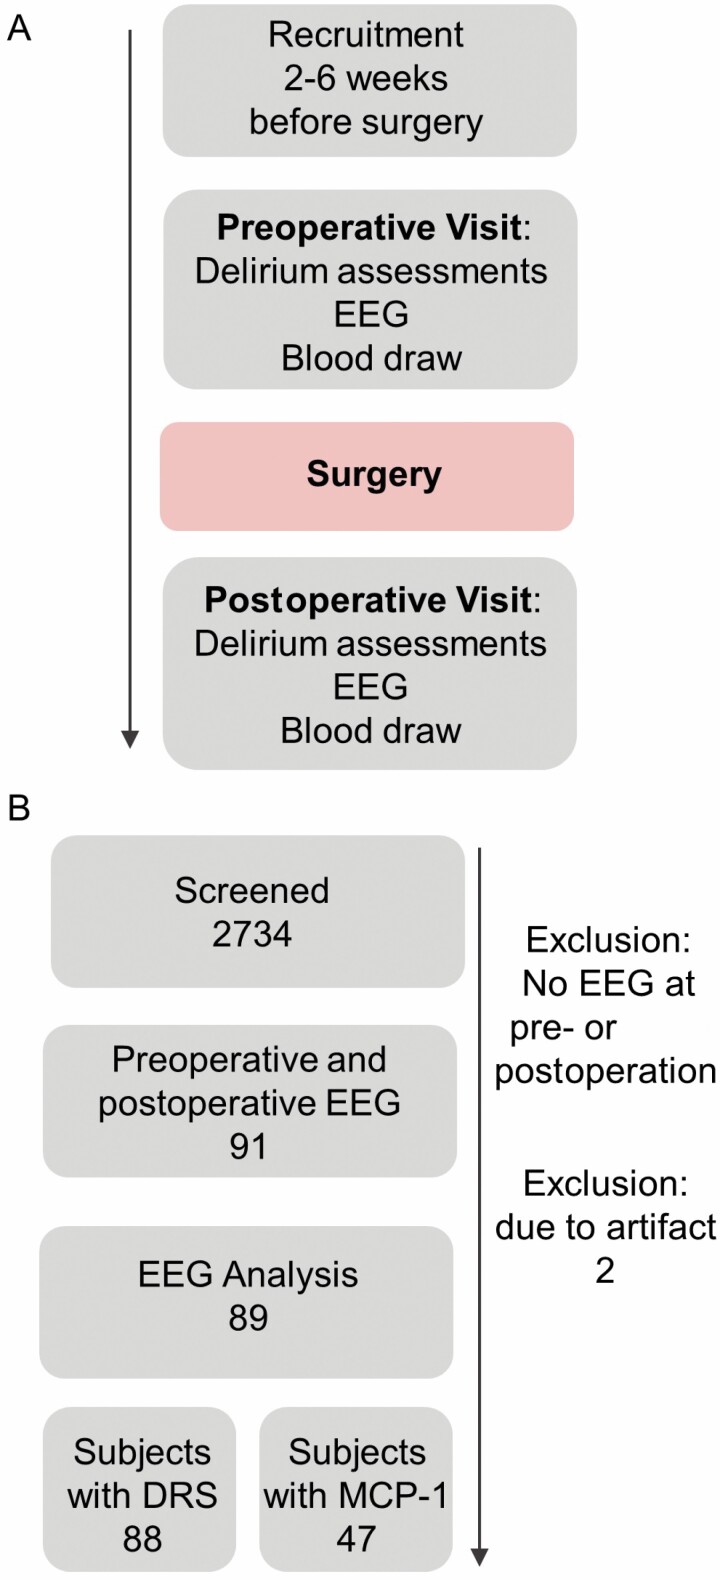
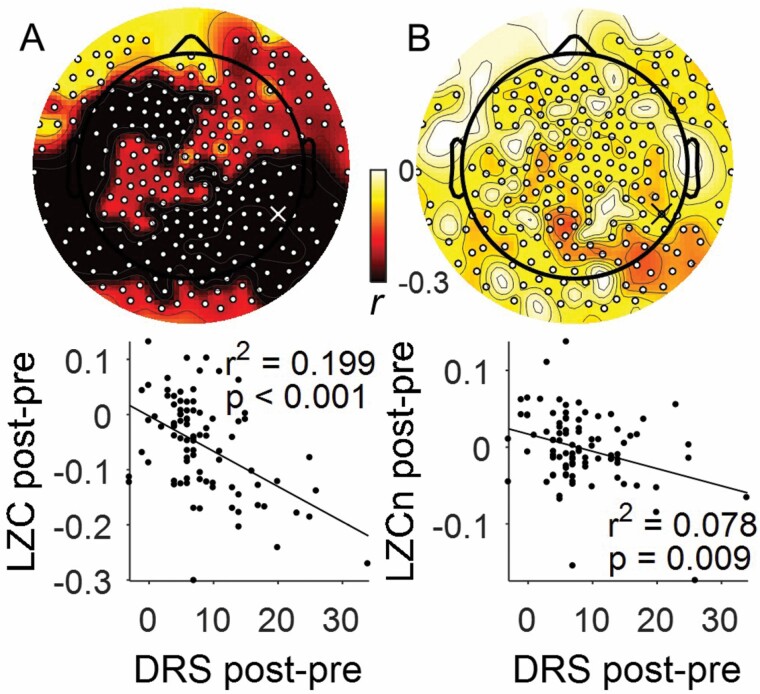
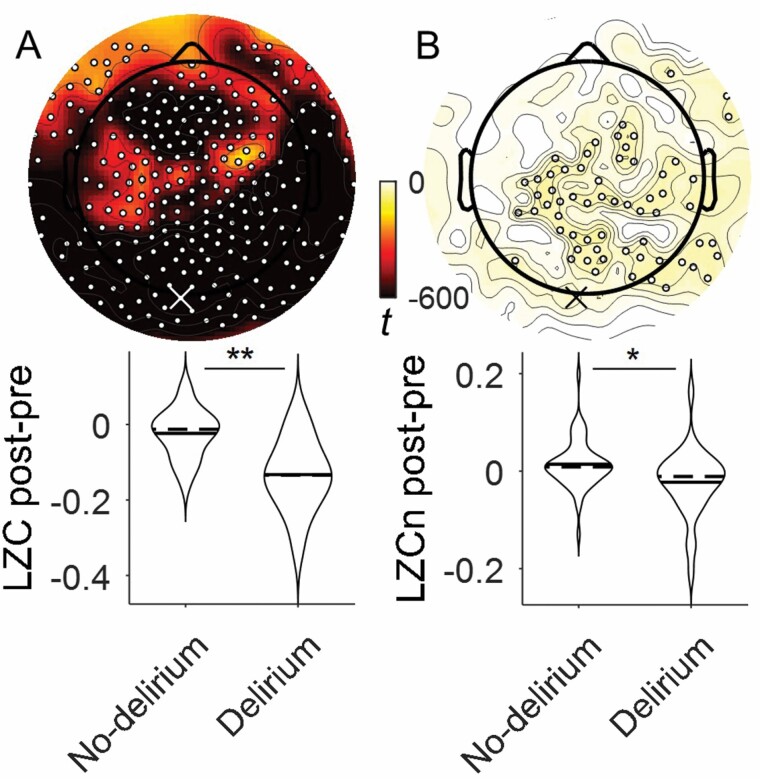
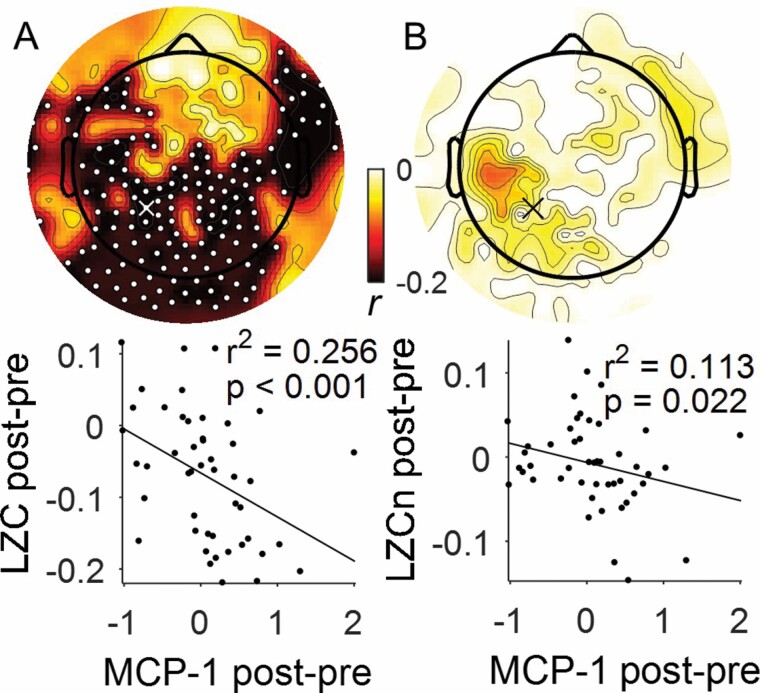
Delirium is associated with electroencephalogram (EEG) slowing and impairments in connectivity. We hypothesized that delirium would be accompanied by a reduction in the available cortical information (ie, there is less information processing occurring), as measured by a surrogate, Lempil-Ziv Complexity (LZC), a measure of time-domain complexity. Two ongoing perioperative cohort studies (NCT03124303, NCT02926417) contributed EEG data from 91 patients before and after surgery; 89 participants were used in the analyses. After cleaning and filtering (0.1-50Hz), the perioperative change in LZC and LZC normalized (LZCn) to a phase-shuffled distribution were calculated. The primary outcome was the correlation of within-patient paired changes in delirium severity (Delirium Rating Scale-98 [DRS]) and LZC. Scalp-wide threshold-free cluster enhancement was employed for multiple comparison correction. LZC negatively correlated with DRS in a scalp-wide manner (peak channel r2 = .199, p < .001). This whole brain effect remained for LZCn, though the correlations were weaker (peak channel r2 = .076, p = .010). Delirium diagnosis was similarly associated with decreases in LZC (peak channel p < .001). For LZCn, the topological significance was constrained to the midline posterior regions (peak channel p = .006). We found a negative correlation of LZC in the posterior and temporal regions with monocyte chemoattractant protein-1 (peak channel r2 = .264, p < .001, n = 47) but not for LZCn. Complexity of the EEG signal fades proportionately to delirium severity implying reduced cortical information. Peripheral inflammation, as assessed by monocyte chemoattractant protein-1, does not entirely account for this effect, suggesting that additional pathogenic mechanisms are involved.
Keywords: Age-related pathology; Inflammation; Neurodegeneration.
© The Author(s) 2021. Published by Oxford University Press on behalf of The Gerontological Society of America. All rights reserved. For permissions, please e-mail: journals.permissions@oup.com.
Figures
Comment in
-
Delirium and Cortical Complexity.J Gerontol A Biol Sci Med Sci. 2022 Nov 21;77(11):2219-2220. doi: 10.1093/gerona/glac163. J Gerontol A Biol Sci Med Sci. 2022. PMID: 35943887 Free PMC article. No abstract available.
-
Delirium and Cortical Complexity: Divergent Changes in Alpha and Theta Bands.J Gerontol A Biol Sci Med Sci. 2022 Nov 21;77(11):2221-2222. doi: 10.1093/gerona/glac165. J Gerontol A Biol Sci Med Sci. 2022. PMID: 35943896 Free PMC article. No abstract available.
References
-
- Tanabe S, Mohanty R, Lindroth H, et al. . Cohort study into the neural correlates of postoperative delirium: the role of connectivity and slow-wave activity. Br J Anaesth. 2020;125(1):55–66. doi:10.1016/j.bja.2020.02.027 - DOI - PMC - PubMed
-
- Sanders RD. Hypothesis for the pathophysiology of delirium: role of baseline brain network connectivity and changes in inhibitory tone. Med Hypotheses. 2011;77(1):140–143. doi:10.1016/j.mehy.2011.03.048 - DOI - PubMed
-
- Sanders RD, Pandharipande PP, Davidson AJ, Ma D, Maze M. Anticipating and managing postoperative delirium and cognitive decline in adults. BMJ. 2011;343:d4331. doi:10.1136/bmj.d4331 - DOI - PubMed
-
- Inouye SK, Westendorp RG, Saczynski JS. Delirium in elderly people. Lancet. 2014;383(9920):911–922. doi:10.1016/S0140-6736(13)60688-1 - DOI - PMC - PubMed
-
- Tononi G. An information integration theory of consciousness. BMC Neurosci. 2004;5:42. doi:10.1186/1471-2202-5-42 - DOI - PMC - PubMed
Publication types
MeSH terms
Substances
Associated data
Grants and funding
LinkOut - more resources
Full Text Sources
Medical
Research Materials
