. 2021 Jun;19(3):493-503.
doi: 10.1016/j.gpb.2020.09.006. Epub 2021 Dec 25.

Polar Gini Curve: A Technique to Discover Gene Expression Spatial Patterns from Single-cell RNA-seq Data

Affiliations

Polar Gini Curve: A Technique to Discover Gene Expression Spatial Patterns from Single-cell RNA-seq Data

Thanh Minh Nguyen et al. Genomics Proteomics Bioinformatics. 2021 Jun.

Abstract

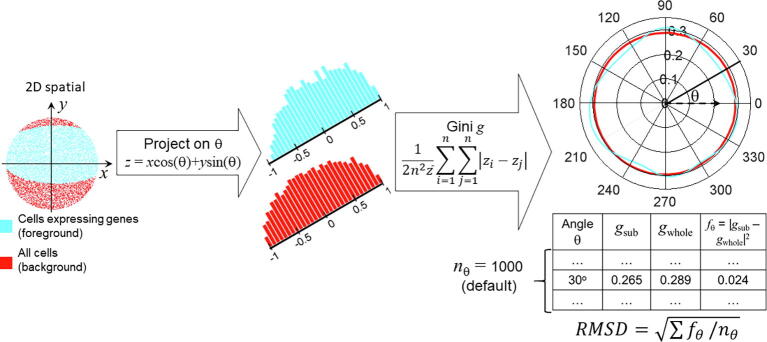
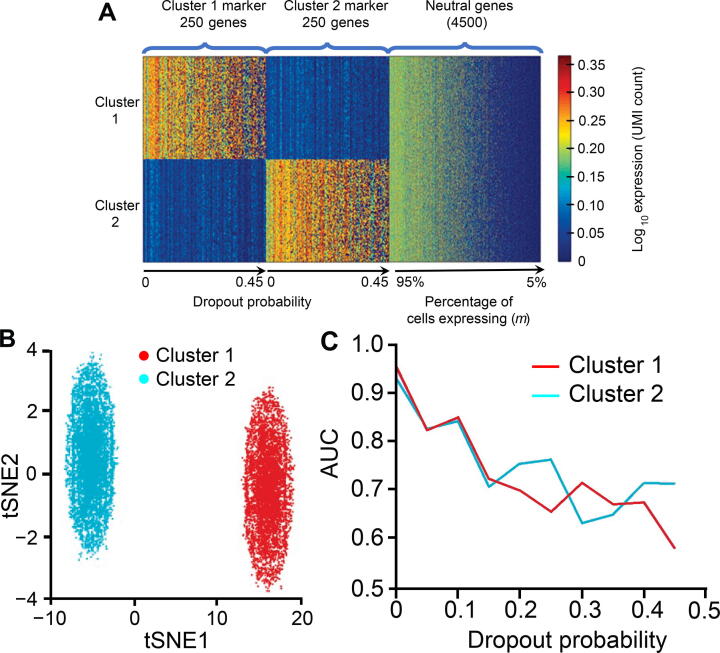
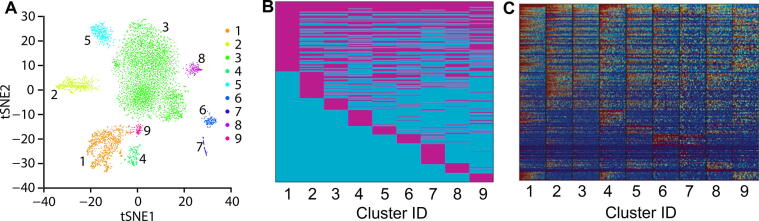
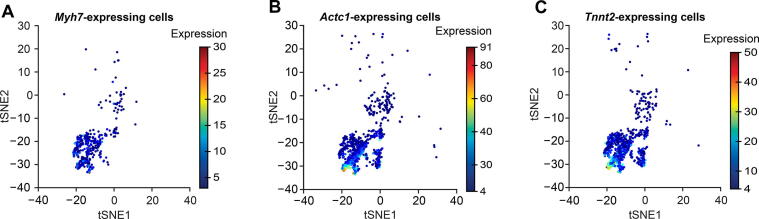
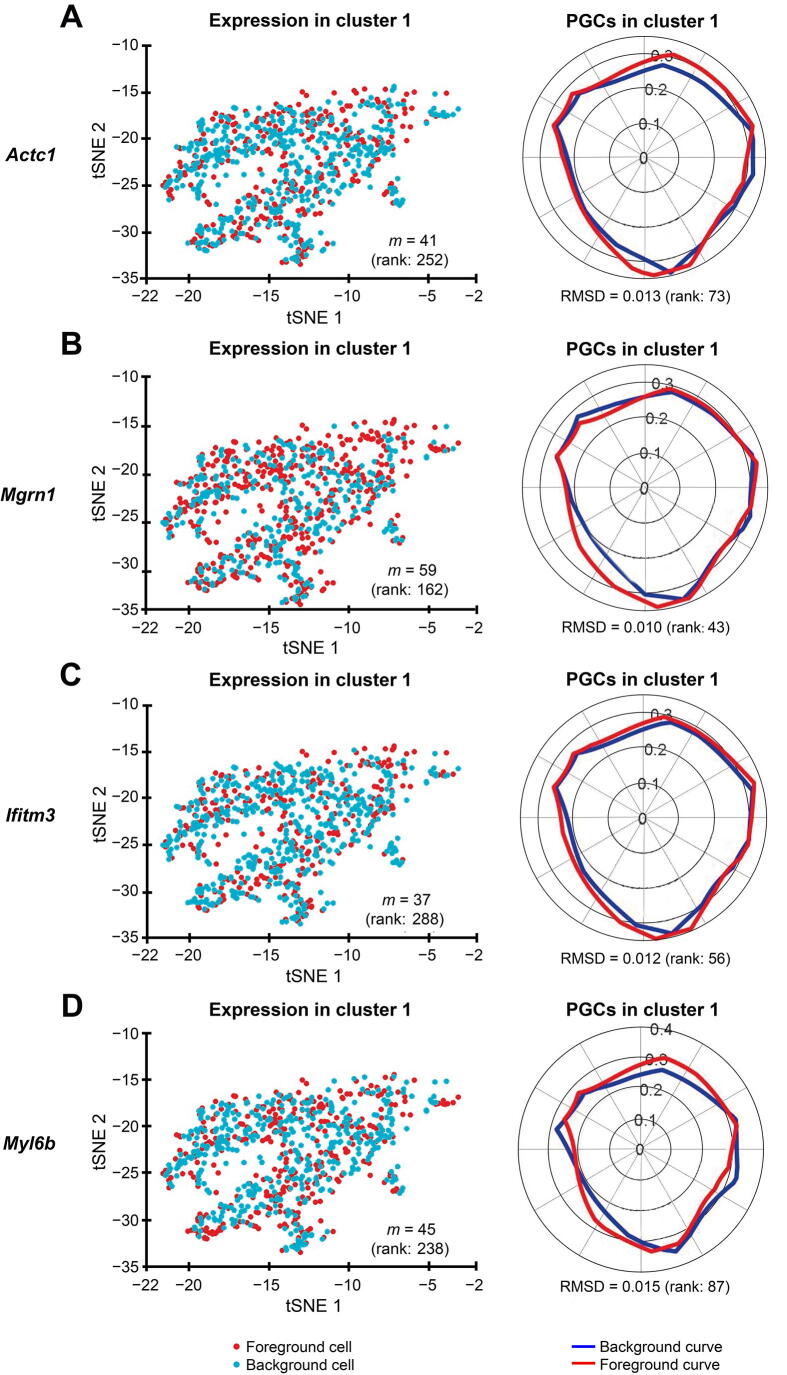
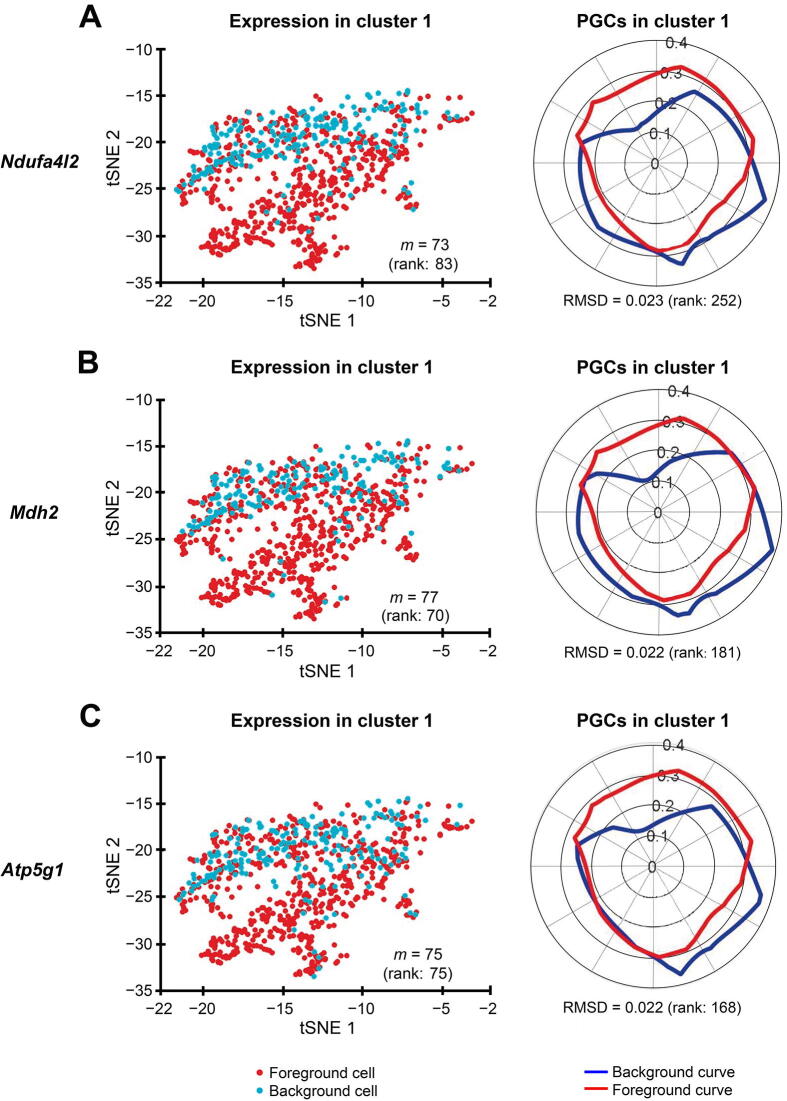
In this work, we describe the development of Polar Gini Curve, a method for characterizing cluster markers by analyzing single-cell RNA sequencing (scRNA-seq) data. Polar Gini Curve combines the gene expression and the 2D coordinates ("spatial") information to detect patterns of uniformity in any clustered cells from scRNA-seq data. We demonstrate that Polar Gini Curve can help users characterize the shape and density distribution of cells in a particular cluster, which can be generated during routine scRNA-seq data analysis. To quantify the extent to which a gene is uniformly distributed in a cell cluster space, we combine two polar Gini curves (PGCs)-one drawn upon the cell-points expressing the gene (the "foreground curve") and the other drawn upon all cell-points in the cluster (the "background curve"). We show that genes with highly dissimilar foreground and background curves tend not to uniformly distributed in the cell cluster-thus having spatially divergent gene expression patterns within the cluster. Genes with similar foreground and background curves tend to uniformly distributed in the cell cluster-thus having uniform gene expression patterns within the cluster. Such quantitative attributes of PGCs can be applied to sensitively discover biomarkers across clusters from scRNA-seq data. We demonstrate the performance of the Polar Gini Curve framework in several simulation case studies. Using this framework to analyze a real-world neonatal mouse heart cell dataset, the detected biomarkers may characterize novel subtypes of cardiac muscle cells. The source code and data for Polar Gini Curve could be found at http://discovery.informatics.uab.edu/PGC/ or https://figshare.com/projects/Polar_Gini_Curve/76749.

Keywords: Biomarker discovery; Polar Gini curve; Single-cell gene expression; Spatial pattern.


Figures

Figure 1
Figure 1
Overall workflow to compute RMSD metric for one gene in one cluster of cells Data points, histogram, and PGCs for cells expressing the gene (foreground) and all cells (background) are shown in cyan and red, respectively. PGC, polar Gini curve; RMSD, root mean square deviation.
Figure 2
Figure 2
A strong correlation between subcluster percentage and cluster–subcluster PGC fitness in a simulated uniformly-distributed and circular cluster Fitness between the cluster PGC and the subcluster PGC is represented by RMSD and m indicates the percentage of expressing cells in a subcluster. In the boxplot, ‘+’ represents the data point that are beyond the 5%–95% percentile. The simulated data and source code are presented in Supplemental Data 1.
Figure 3
Figure 3
Demonstration of Polar Gini Curve in mouse fetal lung single-cell data A. The UMAP plot showing the cluster selected for the experiment reported in . B. Correlation between subcluster percentage and Polar Gini Curve fitness. Fitness between the cluster PGC and the subcluster PGC is represented by RMSD and m indicates the percentage of expressing cells in a subcluster.
Figure 4
Figure 4
Demonstration of Polar Gini Curve characteristics using the ring-shape simulation study A. Visualization of the cluster with ring shape, which was generated from a simulated dataset. The ring is defined as the subcluster (m = 75). B. Two separated polar curves generated by applying Polar Gini Curve to the simulated dataset (RMSD = 0.033). C. Distribution of RMSD. Data were extracted from Figure 2 with m = 75, with the subcluster uniformly distributed on the cluster area.
Figure 5
Figure 5
Recalling cluster marker in dropout simulation based on RMSD A. Heatmap showing the simulation design of 500 markers (250 cluster 1 genes and 250 cluster 2 genes) and 4500 neutral genes, with dropout probability ranging 0–0.45 and percentage of cells expressing ranging 5%–95%, respectively. B. 2D visualization of the simulation data. C. Correlation between AUC and dropout probability.
Figure 6
Figure 6
Characterizing cell clusters and identifying cluster cell type by applying Polar Gini Curve to mouse neonatal heart scRNA-seq dataset A. tSNE plot showing 9 cell clusters for a mouse neonatal heart scRNA-seq dataset . B. Gene-cluster relationship for 258 genes identified based on RMSD, representing the union of 100 genes with the smallest RMSD found in each cluster. Genes identified as cluster markers are indicated in magenta and genes as non-markers are indicated in cyan. C. Expression heatmap for the 258 genes as indicated in (B).
Figure 7
Figure 7
UMAP plot for heart muscle cell clusters identified by gene expression heatmap Cell clusters were identified by the expression patterns of genes Myh7 (A), Actc1 (B), and Tnnt2 (C) in 9 cell clusters for a mouse neonatal heart scRNA-seq dataset as shown in Figure 6A. The data were obtained from http://bis.zju.edu.cn/MCA.
Figure 8
Figure 8
Polar Gini Curve highlights cluster 1 makers that do not have high percentage of expressing cells tSNE plots showing the expression of cluster 1 marker genes Actc1 (A), Mgrn1 (B),Ifitm3 (C), and Myl6b (D) are presented on the left and their respective PGCs are presented on the right. Number in the parenthesis indicates the rank of the respective gene in cluster 1. Genes are ranked based on the percentage of expressing cells (from the highest to the lowest, with low rank number indicating high percentage) on the left, and RMSD value (from the lowest to the highest, with low rank number indicating low RMSD value) on the right, respectively.
Figure 9
Figure 9
Polar Gini Curve shows that genes having high percentage of expressing cells may not be markers in cluster 1 tSNE plots show the expression of genes Ndufa4l2 (A), Mdh2 (B), and Atp5g1 (C). Genes appearing to highlight a local subcluster are presented on the left, and their respective PGCs are presented on the right. Number in the parenthesis indicates the rank of the respective gene in cluster 1. Genes are ranked based on the percentage of expressing cells (from the highest to the lowest, with low rank number indicating high percentage) on the left, and RMSD value (from the lowest to the highest, with low rank number indicating low RMSD value) on the right, respectively.
Figure 10
Figure 10
Performance in re-identifying cell cluster ID with Polar Gini Curve, SpatialDE, and DEG Accuracy in cell cluster prediction. B. Average AUC of 9 cell clusters predicted. The x-axis shows the number of top-significant markers being selected to train the prediction models. For Polar Gini Curve, markers were ranked from the lowest to the highest RMSD values (low rank number indicates low RMSD value), while for DEG and SpatialDE approaches (baseline), markers were ranked from the lowest to the highest P values (low rank number indicates low P value; P < 0.05 indicates statistical significance). Data were obtained from . More details are provided in the section for “Setting up the cluster ID re-identification”.

References

    1. Angerer P., Simon L., Tritschler S., Wolf F.A., Fischer D., Theis F.J. Single cells make big data: new challenges and opportunities in transcriptomics. Curr Opin Syst Biol. 2017;4:85–91.
    1. Wang K., Jiang S., Sun C., Lin Y., Yin R., Wang Y., et al. The spatial and temporal transcriptomic landscapes of ginseng, Panax ginseng C. A. Meyer. Sci Rep. 2016;5:18283. - PMC - PubMed
    1. Svensson V., Teichmann S.A., Stegle O. SpatialDE: identification of spatially variable genes. Nat Methods. 2018;15:343–346. - PMC - PubMed
    1. Edsgärd D., Johnsson P., Sandberg R. Identification of spatial expression trends in single-cell gene expression data. Nat Methods. 2018;15:339–342. - PMC - PubMed
    1. Cang Z., Nie Q. Inferring spatial and signaling relationships between cells from single cell transcriptomic data. Nat Commun. 2020;11:2084. - PMC - PubMed

Publication types