

Relationship of admission blood proteomic biomarkers levels to lesion type and lesion burden in traumatic brain injury: A CENTER-TBI study
- PMID: 34959133
- PMCID: PMC8718895
- DOI: 10.1016/j.ebiom.2021.103777
Relationship of admission blood proteomic biomarkers levels to lesion type and lesion burden in traumatic brain injury: A CENTER-TBI study
Abstract
Background: We aimed to understand the relationship between serum biomarker concentration and lesion type and volume found on computed tomography (CT) following all severities of TBI.
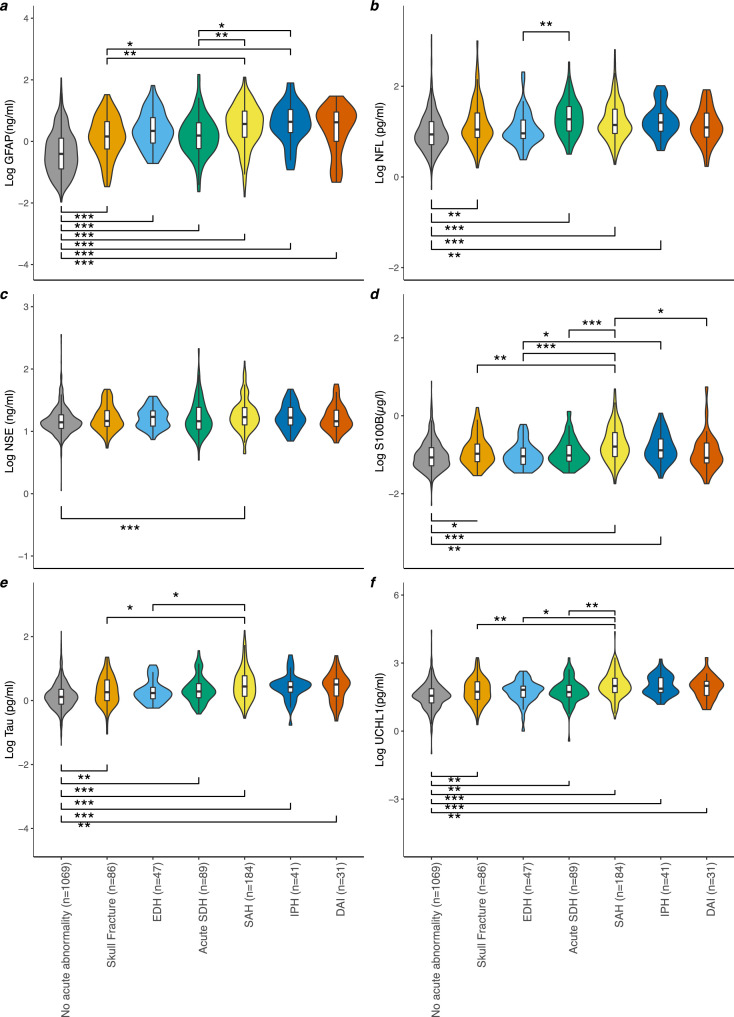
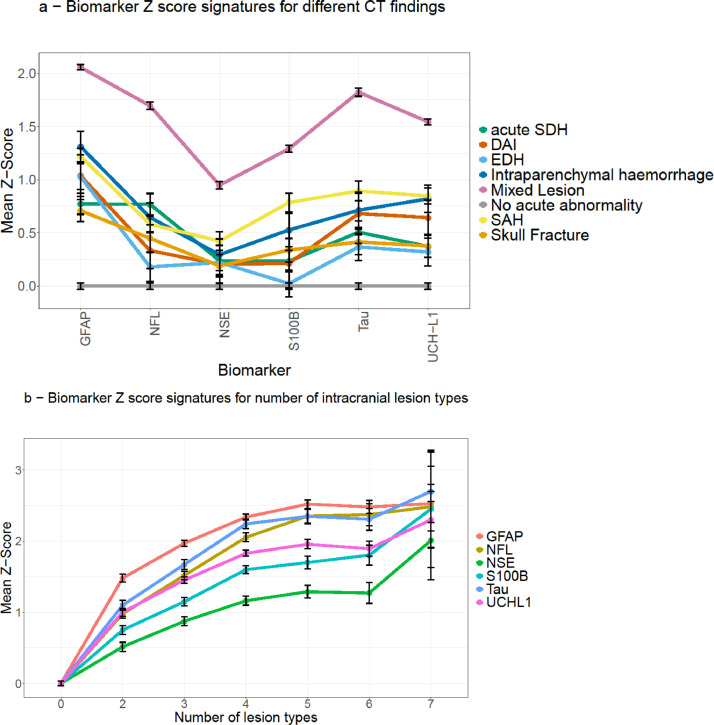
Methods: Concentrations of six serum biomarkers (GFAP, NFL, NSE, S100B, t-tau and UCH-L1) were measured in samples obtained <24 hours post-injury from 2869 patients with all severities of TBI, enrolled in the CENTER-TBI prospective cohort study (NCT02210221). Imaging phenotypes were defined as intraparenchymal haemorrhage (IPH), oedema, subdural haematoma (SDH), extradural haematoma (EDH), traumatic subarachnoid haemorrhage (tSAH), diffuse axonal injury (DAI), and intraventricular haemorrhage (IVH). Multivariable polynomial regression was performed to examine the association between biomarker levels and both distinct lesion types and lesion volumes. Hierarchical clustering was used to explore imaging phenotypes; and principal component analysis and k-means clustering of acute biomarker concentrations to explore patterns of biomarker clustering.
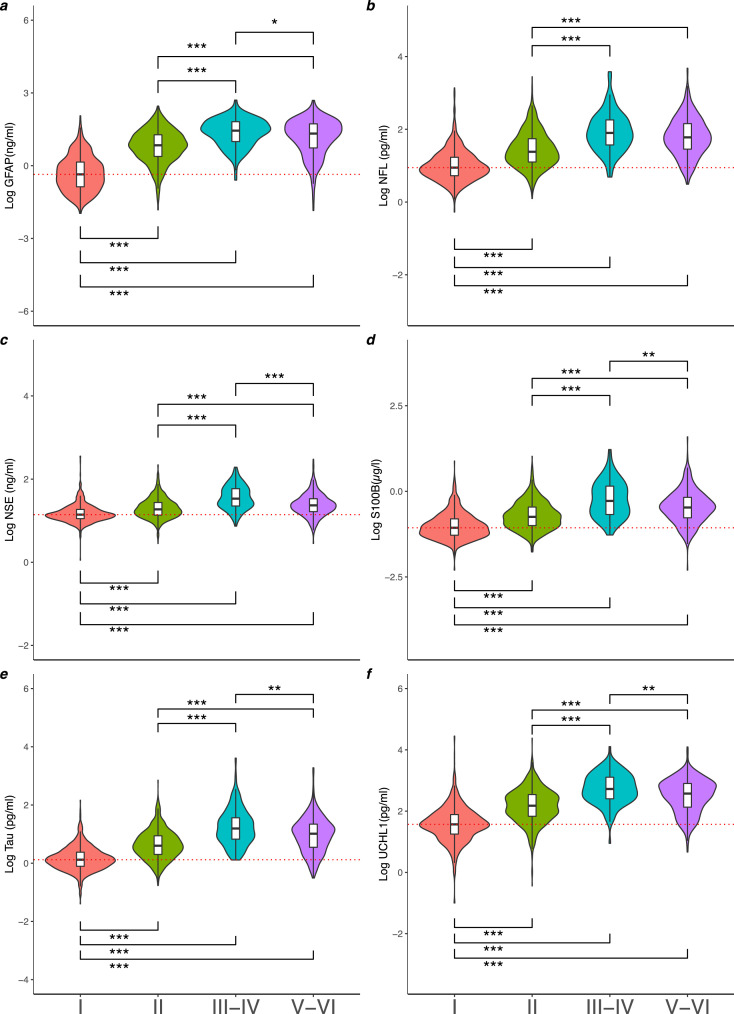
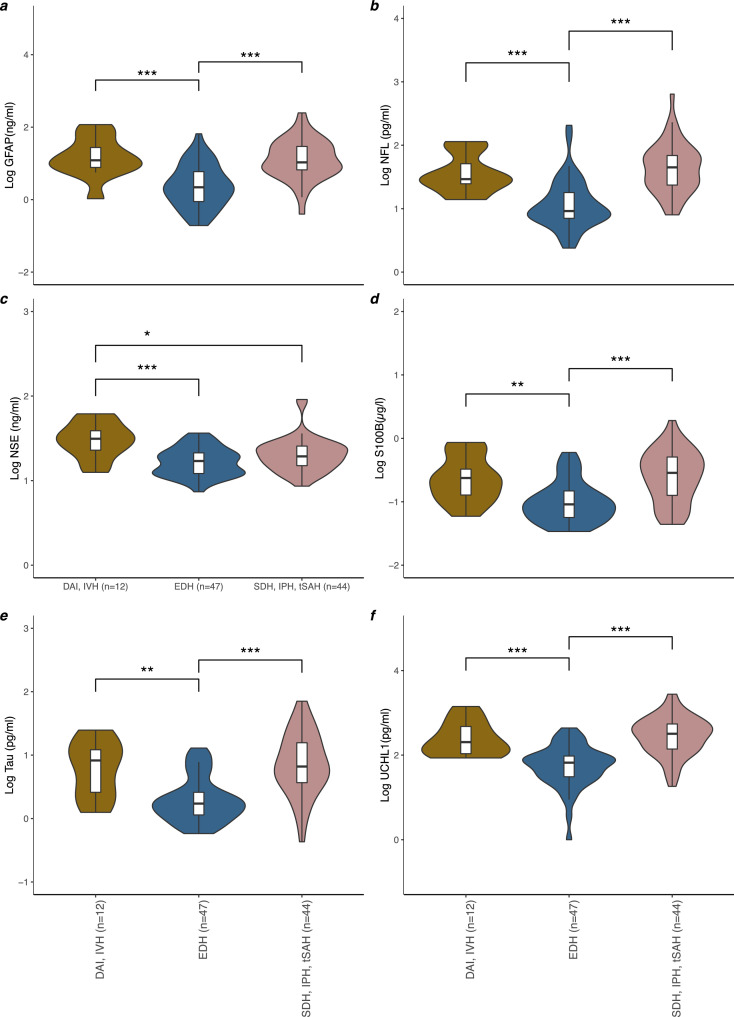
Findings: 2869 patient were included, 68% (n=1946) male with a median age of 49 years (range 2-96). All severities of TBI (mild, moderate and severe) were included for analysis with majority (n=1946, 68%) having a mild injury (GCS 13-15). Patients with severe diffuse injury (Marshall III/IV) showed significantly higher levels of all measured biomarkers, with the exception of NFL, than patients with focal mass lesions (Marshall grades V/VI). Patients with either DAI+IVH or SDH+IPH+tSAH, had significantly higher biomarker concentrations than patients with EDH. Higher biomarker concentrations were associated with greater volume of IPH (GFAP, S100B, t-tau;adj r2 range:0·48-0·49; p<0·05), oedema (GFAP, NFL, NSE, t-tau, UCH-L1;adj r2 range:0·44-0·44; p<0·01), IVH (S100B;adj r2 range:0.48-0.49; p<0.05), Unsupervised k-means biomarker clustering revealed two clusters explaining 83·9% of variance, with phenotyping characteristics related to clinical injury severity.
Interpretation: Interpretation: Biomarker concentration within 24 hours of TBI is primarily related to severity of injury and intracranial disease burden, rather than pathoanatomical type of injury.
Funding: CENTER-TBI is funded by the European Union 7th Framework programme (EC grant 602150).
Keywords: Biomarkers; Brain injury, Traumatic; Computed tomography; Neuroimaging.
Copyright © 2021 The Authors. Published by Elsevier B.V. All rights reserved.
Conflict of interest statement
Declaration of interests DKM reports: grants from the European Union (EU), the National Institute for Health Research UK supporting the submitted work; grants from GlaxoSmithKline Ltd and Lantmannen AB, consulting fees from Calico LLC, GlaxoSmithKline Ltd, Lantmannen AB and NeuroTrauma Sciences LLC, and personal fees from Integra Neurosciences outside the submitted work. BG has received grants from European Commission and UK Research and Innovation Engineering and Physical Sciences Research Council, during the conduct of this study; and is Scientific Advisor for Kheiron Medical Technologies, Advisor and Scientific Lead of the HeartFlow-Imperial Research Team, outside the submitted work. MM reports a ERC grant agreement and consultancy fees from Triradiate Industries, outside the submitted work. ES reports a FP7 grant from the EU supporting the submitted work, and royalties for the book “Clinical Prediction Models” published by Springer. AIRM reports a FP7 grant from the EU supporting the submitted work, and grants from NeuroTrauma Sciences, Hannelore Kohl Foundation, and IntegraLife Sciences, personal fees from PresSura Neuro as DSMB chairman outside of the submitted work. KKWW reports a FP7 grant from the EU supporting the submitted work, and as a shareholder of Gryphon Bio, Inc. VFJN reports an Academy of Medical Sciences/The Health Foundation Clinician Scientist Fellowship, during the conduct of this study; a grant from Roche Pharmaceuticals, and honorarium for talks from Neurodiem, outside the submitted work. All other authors declare no competing interests.
Figures
References
-
- Maas AIR. Prefactory comments: Promise and enigma of biomarkers for brain injury [Internet]. Vol. 3 DEC. Frontiers in Neurology. Frontiers. 2012 www.frontiersin.org [cited 2021 May 17]. p. 173. Available from. - PMC - PubMed
-
- Levin HS, Diaz-Arrastia RR. Diagnosis, prognosis, and clinical management of mild traumatic brain injury. Vol. 14. The Lancet Neurology. Lancet Publishing Group. 2015:506–517. - PubMed
-
- Stiell IG, Clement CM, Rowe BH, Schull MJ, Brison R, Cass D, et al. Comparison of the Canadian CT Head Rule and the New Orleans Criteria in patients with minor head injury. JAMA. 2019;294(12) http://www.ncbi.nlm.nih.gov/pubmed/16189364 [Internet]. 2005 Sep 28 [citedAug 26]1511–8Available from. - PubMed
-
- Bazarian JJ, Biberthaler P, Welch RD, Lewis LM, Barzo P, Bogner-Flatz V, et al. Serum GFAP and UCH-L1 for prediction of absence of intracranial injuries on head CT (ALERT-TBI): a multicentre observational study. Lancet Neurol [Internet] 2018 Sep 1;17(9):782–789. [cited 2020 Jul 7]Available from: 10.1016/ - PubMed
MeSH terms
Substances
LinkOut - more resources
Full Text Sources
Medical
Miscellaneous
