. 2021 Nov 26;14(12):1228.
doi: 10.3390/ph14121228.

Comprehensive Transcriptome and Pathway Analyses Revealed Central Role for Fascin in Promoting Triple-Negative Breast Cancer Progression

Affiliations

Comprehensive Transcriptome and Pathway Analyses Revealed Central Role for Fascin in Promoting Triple-Negative Breast Cancer Progression

Rayanah Barnawi et al. Pharmaceuticals (Basel). .

Abstract

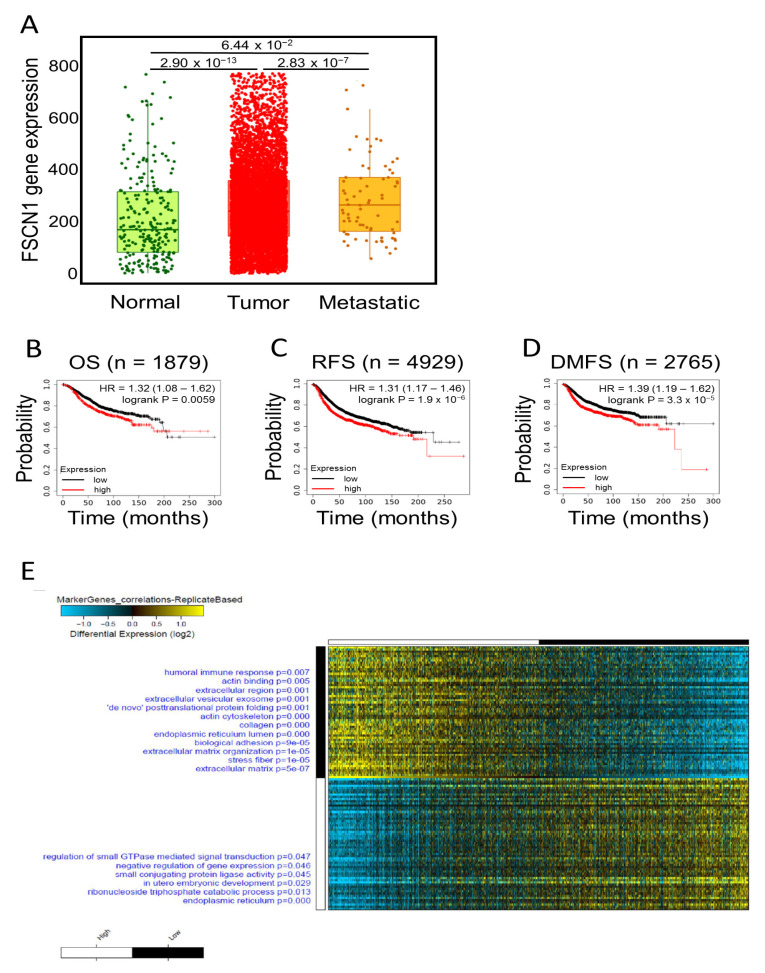
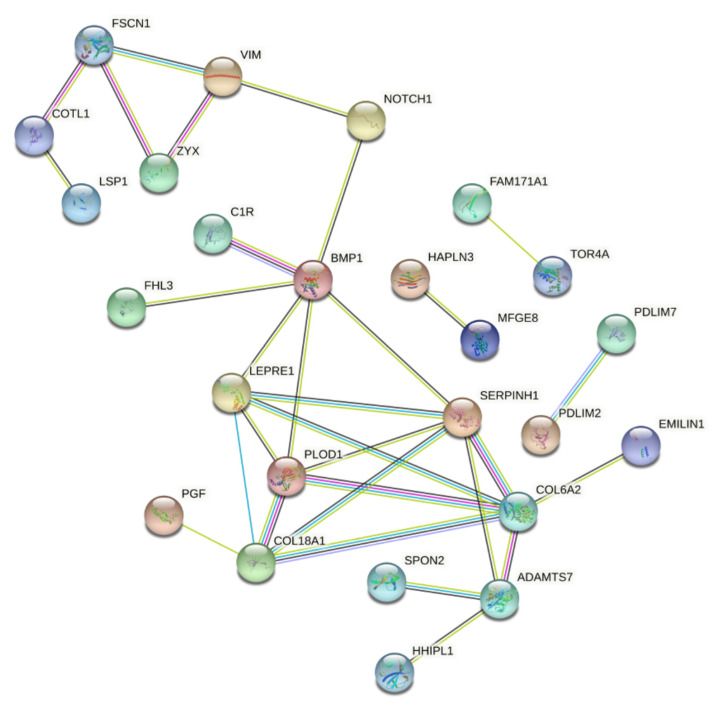
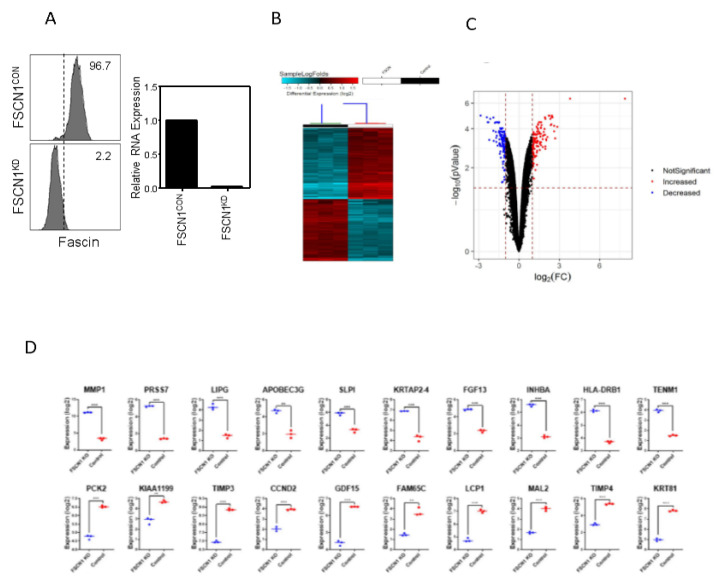
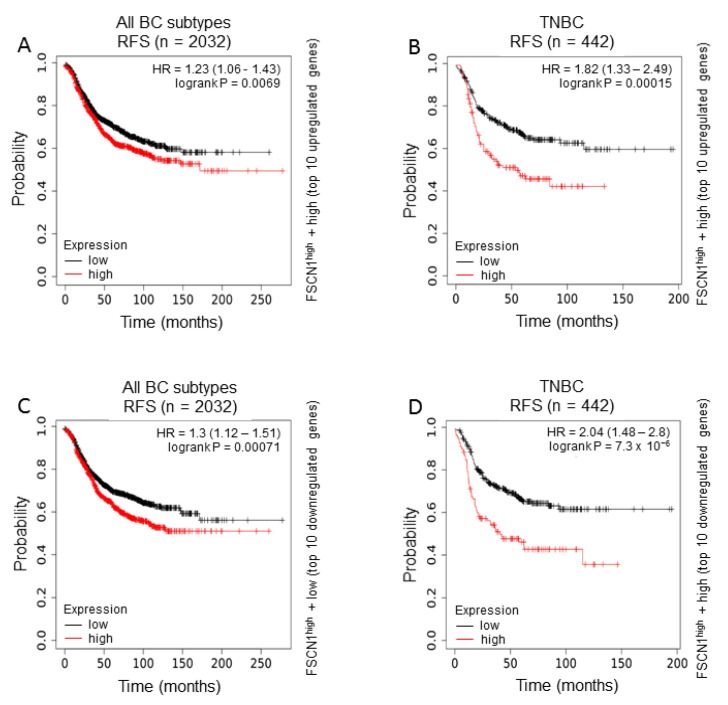
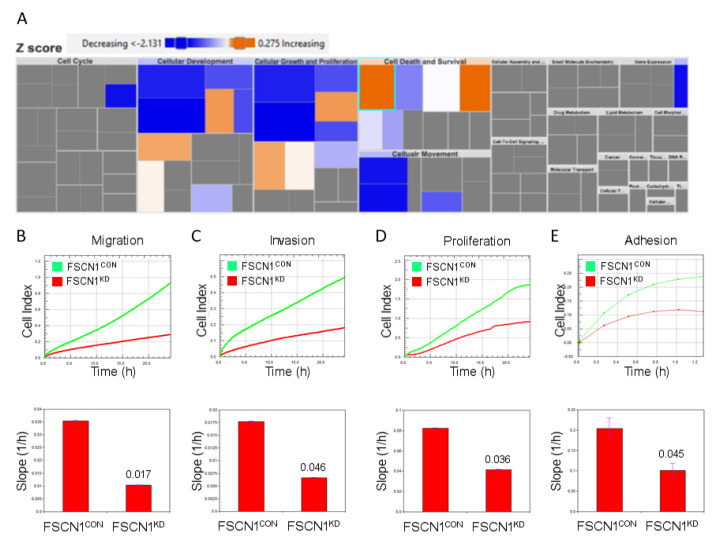
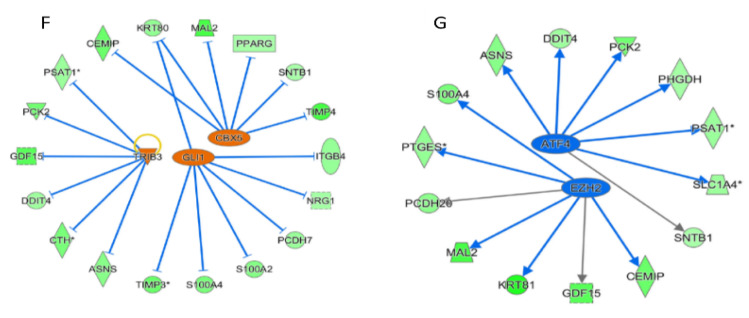
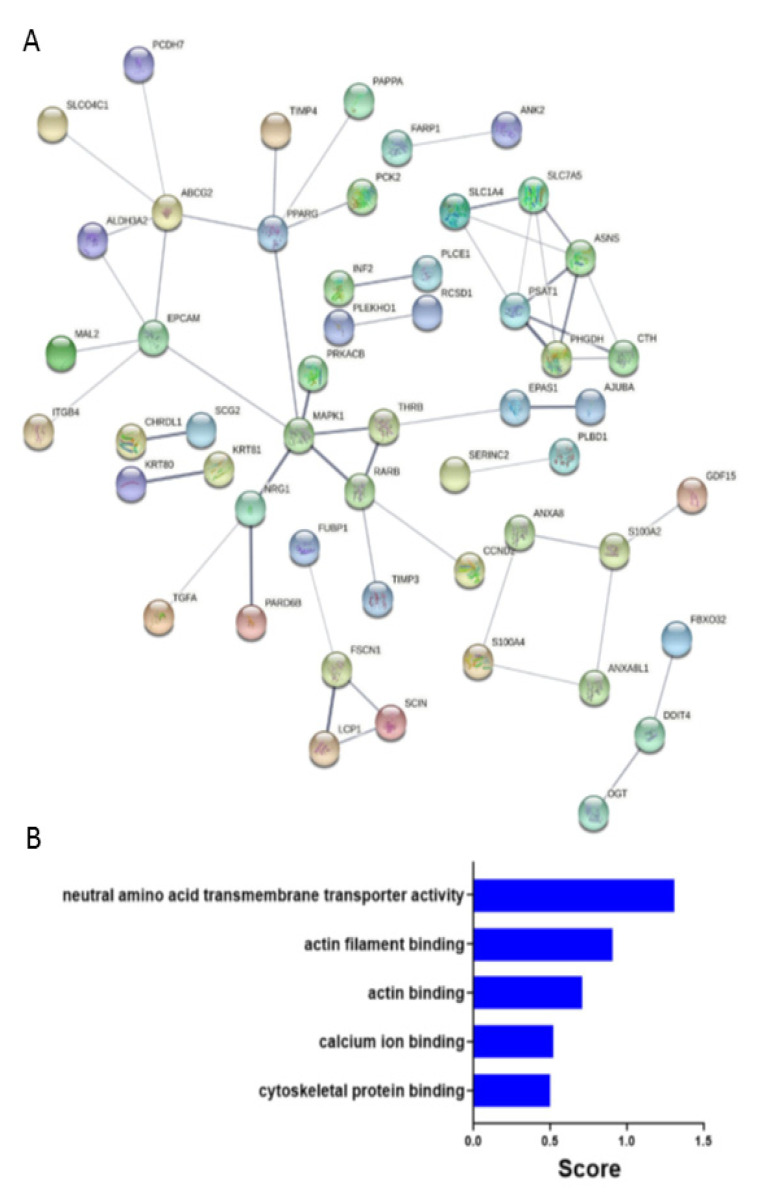
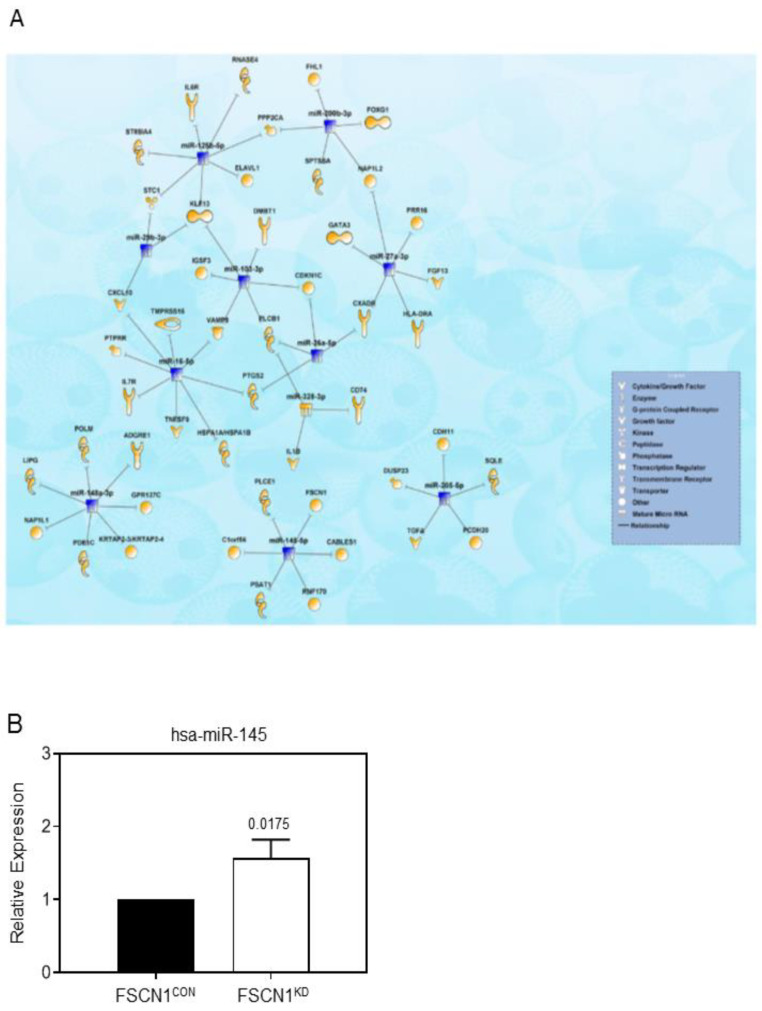
Recent years have witnessed major progress in development of novel therapeutic agents such as chemotherapy, targeted therapy and immune checkpoint inhibitors for breast cancer. However, cancer-related death remains high especially in triple-negative breast cancer (TNBC) due limited therapeutic options. Development of targeted therapies for TNBC requires better understanding of biology and signaling networks that promote disease progression. Fascin, an actin bundling protein, was identified as a key regulator of many signaling pathways that contribute to breast cancer progression. Herein, fascin ShRNA was used to generate stable fascin knockdown (FSCN1KD) in the MDA-MB-231 TNBC cell line and then were subjected to comprehensive mRNA and miRNA transcriptome analysis. We identified 129 upregulated and 114 downregulated mRNA transcripts, while 14 miRNAs were differentially expressed in FSCN1KD. Ingenuity pathway analysis (IPA) was used to predict the impact of differentially expressed transcripts on signaling pathways and functional categories and to construct miRNA-mRNA regulatory networks in the context of FSCN1 knockdown. Compared to FSCN1KD, fascin-positive (FSCN1CON) breast cancer cells showed enrichment in genes promoting cellular proliferation, migration, survival, DNA replication and repair. Expression of FSCN1high (identified in BRCA dataset from TCGA) in conjunction with elevated expression of the top 10 upregulated or decreased expression of the top 10 downregulated genes (identified in our FSCN1CON vs. FSCN1KD) correlates with worst survival outcome. Taken together, these data confirmed fascin's role in promoting TNBC progression, and identified a novel opportunity for therapeutic interventions via targeting those FSCN1-related transcripts.

Keywords: IPA; breast cancer; fascin; miRNA; pathway analysis; transcriptome.


Conflict of interest statement

The authors declare no conflict of interest.

Figures

Figure 1
Figure 1
Expression, survival and differential gene expression in FSCN1high compared to FSCN1low breast cancer patients from TCGA dataset. (A) Boxplot showing fascin expression in normal (n = 242), tumor (n = 7569) and metastatic (n = 82) breast cancer patients. Kaplan-Meier plots showing (B) overall survival (OS; n = 1879), (C) recurrence-free survival (RFS; n = 4929) and (D) distant metastasis-free survival (DMFS; n = 2765) as function of median FSCN1 expression in breast cancer patients. The significance between FSCN1high and FSCN1low groups was calculated using the log-rank test. p-values are indicated on each plot. (E) Marker discovery analysis to identify putative markers selectively expressed in FSCN1high (n = 534) vs. FSCN1low (n = 545) stratified according to median FSCN1 expression from TCGA BRCA dataset (n = 1217). Enriched gene ontology (GO) associations are indicated on the y axis.
Figure 2
Figure 2
Protein-protein interaction network in FSCN1high compared to FSCN1low BRCA. Constructed protein-protein interaction network of 60 enriched genes in FSCN1high (n = 534) vs. FSCN1low (n = 545) breast cancer patients from TCGA dataset. Nodes represent proteins and different line intensities denote the type of evidence for the interaction. Statistical analysis results for the network: number of nodes: 59, number of edges: 28; average node degree: 0.94; average local clustering coefficient: 0.26; expected number of edges: 7; PPI enrichment p-value = 5.7–10.
Figure 3
Figure 3
Differential gene expression analysis on FSCN1KD compared to FSCN1CON MDA-MB-231 cells. (A) Left: FACS histograms showing the levels of fascin expression in FSCN1CON and FSCN1KD MDA-MB-231 cells. Right: Bar graph showing the relative RNA expression of fascin in FSCN1CON and FSCN1KD MDA-MB-231 cells. (B) Heatmap depicting the relative expression levels of differentially expressed genes in FSCN1KD compared to FSCN1CON MDA-MB-231 cells. Each column represents one replica, and each row represents a single transcript. The expression level of each transcript in a single sample is depicted according to the color scale. (C) Volcano plot representation of significantly altered genes in FSCN1KD compared to FSCN1CON MDA-MB-231 cells. Red and blue colors indicate the genes with significantly increased or decreased expression, respectively. Black color indicates no significant change. (D) Expression of top 10 upregulated and top 10 downregulated transcripts in FSCN1KD compared to FSCN1CON MDA-MB-231 cells based on microarray data (n = 3). ** p < 0.005, *** p < 0.0005.
Figure 4
Figure 4
Effect of the differentially identified genes in MDA-MB-231 breast cancer cells on survival of FSCN1high compared to FSCN1low breast cancer patients from TCGA dataset. Kaplan-Meier plots from TCGA dataset showing survival of (A,C) all breast cancer subtypes (RFS; n = 2032) or (B,D) TNBC subtype (RFS; n = 442). Survival of FSCN1high in conjunction with (A,B) high expression of the top 10 upregulated genes or (C,D) low expression of the top 10 downregulated genes identified in FSCN1CON MDA-MB-231 cells. The significance between FSCN1high and FSCN1low groups was calculated using the log-rank test. p-values are indicated on each plot.
Figure 5
Figure 5
Effector analysis of differentially regulated gene transcripts in FSCN1KD MDA-MB-231 breast cancer cells. (A) Tree map (hierarchical heat map) depicting affected functional categories based on differentially expressed genes in FSCN1KD compared to FSCN1CON MDA-MB-231 cells where the major boxes represent a category of diseases and functions. Each colored rectangle is a particular biological function or disease and the color range indicates its predicted activation state—increasing (orange) or decreasing (blue). Darker colors indicate higher absolute Z-scores. In this default view, the size of the rectangles is correlated with increasing overlap significance. Live cell assays showing migration (B), invasion (C), proliferation (D) and adhesion to collagen IV (E) in FSCN1KD compared to FSCN1CON MDA-MB-231 cells. Results in B-E are the mean of triplicates ± SD and are representative of three independent experiments. Upstream regulator analysis depicted activated GLI1, CBX5 and TRIB3 (F) and suppressed EZH2 and ATF4 (G) networks based on IPA analysis of data in Table S1.
Figure 5
Figure 5
Effector analysis of differentially regulated gene transcripts in FSCN1KD MDA-MB-231 breast cancer cells. (A) Tree map (hierarchical heat map) depicting affected functional categories based on differentially expressed genes in FSCN1KD compared to FSCN1CON MDA-MB-231 cells where the major boxes represent a category of diseases and functions. Each colored rectangle is a particular biological function or disease and the color range indicates its predicted activation state—increasing (orange) or decreasing (blue). Darker colors indicate higher absolute Z-scores. In this default view, the size of the rectangles is correlated with increasing overlap significance. Live cell assays showing migration (B), invasion (C), proliferation (D) and adhesion to collagen IV (E) in FSCN1KD compared to FSCN1CON MDA-MB-231 cells. Results in B-E are the mean of triplicates ± SD and are representative of three independent experiments. Upstream regulator analysis depicted activated GLI1, CBX5 and TRIB3 (F) and suppressed EZH2 and ATF4 (G) networks based on IPA analysis of data in Table S1.
Figure 6
Figure 6
Protein-protein interaction network and gene ontology (GO) enrichment. (A) Constructed protein-protein interaction network of 93 downregulated genes in FSCN1KD compared to FSCN1CON MDA-MB-231 cells. Nodes represent proteins and different line intensities denote the type of evidence for the interaction. Statistical analysis results for the network: number of nodes: 88, number of edges: 49; average node degree: 1.1; average local clustering coefficient: 0.44; expected number of edges: 31; PPI enrichment p-value =0.001. (B) GO enrichment bar chart of downregulated genes in FSCN1KD compared to FSCN1CON MDA-MB-231 cells showing most enriched GO terms.
Figure 7
Figure 7
Network Analysis illustrating the interactions between differentially expressed miRNAs and mRNAs in FSCN1KD MDA-MB-231 breast cancer cells. (A) Network illustrating the interaction between differentially expressed miRNAs and mRNAs in FSCN1KD MDA-MB-231 based on IPA microRNA target filter analysis. (B) Bar graph showing relative RNA expression of hsa-miR-145 in FSCN1KD compared to FSCN1CON MDA-MB-231 cells.

Similar articles

Cited by

References

    1. Balduzzi A., Bagnardi V., Rotmensz N., Dellapasqua S., Montagna E., Cardillo A., Viale G., Veronesi P., Intra M., Luini A., et al. Survival Outcomes in Breast Cancer Patients with Low Estrogen/Progesterone Receptor Expression. Clin. Breast Cancer. 2013;14:258–264. doi: 10.1016/j.clbc.2013.10.019. - DOI - PubMed
    1. Dellapasqua S., Bagnardi V., Balduzzi A., Iorfida M., Rotmensz N., Santillo B., Viale G., Ghisini R., Veronesi P., Luini A., et al. Outcomes of patients with breast cancer who present with ipsilateral supraclavicular or internal mammary lymph node metastases. Clin. Breast Cancer. 2014;14:53–60. doi: 10.1016/j.clbc.2013.09.008. - DOI - PubMed
    1. Wang Q., Xu M., Sun Y., Chen J., Chen C., Qian C., Chen Y., Cao L., Xu Q., Du X., et al. Gene Expression Profiling for Diagnosis of Triple-Negative Breast Cancer: A Multicenter, Retrospective Cohort Study. Front. Oncol. 2019;9:354. doi: 10.3389/fonc.2019.00354. - DOI - PMC - PubMed
    1. Hudis C.A., Gianni L. Triple-negative breast cancer: An unmet medical need. Oncologist. 2011;16((Suppl. 1)):1–11. doi: 10.1634/theoncologist.2011-S1-01. - DOI - PubMed
    1. Faix J., Grosse R. Staying in shape with formins. Dev. Cell. 2006;10:693–706. doi: 10.1016/j.devcel.2006.05.001. - DOI - PubMed

LinkOut - more resources