. 2021 Nov 26;13(12):4257.
doi: 10.3390/nu13124257.

Human Milk Oligosaccharides in Cord Blood Are Altered in Gestational Diabetes and Stimulate Feto-Placental Angiogenesis In Vitro

Affiliations

Human Milk Oligosaccharides in Cord Blood Are Altered in Gestational Diabetes and Stimulate Feto-Placental Angiogenesis In Vitro

Denise Hoch et al. Nutrients. .

Abstract

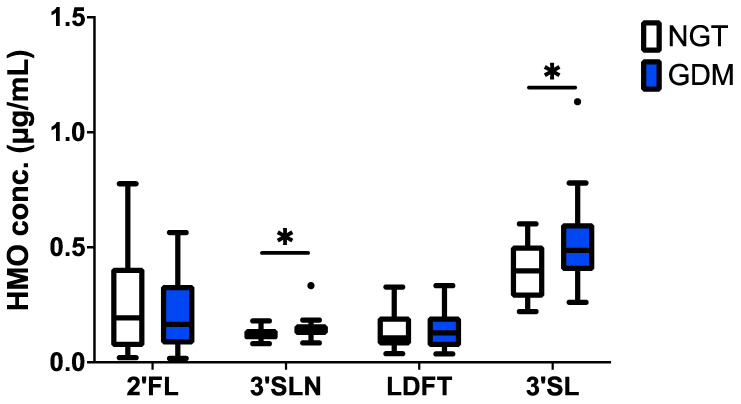
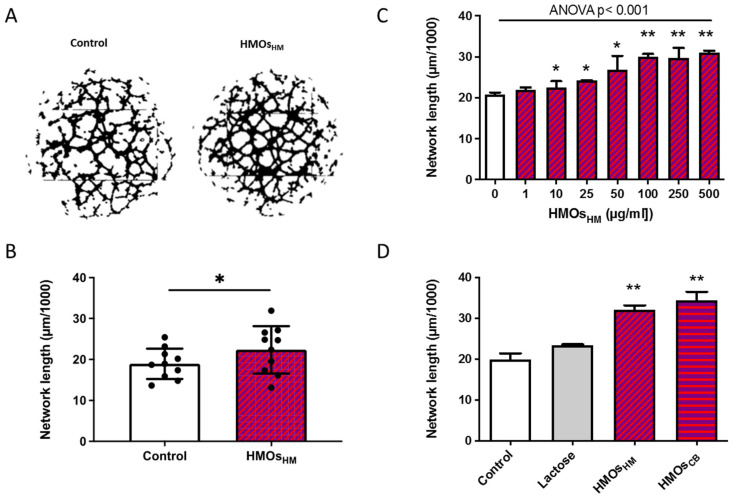
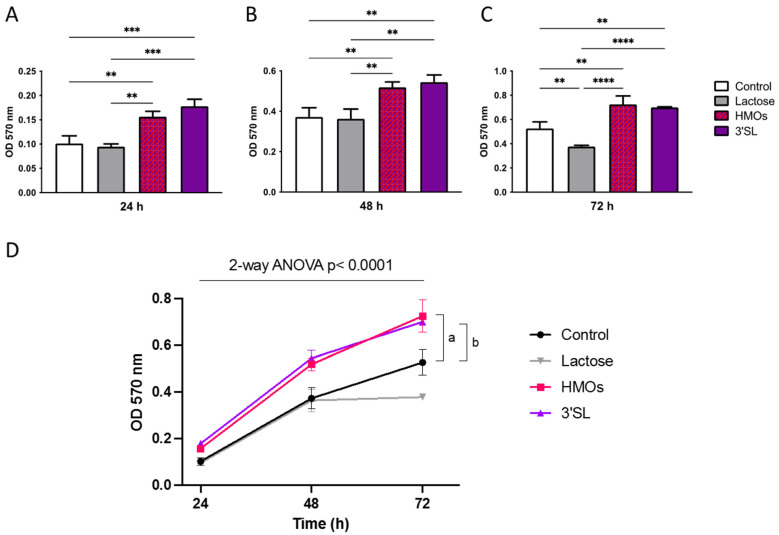
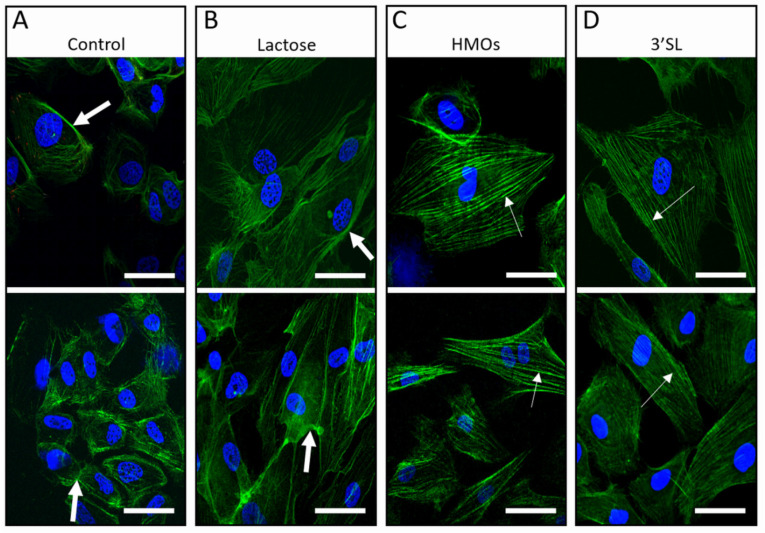
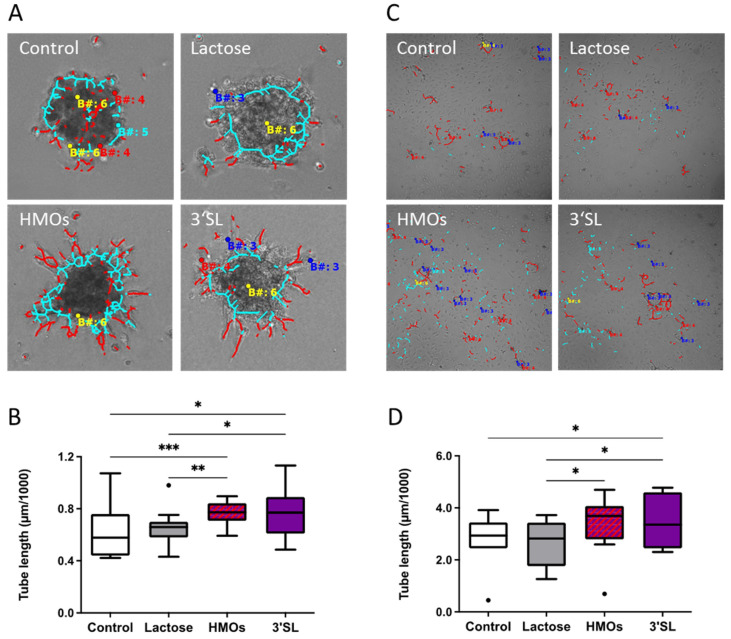
(1) Background: Human milk oligosaccharides (HMOs) are present in maternal serum during pregnancy and their composition is altered in gestational diabetes (GDM). HMOs are also in fetal cord blood and in contact with the feto-placental endothelium, potentially affecting its functions, such as angiogenesis. We hypothesized that cord blood HMOs are changed in GDM and contribute to increased feto-placental angiogenesis, hallmark of GDM. (2) Methods: Using HPLC, we quantified HMOs in cord blood of women with normal glucose tolerance (NGT, n = 25) or GDM (n = 26). We investigated in vitro angiogenesis using primary feto-placental endothelial cells (fpECs) from term placentas after healthy pregnancy (n = 10), in presence or absence of HMOs (100 µg/mL) isolated from human milk, 3'-sialyllactose (3'SL, 30 µg/mL) and lactose (glycan control) and determined network formation (Matrigel assay), proliferation (MTT assays), actin organization (F-actin staining), tube formation (fibrin tube formation assay) and sprouting (spheroid sprouting assay). (3) Results: 3'SL was higher in GDM cord blood. HMOs increased network formation, HMOs and 3'SL increased proliferation and F-actin staining. In fibrin assays, HMOs and 3'SL increased total tube length by 24% and 25% (p < 0.05), in spheroid assays, by 32% (p < 0.05) and 21% (p = 0.056), respectively. Lactose had no effect. (4) Conclusions: Our study suggests a novel role of HMOs in feto-placental angiogenesis and indicates a contribution of HMO composition to altered feto-placental vascularization in GDM.

Keywords: 3′-sialyllactose; angiogenesis; cord blood; fibrin tube formation assay; gestational diabetes mellitus; human milk oligosaccharides; placenta; pregnancy; spheroid sprouting assay; tube formation.


Conflict of interest statement

The authors declare no conflict of interest.

Figures

Figure 1
Figure 1
HMO concentrations in cord blood serum are different after GDM pregnancy. Tukey box-and-whiskers plot shows 2′-fucosyllactose (2′FL), 3′-siallylactosamine (3′SLN), lacto-difucotetraose (LDFT) and 3’-sialyllactose (3′SL) concentrations in cord blood from pregnancies with normal glucose tolerance (NGT, open boxes) and GDM (blue boxes). NGT control n = 25, GDM n = 26; significance was determined by the Mann–Whitney-U-test; * p < 0.05.
Figure 2
Figure 2
Human milk oligosaccharides (HMOs) dose-dependently increased network formation in primary fpECs. fpECs were pre-incubated for 24 h with EBM medium supplemented with 5% FCS with or without HMOs prior to use in a 2D network formation assay (Matrigel). (A) Representative images of network formation after 24 h treatment with (right) or without (left) pooled HMOsHM prior to use in a 2D network formation assay. (B) Bar plot shows total tube length at 12 h after seeding. A set of n = 10 fpEC isolations from healthy placentas was used, each in 2 to 3 independent experiments in technical triplicates (mean ± SD, n = 10, paired T-test). (C) fpECs were treated with serial concentrations (0–500 µg/mL) of pooled HMOsHM and incubated for 24 h showing a dose-dependent effect on 2D network formation. Two independent experiments were performed with two different fpEC isolations in triplicates (means ± SEM, ANOVA with multiple comparison). (D) Network formation was similarly increased when fpECs were incubated with HMOs isolated from pooled human milk (HMOsHM) as from pooled cord blood (HMOsCB red- purple vertically striped) and significantly different to no treatment and non-HMO control for 24 h. Two independent experiments were performed with two different fpEC isolations in triplicates; means ± SEM, paired t-test shows significance difference vs. control (white bar). * p < 0.05; ** p < 0.01. CB, cord blood; HM, human milk.
Figure 3
Figure 3
Human milk oligosaccharides (HMOs) increased proliferation of fpECs. The 5 × 10⁴ fpECs were resuspended in medium with and without HMOs, 3′SL or lactose, and seeded into wells of a 96-well-plate. MTT dye was added at the indicated time points, and fpECs were incubated for 4 h before the reaction was terminated. Cell viability was determined by measuring the optical density (OD) at 570 nm in an enzyme-linked-immunosorbent assay (ELISA) microplate reader after (A) 24, (B) 48 and (C) 72 h post seeding. Asterisks indicate significant differences between treatments; ** p < 0.01, *** p < 0.001 and **** p < 0.0001. (D) Time course of OD at the above shown individual time points (24, 48 and 72 h). Values shown are the mean ± SEM of three different fpEC isolations, each seeded in triplicates. Two-way ANOVA with two-stage Benjamini, Krieger and Yekutieli FDR procedure; the letter a indicates significant difference of HMOs vs. control; the letter b indicates significant difference of 3′SL vs. control.
Figure 4
Figure 4
Effect of HMOs on actin cytoskeleton organization of cultured fpECs. The 5 × 10⁴ cells per well were seeded on gelatin coated chamber slides. fpECs were cultured for 24 h in M199 medium containing 10% hPS and 10% nBCS followed by a treatment of 24 with M199 medium containing HMOs, 3′SL or lactose, or left untreated (two representative images each). (A) Control conditions (untreated cells) and (B) cells treated with lactose as non-HMO showed membrane ruffle formation (big white arrows) and weak phalloidin staining. Treatment with (C) HMOs (D) 3′SL led to parallel, highly ordered and strongly stained stress fibers (thin white arrows), similar to the positive pro-angiogenic control with TVF (TNF-α, VEGF and FGF-2) (not shown). There was no difference between the 24- and 48-h treatments. Similar results were obtained in five individual experiments with different fpEC isolations (n = 5). 3′SL, 3′-sialyllactose; scale bar = 50 µm.
Figure 5
Figure 5
HMOs stimulated in vitro angiogenesis of fpECs. A set of n = 10 individual fpEC isolations from healthy placentas were used for spheroid assays (A,B) and fibrin assays (C,D). (A,B) Spheroid assay showed significantly increased sprouting in the presence of HMOs (100 μg/mL) or 3′SL (30 μg/mL) as compared to untreated control. Lactose served as non-HMO control. (A) Representative image of spheroids analyzed with Cell-IQ analyzer software. Red lines are measuring the sprouts. (B) Box blots show median of tube length in the respective treatments. (C) Representative images of tubes analyzed with the Cell-IQ analyzer. The red dots and lines represent the tubes. (D) Fibrin assay showed a significant increase in total tube length upon treatment with HMOs (100 μg/mL) and 3′SL (30 μg/mL), compared to untreated cells and cells treated with lactose. Repeated measures ANOVA with uncorrected Fisher’s LSD; * p < 0.05; ** p < 0.01; *** p < 0.001; n = 10.

References

    1. Bode L., Jantscher-Krenn E. Structure-function relationships of human milk oligosaccharides. Adv. Nutr. 2012;3:383S–391S. doi: 10.3945/an.111.001404. - DOI - PMC - PubMed
    1. Stahl B., Thurl S., Henker J., Siegel M., Finke B., Sawatzki G. Detection of four human milk groups with respect to Lewis-blood-group-dependent oligosaccharides by serologic and chromatographic analysis. Adv. Exp. Med. Biol. 2001;501:299–306. - PubMed
    1. Mank M., Hauner H., Heck A.J.R., Stahl B. Targeted LC-ESI-MS(2) characterization of human milk oligosaccharide diversity at 6 to 16 weeks post-partum reveals clear staging effects and distinctive milk groups. Anal. Bioanal. Chem. 2020;412:6887–6907. doi: 10.1007/s00216-020-02819-x. - DOI - PMC - PubMed
    1. Kunz C., Meyer C., Collado M.C., Geiger L., Garcia-Mantrana I., Bertua-Rios B., Martinez-Costa C., Borsch C., Rudloff S. Influence of Gestational Age, Secretor, and Lewis Blood Group Status on the Oligosaccharide Content of Human Milk. J. Pediatr. Gastroenterol. Nutr. 2017;64:789–798. doi: 10.1097/MPG.0000000000001402. - DOI - PubMed
    1. McGuire M.K., Meehan C.L., McGuire M.A., Williams J.E., Foster J., Sellen D.W., Kamau-Mbuthia E.W., Kamundia E.W., Mbugua S., Moore S.E., et al. What’s normal? Oligosaccharide concentrations and profiles in milk produced by healthy women vary geographically. Am. J. Clin. Nutr. 2017;105:1086–1100. doi: 10.3945/ajcn.116.139980. - DOI - PMC - PubMed

LinkOut - more resources