

Evaluation of a Novel Artificial Intelligence System to Monitor and Assess Energy and Macronutrient Intake in Hospitalised Older Patients
- PMID: 34960091
- PMCID: PMC8706142
- DOI: 10.3390/nu13124539
Evaluation of a Novel Artificial Intelligence System to Monitor and Assess Energy and Macronutrient Intake in Hospitalised Older Patients
Abstract
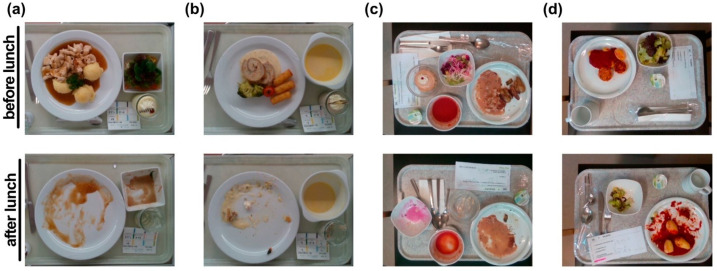
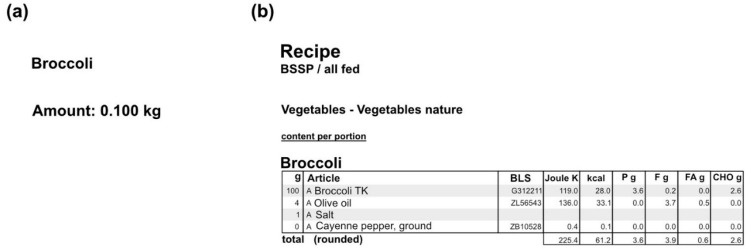
Malnutrition is common, especially among older, hospitalised patients, and is associated with higher mortality, longer hospitalisation stays, infections, and loss of muscle mass. It is therefore of utmost importance to employ a proper method for dietary assessment that can be used for the identification and management of malnourished hospitalised patients. In this study, we propose an automated Artificial Intelligence (AI)-based system that receives input images of the meals before and after their consumption and is able to estimate the patient's energy, carbohydrate, protein, fat, and fatty acids intake. The system jointly segments the images into the different food components and plate types, estimates the volume of each component before and after consumption, and calculates the energy and macronutrient intake for every meal, based on the kitchen's menu database. Data acquired from an acute geriatric hospital as well as from our previous study were used for the fine-tuning and evaluation of the system. The results from both our system and the hospital's standard procedure were compared to the estimations of experts. Agreement was better with the system, suggesting that it has the potential to replace standard clinical procedures with a positive impact on time spent directly with the patients.
Keywords: artificial intelligence; dietary assessment; dietary intake; geriatrics; malnutrition.
Conflict of interest statement
The authors declare no conflict of interest.
Figures


Similar articles
-
An Artificial Intelligence-Based System for Nutrient Intake Assessment of Hospitalised Patients.Annu Int Conf IEEE Eng Med Biol Soc. 2019 Jul;2019:5696-5699. doi: 10.1109/EMBC.2019.8856889. Annu Int Conf IEEE Eng Med Biol Soc. 2019. PMID: 31947145
-
Prescribed Hospital Diet Influence on Dietary Intake of Hospitalised Patients: A Cross-Sectional Study.Nutrients. 2025 Jan 12;17(2):261. doi: 10.3390/nu17020261. Nutrients. 2025. PMID: 39861391 Free PMC article.
-
Evaluation of a pilot volunteer feeding assistance program: influences on the dietary intakes of elderly hospitalised patients and lessons learnt.J Nutr Health Aging. 2015 Feb;19(2):206-10. doi: 10.1007/s12603-014-0529-x. J Nutr Health Aging. 2015. PMID: 25651447 Clinical Trial.
-
goFOODTM: An Artificial Intelligence System for Dietary Assessment.Sensors (Basel). 2020 Jul 31;20(15):4283. doi: 10.3390/s20154283. Sensors (Basel). 2020. PMID: 32752007 Free PMC article.
-
During Hospitalization, Older Patients at Risk for Malnutrition Consume <0.65 Grams of Protein per Kilogram Body Weight per Day.Nutr Clin Pract. 2020 Aug;35(4):655-663. doi: 10.1002/ncp.10542. Epub 2020 Jun 24. Nutr Clin Pract. 2020. PMID: 32578906 Free PMC article.
Cited by
-
A feasibility study to assess Mediterranean Diet adherence using an AI-powered system.Sci Rep. 2022 Oct 11;12(1):17008. doi: 10.1038/s41598-022-21421-y. Sci Rep. 2022. PMID: 36220998 Free PMC article.
-
Multimedia Data-Based Mobile Applications for Dietary Assessment.J Diabetes Sci Technol. 2023 Jul;17(4):1056-1065. doi: 10.1177/19322968221085026. Epub 2022 Mar 29. J Diabetes Sci Technol. 2023. PMID: 35348398 Free PMC article. Review.
-
The Role of Artificial Intelligence in Nutrition Research: A Scoping Review.Nutrients. 2024 Jun 28;16(13):2066. doi: 10.3390/nu16132066. Nutrients. 2024. PMID: 38999814 Free PMC article.
-
Malnutrition in Hospitalized Old Patients: Screening and Diagnosis, Clinical Outcomes, and Management.Nutrients. 2022 Feb 21;14(4):910. doi: 10.3390/nu14040910. Nutrients. 2022. PMID: 35215559 Free PMC article. Review.
-
Technology to Automatically Record Eating Behavior in Real Life: A Systematic Review.Sensors (Basel). 2023 Sep 8;23(18):7757. doi: 10.3390/s23187757. Sensors (Basel). 2023. PMID: 37765812 Free PMC article.
References
-
- Imoberdorf R., Rühlin M., Beerli A., Ballmer P.E. Mangelernährung Unterernährung. Swiss Med. Forum. 2011;11:782–786. doi: 10.4414/smf.2011.07663. - DOI
-
- Imoberdorf R., Rühlin M., Ballmer P.E. Unterernährung im Krankenhaus-Häufigkeit, Auswirkungen und Erfassungsmöglichkeiten. Klinikarzt. 2004;33:342–345. doi: 10.1055/s-2004-861883. - DOI
MeSH terms
LinkOut - more resources
Full Text Sources
