. 2021 Dec 3;9(12):1425.
doi: 10.3390/vaccines9121425.

Evaluation of Recombinant Herpesvirus of Turkey Laryngotracheitis (rHVT-LT) Vaccine against Genotype VI Canadian Wild-Type Infectious Laryngotracheitis Virus (ILTV) Infection

Affiliations

Evaluation of Recombinant Herpesvirus of Turkey Laryngotracheitis (rHVT-LT) Vaccine against Genotype VI Canadian Wild-Type Infectious Laryngotracheitis Virus (ILTV) Infection

Catalina Barboza-Solis et al. Vaccines (Basel). .

Abstract

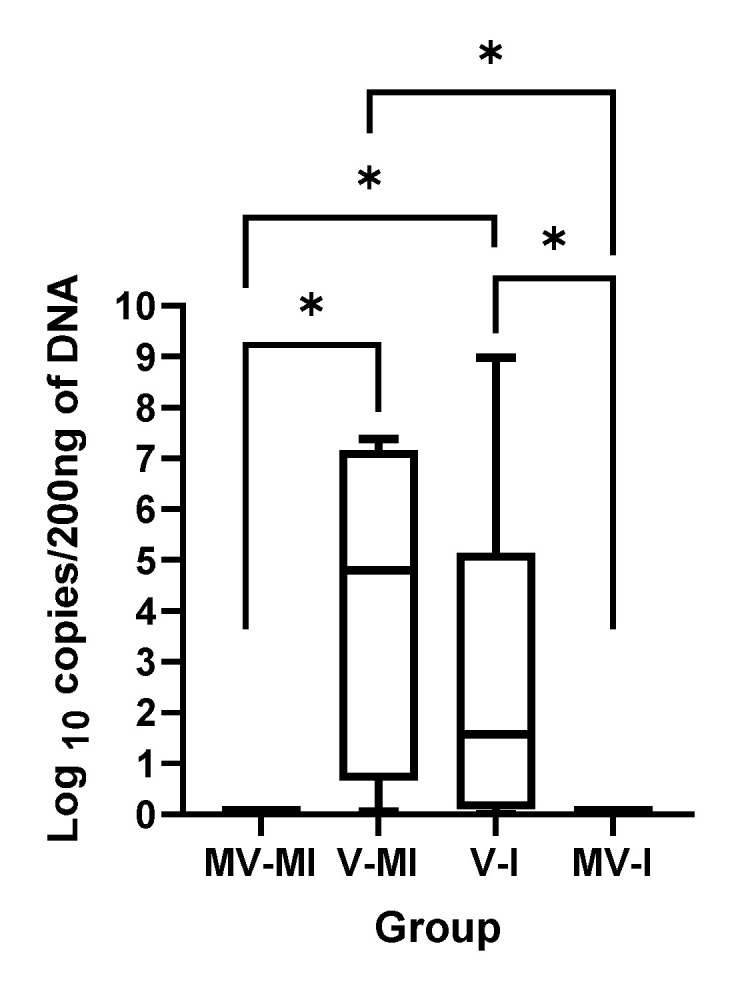
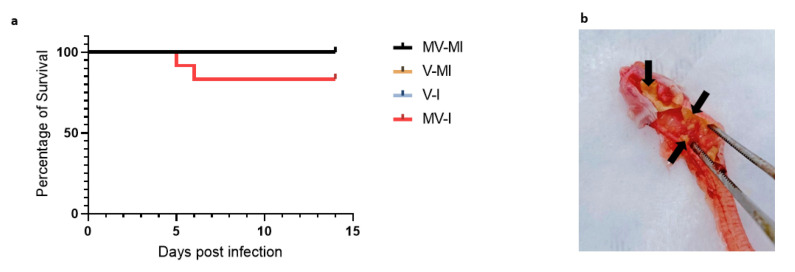
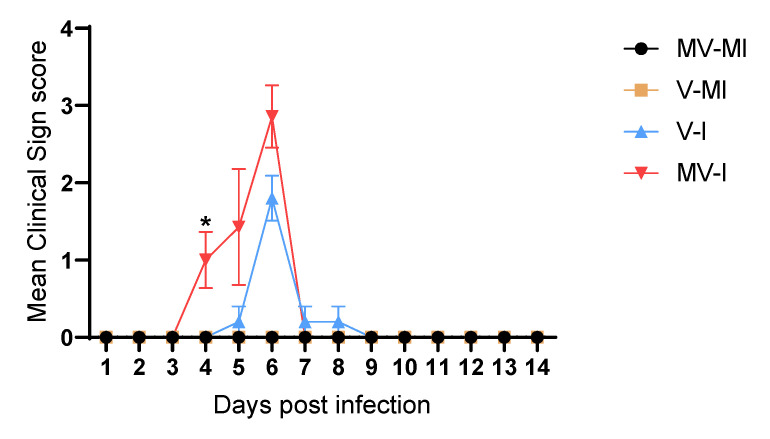
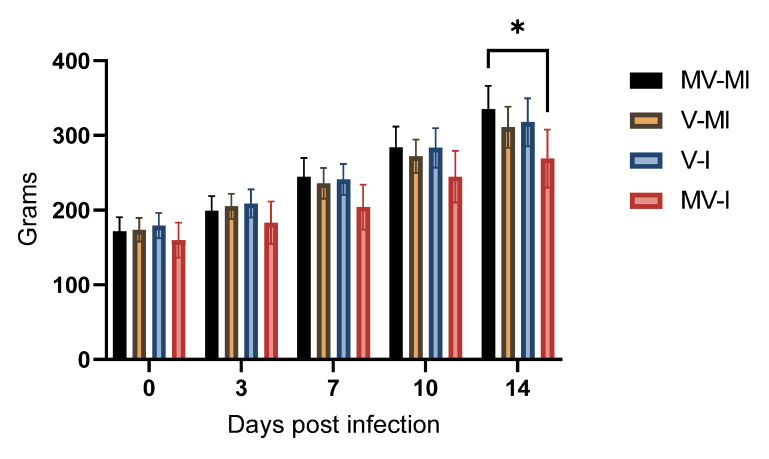
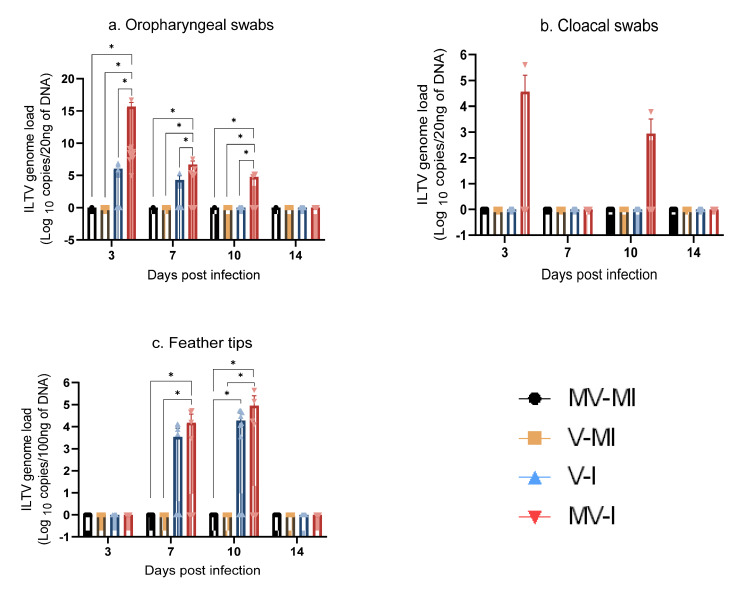
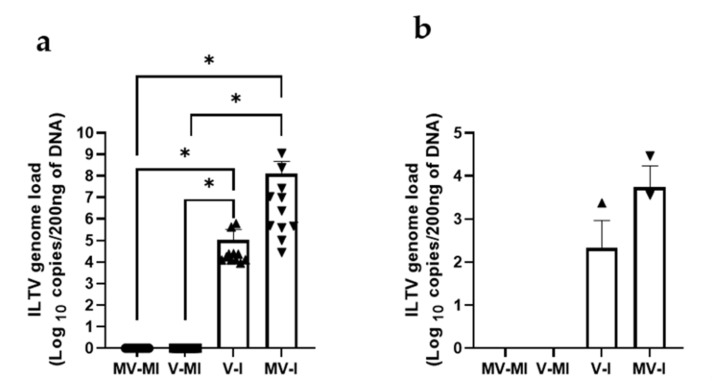
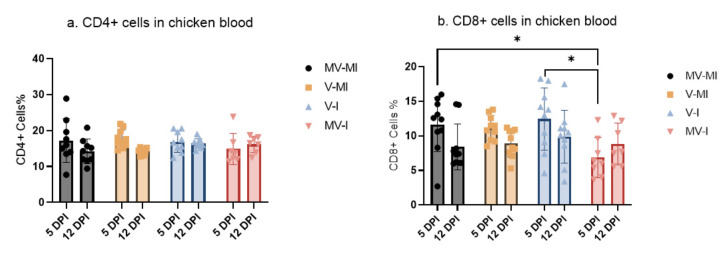
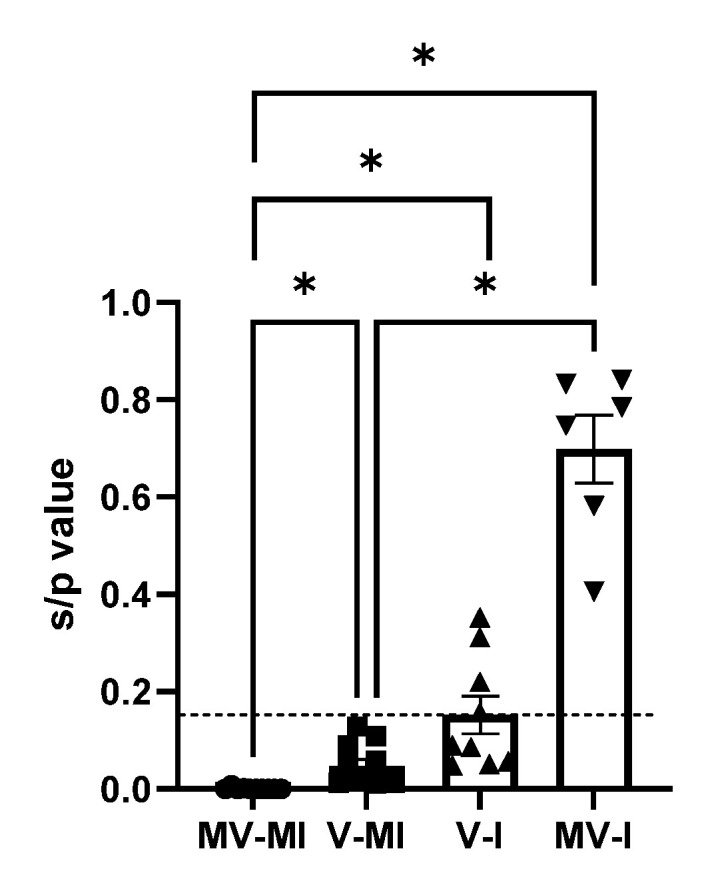
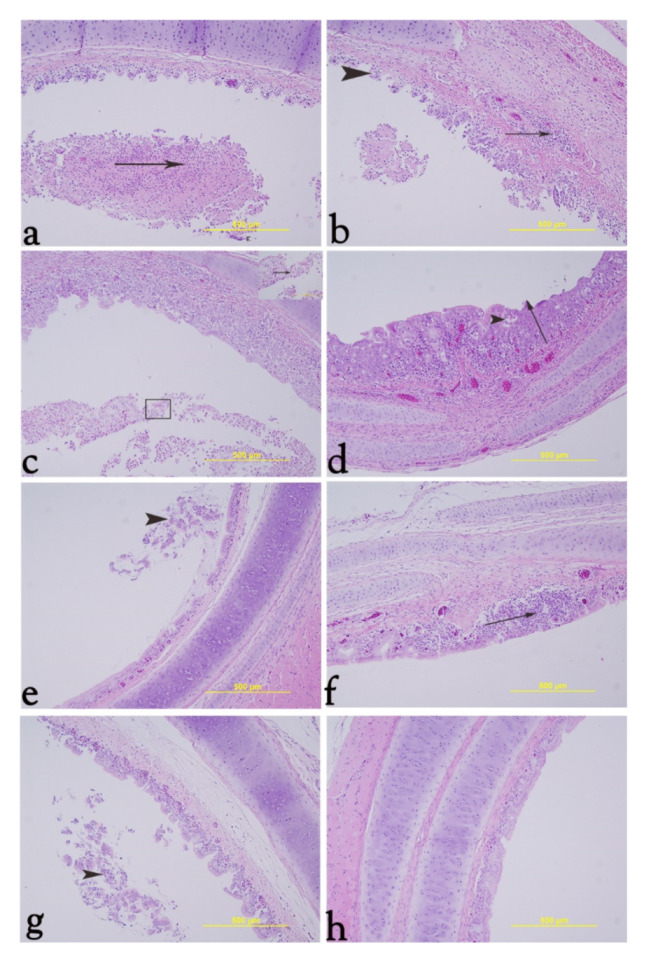
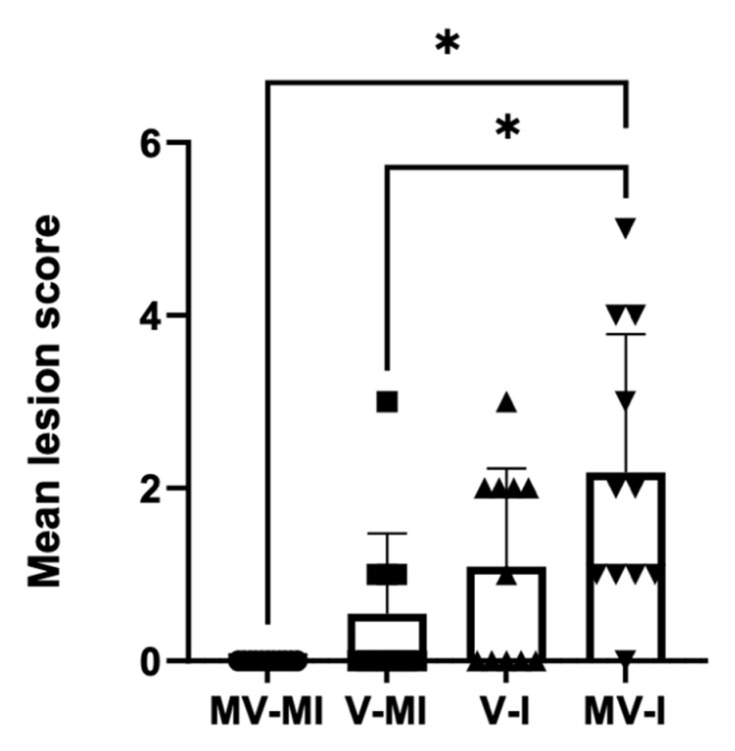
In Alberta, infectious laryngotracheitis virus (ILTV) infection is endemic in backyard poultry flocks; however, outbreaks are only sporadically observed in commercial flocks. In addition to ILTV vaccine revertant strains, wild-type strains are among the most common causes of infectious laryngotracheitis (ILT). Given the surge in live attenuated vaccine-related outbreaks, the goal of this study was to assess the efficacy of a recombinant herpesvirus of turkey (rHVT-LT) vaccine against a genotype VI Canadian wild-type ILTV infection. One-day-old specific pathogen-free (SPF) White Leghorn chickens were vaccinated with the rHVT-LT vaccine or mock vaccinated. At three weeks of age, half of the vaccinated and the mock-vaccinated animals were challenged. Throughout the experiment, weights were recorded, and feather tips, cloacal and oropharyngeal swabs were collected for ILTV genome quantification. Blood was collected to isolate peripheral blood mononuclear cells (PBMC) and quantify CD4+ and CD8+ T cells. At 14 dpi, the chickens were euthanized, and respiratory tissues were collected to quantify genome loads and histological examination. Results showed that the vaccine failed to decrease the clinical signs at 6 days post-infection. However, it was able to significantly reduce ILTV shedding through the oropharyngeal route. Overall, rHVT-LT produced a partial protection against genotype VI ILTV infection.

Keywords: chicken; immune response; infectious laryngotracheitis virus; rHVT-LT recombinant vaccine.


Conflict of interest statement

The authors declare no conflict of interest.

Figures

Figure 1
Figure 1
rHVT-LT genome load in spleen at 5 weeks post-vaccination (14 dpi) as an indicator of rHVT-LT vaccine successful application. The rHVT-LT genome loads targeting the gB gene of the HVT were quantified using the qPCR technique. The Kruskal–Wallis test followed by Dunn’s multiple comparison test was used to compare group differences. * = p < 0.05.
Figure 2
Figure 2
Percentage of survival (a) Percentages of remaining chicken following euthanasia of chickens reaching humane end point. Log rank (Mantel–Cox) test and Gehan–Breslow–Wilcoxon test were performed to identify group differences. (b) Post-mortem examination of trachea of a chicken euthanized at 6 dpi with fibrinous exudate in trachea (black arrows).
Figure 3
Figure 3
The observed mean clinical scores during experimental period. The mean clinical scores are given, and the error bars represent the standard error of means (SEM). Kruskal–Wallis test followed by Dunn’s multiple comparison test was performed to compare mean clinical scores of groups. * = p < 0.05.
Figure 4
Figure 4
Bodyweight gains of experimental chickens at 0, 3, 7, 10 and 14 days post-infection (dpi). Data are presented as mean, and the error bars represent the standard error of means (SEM). Kruskal–Wallis test followed by Dunn’s multiple comparison test was used to identify group differences. * = p < 0.05.
Figure 5
Figure 5
ILTV genome loads quantified targeting the PK gene at 3, 7, 10 and 14 days post-infection (dpi). The bars represent the mean, and error bars indicate the standard error of mean (SEM). Kruskal–Wallis test followed by Dunn’s multiple comparison test was used to identify group differences. (a) ILTV genome loads in oropharyngeal swabs; (b) ILTV genome loads in cloacal swabs; (c) ILTV genome loads in feather tips. * = p < 0.05.
Figure 6
Figure 6
ILTV genome loads in trachea (a) and lungs (b) at 14 dpi. The quantification of ILTV genome loads was performed targeting the ILTV PK gene using qPCR assay. Mean genome load is plotted in log10 scale and represented in bars with standard error of means (SEM). Kruskal–Wallis test followed by Dunn’s multiple comparison test was performed to identify group differences. * = p < 0.05.
Figure 7
Figure 7
Percentage of (a) CD4+ and (b) CD8+ T cells in peripheral blood mononuclear cells (PBMCs) at 5 and 12 dpi. Mean percentage of CD4+ and CD8+ T cells is given, and error bars represent the standard error of means (SEM). Kruskal–Wallis test was performed followed by Dunn’s multiple comparison test to identify the group differences. * = p < 0.05.
Figure 8
Figure 8
Serum sample to positive value (s/p) at 14 dpi. The bars represent mean; the geometric figures, the individual values; and the error bars, the standard error of mean (SEM). The horizontal discontinuous line represents the cut-off value of negative to positive serological diagnostic results, corresponding to 0.15. Kruskal–Wallis test followed by Dunn’s multiple comparison test was used to compare the group differences. * = p < 0.05.
Figure 9
Figure 9
Representative histology images of trachea at 14 dpi and quantitative tracheal histological score. (a): Black arrow represents fibrinohemorrhagic membrane containing cellular exudates. (b): Black arrow represents mononuclear cell infiltration and hyperemia; head arrow indicates projection of the underlying connective tissue into the lumen. (c): Eosinophilic intranuclear viral inclusion inside sloughed epithelial cells around heterophilic infiltrates (inset). (d): Vacuolar spaces containing cellular debris and mononuclear cell infiltration with hyperemia in l. propria (head arrow); the epithelium lining exhibited squamous metaplasia (black arrow). (e): Black head arrow represents cuffs of sloughed epithelial cells in the tracheal lumen. (f): Black arrow represents mononuclear cell infiltration, hyperemia and edema. (g): Black head arrow represents intraluminal sloughed epithelial cells. (h): Normal trachea without pathological lesion.
Figure 10
Figure 10
The mean lesion scores are given, and the error bars represent the standard error of means (SEM). Kruskal–Wallis test followed by Dunn’s multiple comparison test was performed to compare mean clinical scores of groups. * = p < 0.05.

References

    1. La T.-M., Choi E.-J., Lee J.-B., Park S.-Y., Song C.-S., Choi I.-S., Lee S.-W. Comparative genome analysis of Korean field strains of infectious laryngotracheitis virus. PLoS ONE. 2019;14:e0211158. doi: 10.1371/journal.pone.0211158. - DOI - PMC - PubMed
    1. Cover M.S. The Early History of Infectious Laryngotracheitis. Avian Dis. 1996;40:494–500. doi: 10.2307/1592256. - DOI - PubMed
    1. Cruickshank J.G., Berry D.M., Hay B. The fine structure of infectious laryngotracheitis virus. Virology. 1963;20:376–378. doi: 10.1016/0042-6822(63)90129-6. - DOI - PubMed
    1. Winterfield R.W., So I.G. Susceptibility of turkeys to infectious laryngotracheitis. Avian Dis. 1968;12:191–202. doi: 10.2307/1588100. - DOI - PubMed
    1. Seddon H.R., Hart L. Infectivity Experiments With the Virus of Laryngotracheitis of Fowls*. Aust. Vet. J. 1936;12:13–16. doi: 10.1111/j.1751-0813.1936.tb01095.x. - DOI