

An Automatic Gait Analysis Pipeline for Wearable Sensors: A Pilot Study in Parkinson's Disease
- PMID: 34960379
- PMCID: PMC8707484
- DOI: 10.3390/s21248286
An Automatic Gait Analysis Pipeline for Wearable Sensors: A Pilot Study in Parkinson's Disease
Abstract
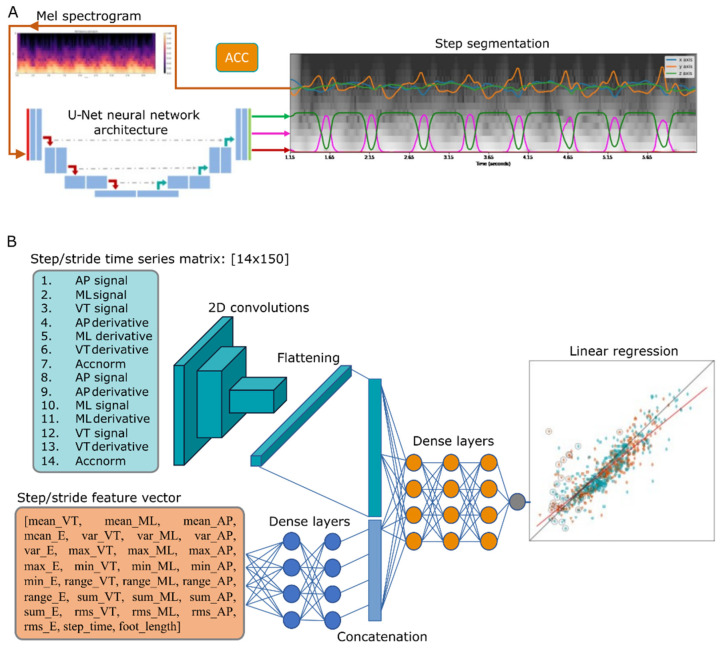
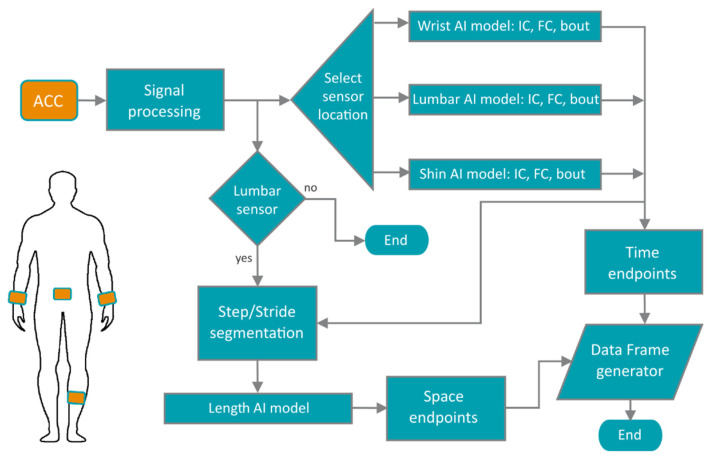
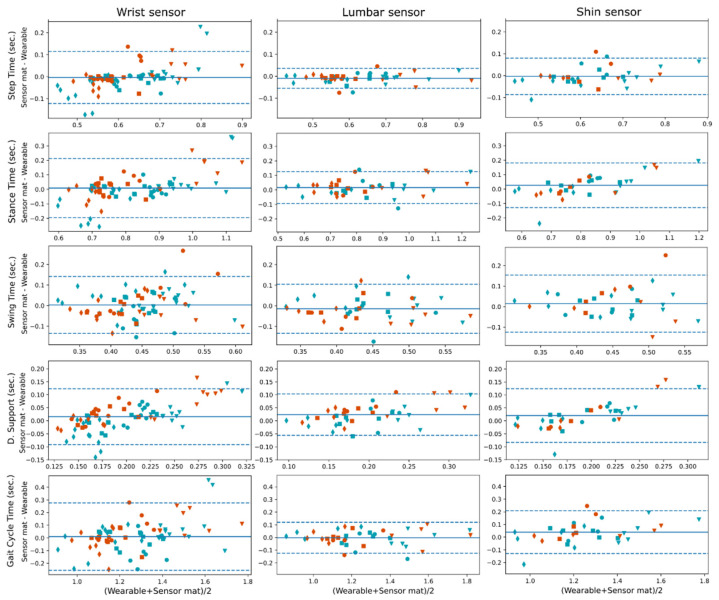
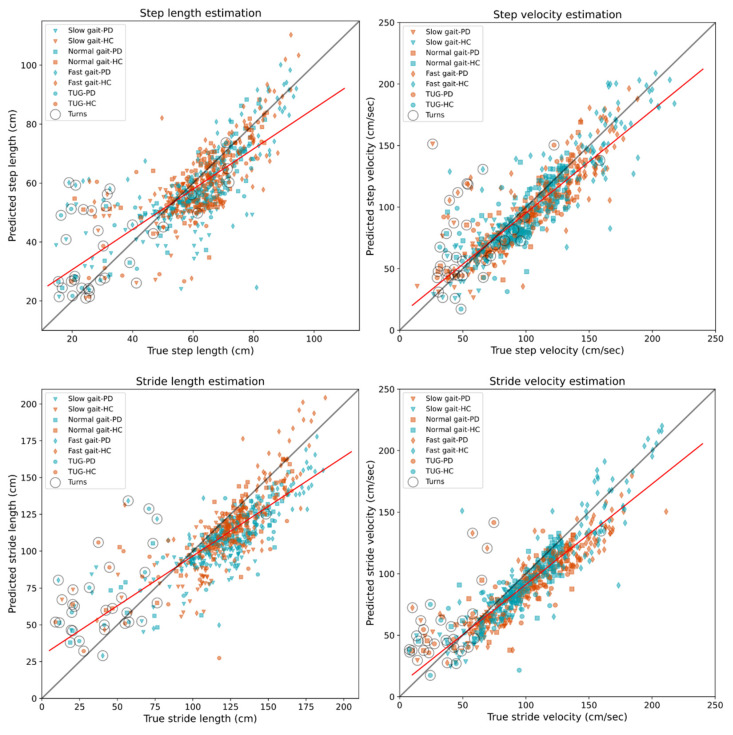
The use of wearable sensors allows continuous recordings of physical activity from participants in free-living or at-home clinical studies. The large amount of data collected demands automatic analysis pipelines to extract gait parameters that can be used as clinical endpoints. We introduce a deep learning-based automatic pipeline for wearables that processes tri-axial accelerometry data and extracts gait events-bout segmentation, initial contact (IC), and final contact (FC)-from a single sensor located at either the lower back (near L5), shin or wrist. The gait events detected are posteriorly used for gait parameter estimation, such as step time, length, and symmetry. We report results from a leave-one-subject-out (LOSO) validation on a pilot study dataset of five participants clinically diagnosed with Parkinson's disease (PD) and six healthy controls (HC). Participants wore sensors at three body locations and walked on a pressure-sensing walkway to obtain reference gait data. Mean absolute errors (MAE) for the IC events ranged from 22.82 to 33.09 milliseconds (msecs) for the lower back sensor while for the shin and wrist sensors, MAE ranges were 28.56-64.66 and 40.19-72.50 msecs, respectively. For the FC-event detection, MAE ranges were 29.06-48.42, 40.19-72.70 and 36.06-60.18 msecs for the lumbar, wrist and shin sensors, respectively. Intraclass correlation coefficients, ICC(2,k), between the estimated parameters and the reference data resulted in good-to-excellent agreement (ICC ≥ 0.84) for the lumbar and shin sensors, excluding the double support time (ICC = 0.37 lumbar and 0.38 shin) and swing time (ICC = 0.55 lumbar and 0.59 shin). The wrist sensor also showed good agreements, but the ICCs were lower overall than for the other two sensors. Our proposed analysis pipeline has the potential to extract up to 100 gait-related parameters, and we expect our contribution will further support developments in the fields of wearable sensors, digital health, and remote monitoring in clinical trials.
Keywords: accelerometry; deep learning; free living; initial contact; step length; toe-off.
Conflict of interest statement
The authors declare no conflict of interest.
Figures
References
-
- Robles-García V., Corral-Bergantiños Y., Espinosa N., Jácome M.A., García-Sancho C., Cudeiro J., Arias P. Spatiotemporal Gait Patterns During Overt and Covert Evaluation in Patients With Parkinson´s Disease and Healthy Subjects: Is There a Hawthorne Effect? J. Appl. Biomech. 2015;31:189–194. doi: 10.1123/jab.2013-0319. - DOI - PubMed
MeSH terms
Grants and funding
LinkOut - more resources
Full Text Sources
Medical
