

Comparison of Cheese Aroma Intensity Measured Using an Electronic Nose (E-Nose) Non-Destructively with the Aroma Intensity Scores of a Sensory Evaluation: A Pilot Study
- PMID: 34960458
- PMCID: PMC8709232
- DOI: 10.3390/s21248368
Comparison of Cheese Aroma Intensity Measured Using an Electronic Nose (E-Nose) Non-Destructively with the Aroma Intensity Scores of a Sensory Evaluation: A Pilot Study
Abstract
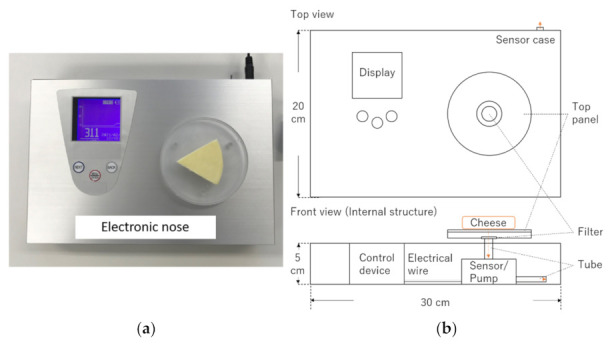
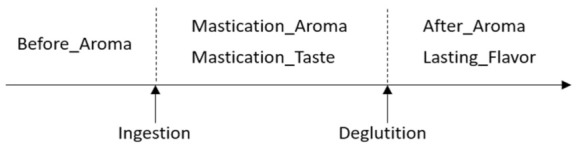
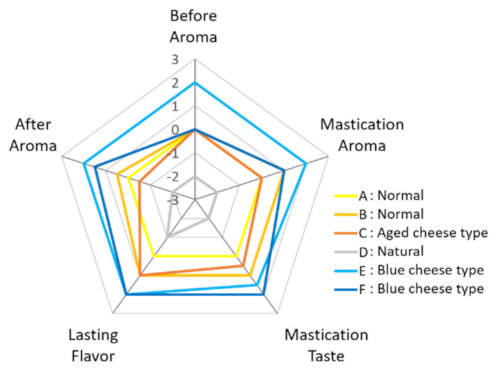
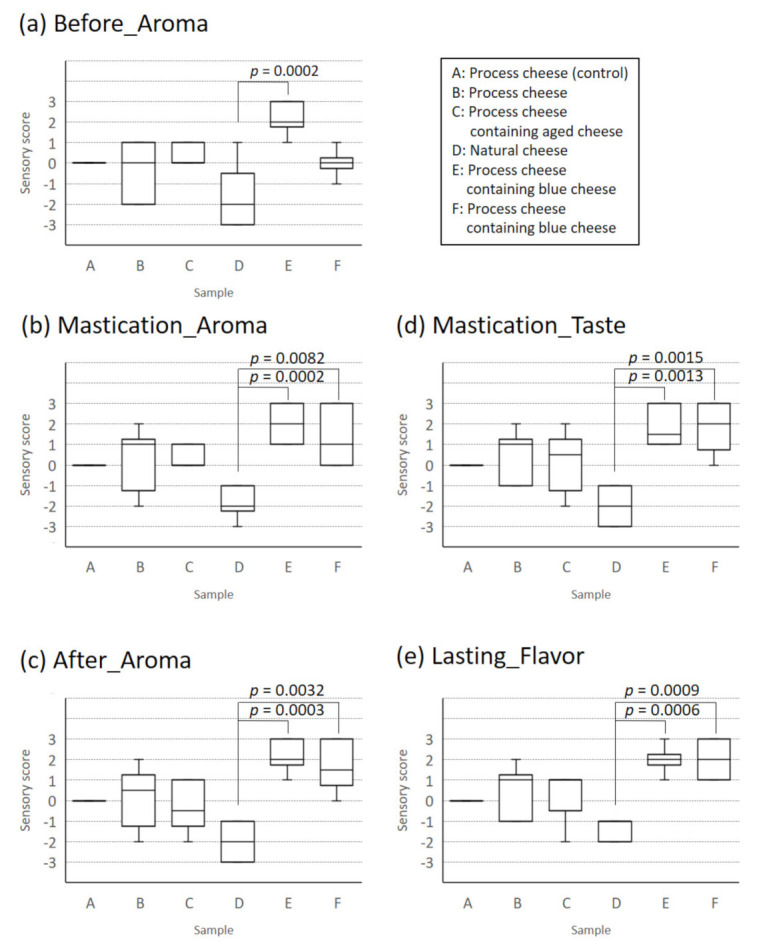
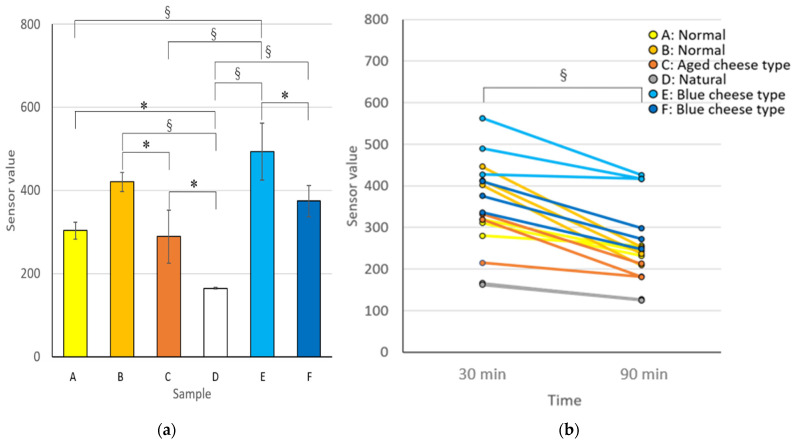
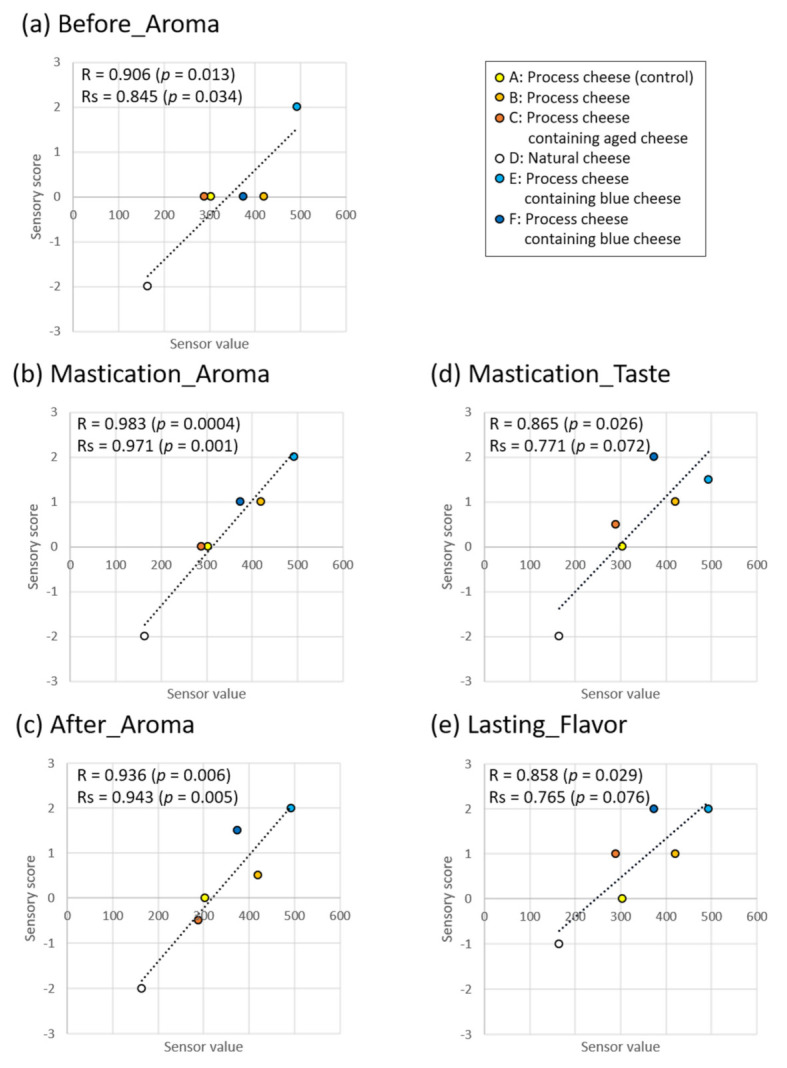
Cheese aroma is known to affect consumer preference. One of the methods to measure cheese aroma is the use of an electronic nose (e-nose), which has been used to classify cheese types, production areas, and cheese ages. However, few studies have directly compared the aroma intensity scores derived from sensory evaluations with the values of metal oxide semiconductor sensors that can easily measure the aroma intensity. This pilot study aimed to investigate the relationship between sensory evaluation scores and e-nose values with respect to cheese aroma. Five types of processed cheese (two types of normal processed cheese, one type containing aged cheese, and two types containing blue cheese), and one type of natural cheese were used as samples. The sensor values obtained using the electronic nose, which measured sample aroma non-destructively, and five sensory evaluation scores related to aroma (aroma intensity before intake, during mastication, and after swallowing; taste intensity during mastication; and remaining flavor after swallowing (lasting flavor)) determined by six panelists, were compared. The e-nose values of many of the tested cheese types were significantly different, whereas the sensory scores of the one or two types of processed cheese containing blue cheese and those of the natural cheese were significantly different. Significant correlations were observed between the means of e-nose values and the medians of aroma intensity scores derived from the sensory evaluation testing before intake, during mastication, and after swallowing. In particular, the aroma intensity score during mastication was found to have a linear relationship with the e-nose values (Pearson's R = 0.983). In conclusion, the e-nose values correlated with the sensory scores with respect to cheese aroma intensity and could be helpful in predicting them.
Keywords: aroma; cheese; electronic nose (e-nose); non-destruction; sensory evaluation.
Conflict of interest statement
The author is the inventor of the pending patent in Japan related to the e-nose system used in this study (Application No. 2020-192259).
Figures
References
-
- Japan Dairy Association Dairy Industry Information. [(accessed on 14 October 2021)]. Available online: https://www.j-milk.jp/gyokai/database.
-
- Ministry of Agriculture, Forestry and Fisheries Demand and Supply for Cheese. [(accessed on 14 October 2021)]; Available online: https://www.maff.go.jp/j/tokei/kouhyou/cheese_zyukyu/
-
- Morita A., Araki T., Ikegami S., Okaue M., Sumi M., Ueda R., Sagara Y. Coupled Stepwise PLS-VIP and ANN Modeling for Identifying and Ranking Aroma Components Contributing to the Palatability of Cheddar Cheese. Food Sci. Technol. Res. 2015;21:175–186. doi: 10.3136/fstr.21.175. - DOI
-
- Arai I., Tamaki T., Kaizu Y. Recent tendencies in consumer preferences as to their sensory evaluation of several kinds of cheeses. Res. Rep. Niigata Seiryo Univ. Jr. Coll. 2010;40:27–35.
-
- Curioni P.M.G., Bosset J.O. Key odorants in various cheese types as determined by gas chromatography-olfactometry. Int. Dairy J. 2002;12:959–984. doi: 10.1016/S0958-6946(02)00124-3. - DOI
MeSH terms
LinkOut - more resources
Full Text Sources
