Observational Study
. 2021 Dec 7;13(12):2456.
doi: 10.3390/v13122456.

Plasma Proteome Fingerprints Reveal Distinctiveness and Clinical Outcome of SARS-CoV-2 Infection

Affiliations
Observational Study

Plasma Proteome Fingerprints Reveal Distinctiveness and Clinical Outcome of SARS-CoV-2 Infection

Wolfgang Bauer et al. Viruses. .

Abstract

Background: We evaluated how plasma proteomic signatures in patients with suspected COVID-19 can unravel the pathophysiology, and determine kinetics and clinical outcome of the infection.

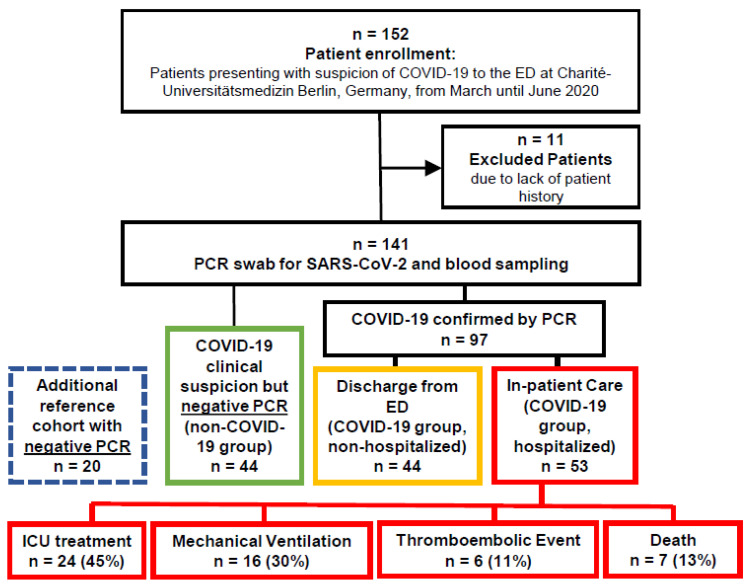
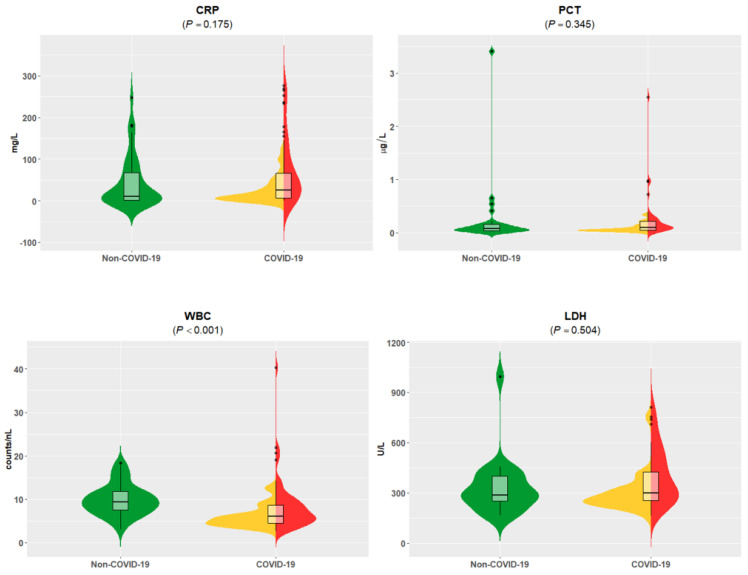
Methods: Plasma samples from patients presenting to the emergency department (ED) with symptoms of COVID-19 were stratified into: (1) patients with suspected COVID-19 that was not confirmed (n = 44); (2) non-hospitalized patients with confirmed COVID-19 (n = 44); (3) hospitalized patients with confirmed COVID-19 (n = 53) with variable outcome; and (4) patients presenting to the ED with minor diseases unrelated to SARS-CoV-2 infection (n = 20). Besides standard of care diagnostics, 177 circulating proteins related to inflammation and cardiovascular disease were analyzed using proximity extension assay (PEA, Olink) technology.

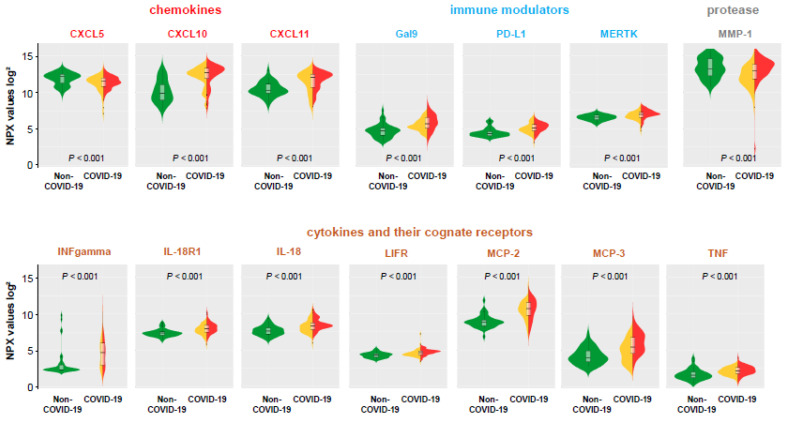
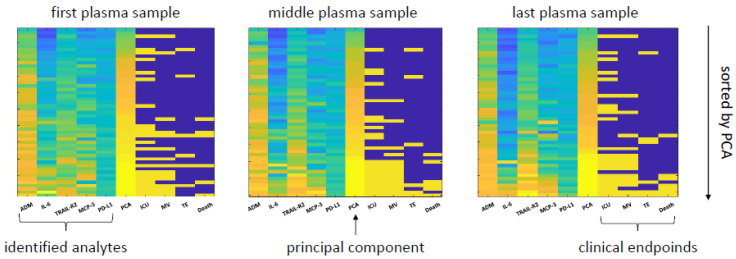
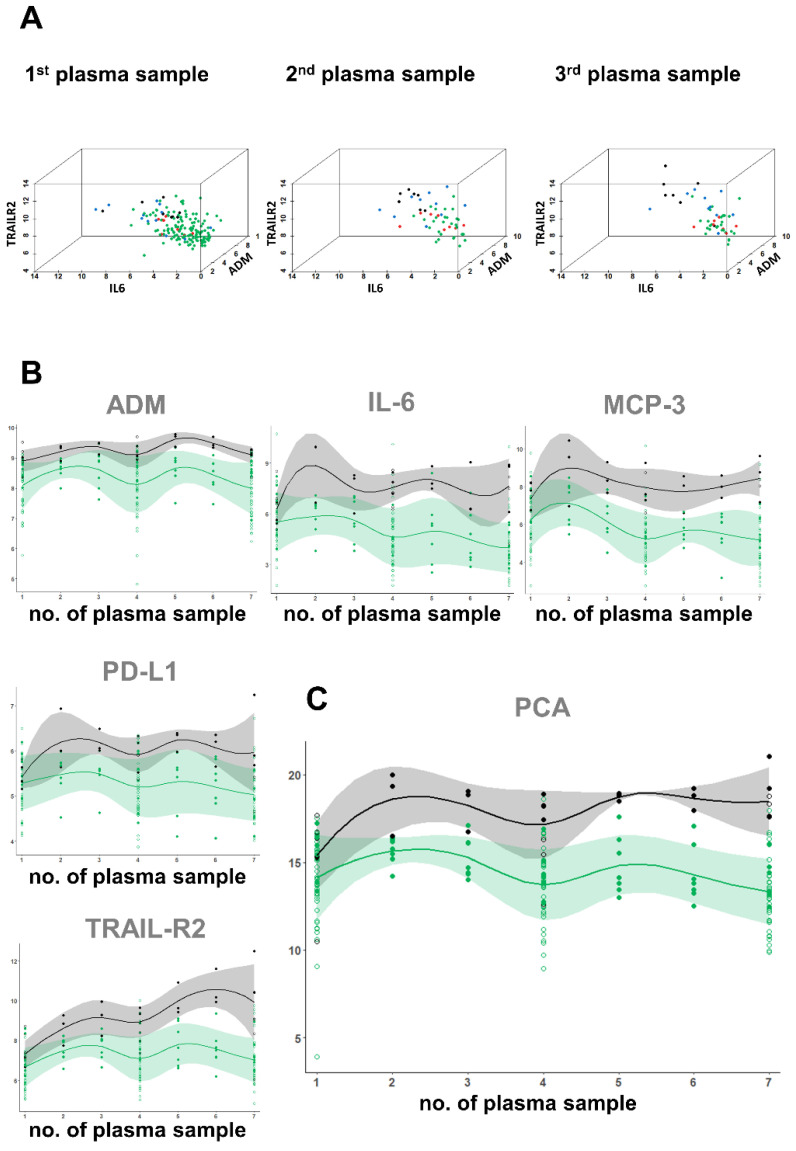
Results: Comparative proteome analysis revealed 14 distinct proteins as highly associated with SARS-CoV-2 infection and 12 proteins with subsequent hospitalization (p < 0.001). ADM, IL-6, MCP-3, TRAIL-R2, and PD-L1 were each predictive for death (AUROC curve 0.80-0.87). The consistent increase of these markers, from hospital admission to intensive care and fatality, supported the concept that these proteins are of major clinical relevance.

Conclusions: We identified distinct plasma proteins linked to the presence and course of COVID-19. These plasma proteomic findings may translate to a protein fingerprint, helping to assist clinical management decisions.

Keywords: COVID-19; emergency medicine; proteomics; proximity extension assay; risk prediction.


Conflict of interest statement

The authors have no conflict of interest to declare.

Figures

Figure 1
Figure 1
Study outline.
Figure 2
Figure 2
Standard of care parameter-values of C-reactive protein (CRP), procalcitonin (PCT), white blood cell (WBC) counts, and lactate dehydrogenase (LDH) of combined groups without COVID-19 were compared to COVID-19 hospitalized and non-hospitalized patients. Data are visualized by violin plots, which are a combination of kernel density plots, and box plots depicting median, 25th, and 75th percentiles. No significant differences were detectable for CRP, PCT, and LDH. Units are as follows: CRP (mg/L), PCT (µg/L), WBC (cells/nL), LDH (U/L). Significantly lower WBC levels were found in patients with confirmed SARS-CoV-2 infection compared to non-COVID-19 patients (p < 0.001). Green = non-COVID-19; yellow = COVID-19 without hospitalization; red = COVID-19 with hospitalization; black dots: outliers.
Figure 3
Figure 3
Proteome analyses—PEA values of discriminatory analytes with significant differences (p < 0.001) between non-COVID-19 and COVID-19 patients. Data are visualized by violin plots, which are a combination of kernel density plots, and box plots depicting median, 25th, and 75th percentiles. A high-normalized protein expression (NPX) value resembles a high protein concentration and expresses the relative quantification between samples. NPX values are given on a log-scale. Green = non-COVID-19; yellow = COVID-19 without hospitalization; red = COVID-19 with hospitalization; black dots: outliers.
Figure 4
Figure 4
Proteome analyses—PEA values of discriminatory analytes within COVID-19 group, either non-hospitalized (outpatients) or hospitalized (inpatients). Data are visualized by violin plots, which are a combination of kernel density plots, and box plots depicting median, 25th and 75th percentiles. A high-normalized protein expression (NPX) value resembles a high protein concentration and expresses the relative quantification between samples. NPX values are given on a log-scale. Yellow = COVID-19 without hospitalization; red = COVID-19 with hospitalization; black dots: outliers.
Figure 5
Figure 5
Heat map of predictive performance—the heat map presents the relative values of the five selected analytes (ADM, IL-6, MCP-3, TRAIL-R2, PD-L1) and the corresponding principal component analyses (PCA, as a combination of these markers) in relation to four clinical events (ICU treatment, TE, MV, and death). The first heat map (left) presents values based on plasma taken initially in the ED. The middle heat map presents values from the plasma sample at the middle of the hospital stay, and the last heat map plasma sample from the latest time point (either prior to discharge of the patient or before fatal outcome). The samples are sorted according to the value of PCA.
Figure 6
Figure 6
Illustration of predictive protein values and kinetics as well biological variation of proteins during hospital stay—(A) three-dimensional illustration of predictive protein values. Green dots: non-hospitalized COVID-19; red dots: hospitalized COVID-19 with ICU admission; blue dots: hospitalized COVID-19 with ICU admission and requirement for mechanical ventilation; Black dots: COVID-19 with fatal outcome. (B) Kinetics of the five selected markers separately (ADM, IL-6, MCP-3, PD-L1, TRAIL-R2) and (C) the PCA based on the combination of the analytes. The x-axis represents seven different time points of plasma procurement, with the first (1) taken at the ED and the seventh (7) isolated prior to discharge or death of the patient. Samples two to six were isolated during the hospital stay at approximately similar time intervals. Depicted are values of all n = 53 hospitalized COVID-19 patients with three time points. For n = 10 (solid dots) patients plasma samples at seven time points were analyzed. Open dots represent patients with three time points. Green dots = discharged patients, black dots = patients with fatal outcome. Shown are data for individual COVID-19 patients with survival (solid green dots = patients with seven time points, open green dots = patients with three time points) and mean values (solid green line) with standard deviation (light green area) and data for individual COVID-19 patients with fatal outcome (solid black dots = patients with seven time points, open black dots = patients with three time points) and mean values (solid black lines) with standard deviation (grey area).

References

    1. Wynants L., Van Calster B., Collins G.S., Riley R.D., Heinze G., Schuit E., Bonten M.M.J., Dahly D.L., Damen J.A.A., Debray T.P.A., et al. Prediction Models for Diagnosis and Prognosis of Covid-19 Infection: Systematic Review and Critical Appraisal. BMJ. 2020;369:m1328. doi: 10.1136/bmj.m1328. - DOI - PMC - PubMed
    1. Giorgi Rossi P., Marino M., Formisano D., Venturelli F., Vicentini M., Grilli R., Reggio Emilia C.-W.G. Characteristics and Outcomes of a Cohort of Covid-19 Patients in the Province of Reggio Emilia, Italy. PLoS ONE. 2020;15:e0238281. doi: 10.1371/journal.pone.0238281. - DOI - PMC - PubMed
    1. Goodman K.E., Magder L.S., Baghdadi J.D., Pineles L., Levine A.R., Perencevich E.N., Harris A.D. Impact of Sex and Metabolic Comorbidities on Covid-19 Mortality Risk across Age Groups: 66,646 Inpatients across 613 U.S. Hospitals. Clin. Infect. Dis. 2020 doi: 10.1093/cid/ciaa1787. - DOI - PMC - PubMed
    1. Zhang Y., Gargan S., Lu Y., Stevenson N.J. An Overview of Current Knowledge of Deadly Covs and Their Interface with Innate Immunity. Viruses. 2021;13:560. doi: 10.3390/v13040560. - DOI - PMC - PubMed
    1. Fajgenbaum D.C., June C.H. Cytokine Storm. N. Engl. J. Med. 2020;383:2255–2273. doi: 10.1056/NEJMra2026131. - DOI - PMC - PubMed

Publication types