. 2021 Nov 24;10(12):2569.
doi: 10.3390/plants10122569.

Genetic Dissection of Mature Root Characteristics by Genome-Wide Association Studies in Rapeseed (Brassica napus L.)

Affiliations

Genetic Dissection of Mature Root Characteristics by Genome-Wide Association Studies in Rapeseed (Brassica napus L.)

Sani Ibrahim et al. Plants (Basel). .

Abstract

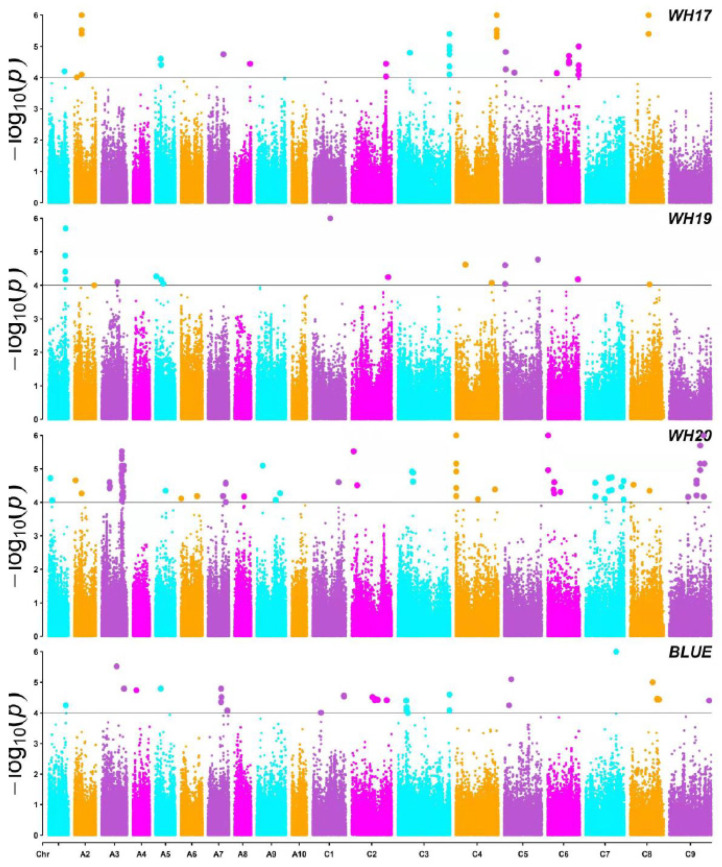
Roots are complicated quantitative characteristics that play an essential role in absorbing water and nutrients. To uncover the genetic variations for root-related traits in rapeseed, twelve mature root traits of a Brassica napus association panel were investigated in the field within three environments. All traits showed significant phenotypic variation among genotypes, with heritabilities ranging from 55.18% to 79.68%. Genome-wide association studies (GWAS) using 20,131 SNPs discovered 172 marker-trait associations, including 103 significant SNPs (-log10 (p) > 4.30) that explained 5.24-20.31% of the phenotypic variance. With the linkage disequilibrium r2 > 0.2, these significant associations were binned into 40 quantitative trait loci (QTL) clusters. Among them, 14 important QTL clusters were discovered in two environments and/or with phenotypic contributions greater than 10%. By analyzing the genomic regions within 100 kb upstream and downstream of the peak SNPs within the 14 loci, 334 annotated genes were found. Among these, 32 genes were potentially associated with root development according to their expression analysis. Furthermore, the protein interaction network using the 334 annotated genes gave nine genes involved in a substantial number of interactions, including a key gene associated with root development, BnaC09g36350D. This research provides the groundwork for deciphering B. napus' genetic variations and improving its root system architecture.

Keywords: Brassica napus; GWAS; QTL; candidate genes; root traits.


Conflict of interest statement

The authors declare no conflict of interest.

Figures

Figure 1
Figure 1
Correlation analyses between root-related traits. The plots on the diagonal line show the traits. Above the diagonal line are Pearson correlation coefficient values between traits. The plots below the diagonal line indicate the strength of the correlation coefficient values; ellipses with “X” inside them depict insignificant correlation. Significant differences at p < 0.05. Refer to Table 1 for the definition of terms.
Figure 2
Figure 2
Linkage disequilibrium (LD) analysis and population structure and relative kinships of the 338 B. napus accession populations. (A) Linkage disequilibrium decay calculated by squared correlations of allele frequencies (r2) against the distance between polymorphic sites in the A subgenome (red), C subgenome (grey), and A + C subgenome (blue). (B) Distribution of pairwise relative kinship estimates in the entire population. (C) The log-likelihood of the data (LnP[D]) of possible clusters (K) from one to 10. (D) Structure of the population based on K = 3. Subpopulations 1, 2, and 3 are represented by P1, P2, and P3, respectively.
Figure 3
Figure 3
Manhattan plot of the phenotype-genotype association analysis for twelve root-related traits of B. napus by MLM in three environments and BLUE (WH17, WH19, WH20, and BLUE). The different colors in the plots indicate the 19 chromosomes from A01 to C09; the thick horizontal lines represent the threshold values (−log101/20,131 = 4.30 × 10⁻⁵) 4.30 × 10⁻⁵. The color dots above the threshold values indicate the significant SNPs.
Figure 4
Figure 4
Phylogenetic tree analysis, gene structure, and subcellular localization of the B. napus candidate genes (A) Phylogenetic tree and subgroup representation of genes in B. napus, A. thaliana, Zea mays, and Oryza sativa. MEGA 7 software was used to construct the phylogenetic tree using the neighbor-joining method with a bootstrap value of 1000. The numbers beside the branches show the bootstrap values. (B) The distribution of exons and introns in the genes. (C) The distribution of genes throughout subcellular organelles. The red and yellow hue shows the density of the gene in the organelle.

Similar articles

Cited by

References

    1. Khan M.A., Gemenet D.C., Villordon A. Root system architecture and abiotic stress tolerance: Current knowledge in root and tuber crops. Front. Plant Sci. 2016;7:1–13. doi: 10.3389/fpls.2016.01584. - DOI - PMC - PubMed
    1. Grossman J.D., Rice K.J. Evolution of root plasticity responses to variation in soil nutrient distribution and concentration. Evol. Appl. 2012;5:850–857. doi: 10.1111/j.1752-4571.2012.00263.x. - DOI - PMC - PubMed
    1. Bao Y., Aggarwal P., Robbins N.E., Sturrock C.J., Thompson M.C., Qi H., Tham C. Plant roots use a patterning mechanism to position lateral root branches toward available water. Proc. Natl. Acad. Sci. USA. 2014;111:9319–9324. doi: 10.1073/pnas.1400966111. - DOI - PMC - PubMed
    1. Smith S., de Smet I. Root system architecture: Insights from Arabidopsis and cereal crops. Philos. Trans. R. Soc. B Biol. Sci. 2012;367:1441–1452. doi: 10.1098/rstb.2011.0234. - DOI - PMC - PubMed
    1. Huang J., Liu X., Wang J., Lu Y. Transcriptomic analysis of Asiatic lily in the process of vernalization via RNA-seq. Mol. Biol. Rep. 2014;41:3839–3852. doi: 10.1007/s11033-014-3250-2. - DOI - PubMed

LinkOut - more resources