

Evolution of 14-3-3 Proteins in Angiosperm Plants: Recurring Gene Duplication and Loss
- PMID: 34961196
- PMCID: PMC8703263
- DOI: 10.3390/plants10122724
Evolution of 14-3-3 Proteins in Angiosperm Plants: Recurring Gene Duplication and Loss
Abstract
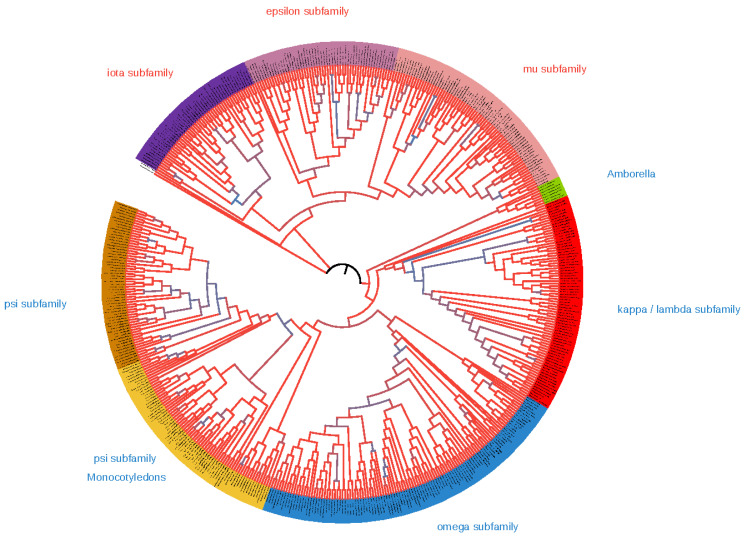
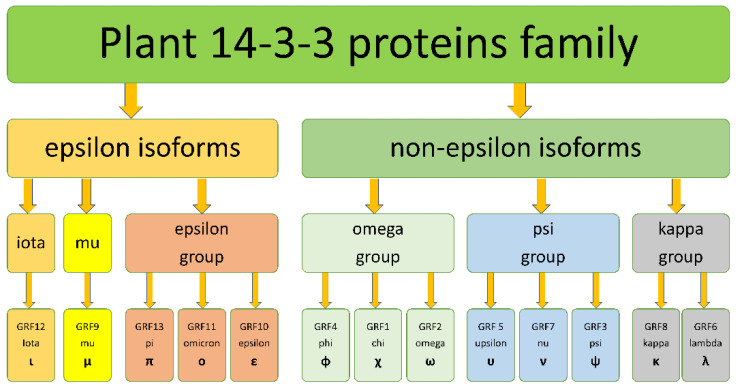
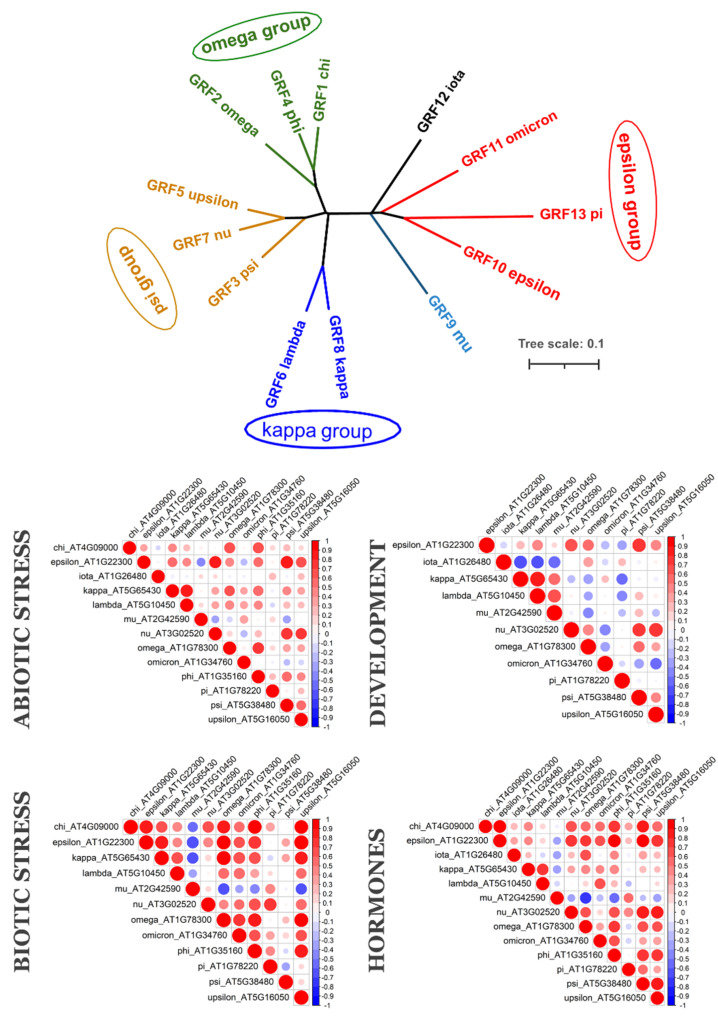
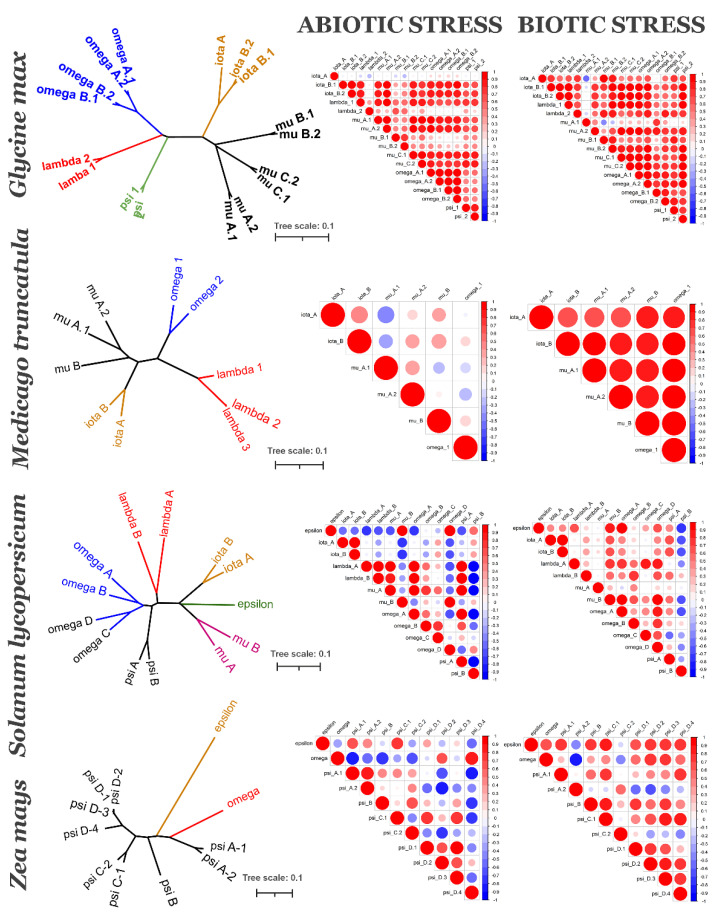
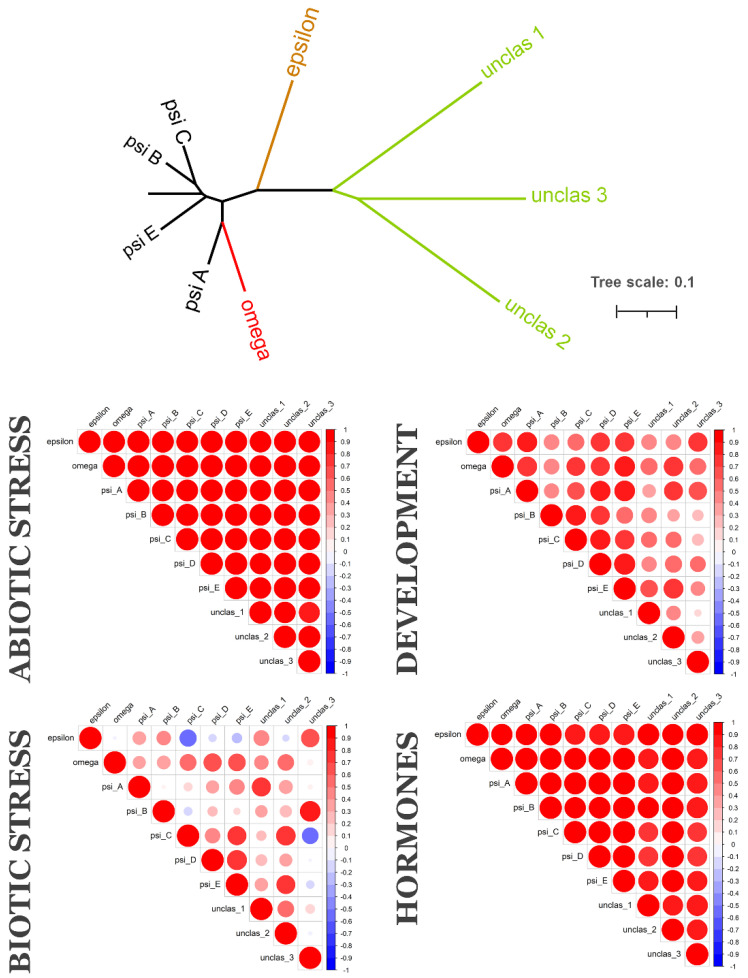
14-3-3 proteins are key regulatory factors in plants and are involved in a broad range of physiological processes. We addressed the evolutionary history of 14-3-3s from 46 angiosperm species, including basal angiosperm Amborella and major lineage of monocotyledons and eudicotyledons. Orthologs of Arabidopsis isoforms were detected. There were several rounds of duplication events in the evolutionary history of the 14-3-3 protein family in plants. At least four subfamilies (iota, epsilon, kappa, and psi) formed as a result of ancient duplication in a common ancestor of angiosperm plants. Recent duplication events followed by gene loss in plant lineage, among others Brassicaceae, Fabaceae, and Poaceae, further shaped the high diversity of 14-3-3 isoforms in plants. Coexpression data showed that 14-3-3 proteins formed different functional groups in different species. In some species, evolutionarily related groups of 14-3-3 proteins had coexpressed together under certain physiological conditions, whereas in other species, closely related isoforms expressed in the opposite manner. A possible explanation is that gene duplication and loss is accompanied by functional plasticity of 14-3-3 proteins.
Keywords: 14-3-3 proteins; MrBayes; coexpression; gene family; molecular phylogeny; whole-genome duplication.
Conflict of interest statement
The authors declare no conflict of interest.
Figures
Similar articles
-
Evolution of RLSB, a nuclear-encoded S1 domain RNA binding protein associated with post-transcriptional regulation of plastid-encoded rbcL mRNA in vascular plants.BMC Evol Biol. 2016 Jun 29;16(1):141. doi: 10.1186/s12862-016-0713-1. BMC Evol Biol. 2016. PMID: 27356975 Free PMC article.
-
Ancient Duplication and Lineage-Specific Transposition Determine Evolutionary Trajectory of ERF Subfamily across Angiosperms.Int J Mol Sci. 2024 Apr 1;25(7):3941. doi: 10.3390/ijms25073941. Int J Mol Sci. 2024. PMID: 38612750 Free PMC article.
-
Evolutionary history and functional divergence of the cytochrome P450 gene superfamily between Arabidopsis thaliana and Brassica species uncover effects of whole genome and tandem duplications.BMC Genomics. 2017 Sep 18;18(1):733. doi: 10.1186/s12864-017-4094-7. BMC Genomics. 2017. PMID: 28923019 Free PMC article.
-
Polyploidy and interspecific hybridization: partners for adaptation, speciation and evolution in plants.Ann Bot. 2017 Aug 1;120(2):183-194. doi: 10.1093/aob/mcx079. Ann Bot. 2017. PMID: 28854567 Free PMC article. Review.
-
Gene duplication within the Green Lineage: the case of TEL genes.J Exp Bot. 2012 Sep;63(14):5061-77. doi: 10.1093/jxb/ers181. Epub 2012 Aug 3. J Exp Bot. 2012. PMID: 22865910 Review.
Cited by
-
Comparatively Evolution and Expression Analysis of GRF Transcription Factor Genes in Seven Plant Species.Plants (Basel). 2023 Jul 27;12(15):2790. doi: 10.3390/plants12152790. Plants (Basel). 2023. PMID: 37570944 Free PMC article.
-
Ectopic over-expression of HaFT-1, a 14-3-3 protein from Haloxylon ammodendron, enhances acquired thermotolerance in transgenic Arabidopsis.Plant Mol Biol. 2023 Jul;112(4-5):261-277. doi: 10.1007/s11103-023-01361-5. Epub 2023 Jun 21. Plant Mol Biol. 2023. PMID: 37341869
-
Functional Diversification and the Plant Secondary Cell Wall.J Mol Evol. 2023 Dec;91(6):761-772. doi: 10.1007/s00239-023-10145-w. Epub 2023 Nov 18. J Mol Evol. 2023. PMID: 37979044 Review.
-
A 14-3-3 Protein-Encoding Gene, BdGF14g, Confers Better Drought Tolerance by Regulating ABA Biosynthesis and Signaling.Plants (Basel). 2023 Nov 26;12(23):3975. doi: 10.3390/plants12233975. Plants (Basel). 2023. PMID: 38068611 Free PMC article.
-
BnGF14-2c Positively Regulates Flowering via the Vernalization Pathway in Semi-Winter Rapeseed.Plants (Basel). 2022 Sep 3;11(17):2312. doi: 10.3390/plants11172312. Plants (Basel). 2022. PMID: 36079694 Free PMC article.
References
-
- Moore B., Perez V. Physiological and Biochemical Aspects of Nervous Integration. Prentice-Hall; Englewood Cliffs, NJ, USA: 1968. Specific acidic proteins of the nervous system; pp. 343–359.
Grants and funding
LinkOut - more resources
Full Text Sources
