. 2022 Feb;15(1):e003365.
doi: 10.1161/CIRCGEN.121.003365. Epub 2021 Dec 28.

Integrative Prioritization of Causal Genes for Coronary Artery Disease

Affiliations

Integrative Prioritization of Causal Genes for Coronary Artery Disease

Ke Hao et al. Circ Genom Precis Med. 2022 Feb.

Abstract

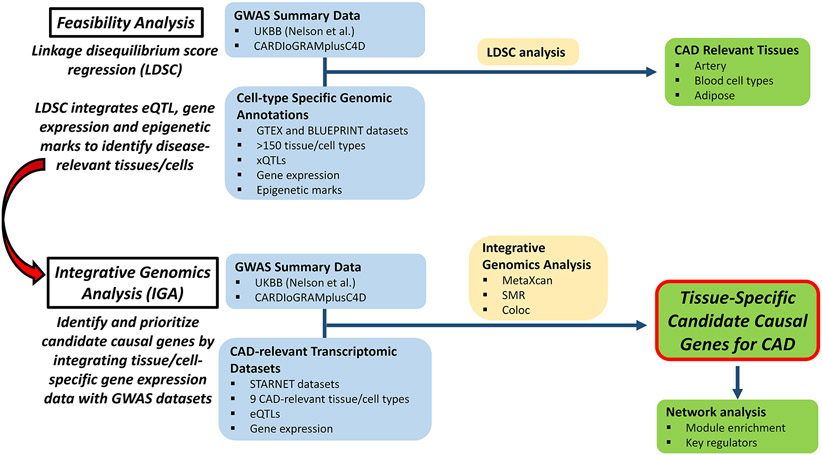
Background: Hundreds of candidate genes have been associated with coronary artery disease (CAD) through genome-wide association studies. However, a systematic way to understand the causal mechanism(s) of these genes, and a means to prioritize them for further study, has been lacking. This represents a major roadblock for developing novel disease- and gene-specific therapies for patients with CAD. Recently, powerful integrative genomics analyses pipelines have emerged to identify and prioritize candidate causal genes by integrating tissue/cell-specific gene expression data with genome-wide association study data sets.

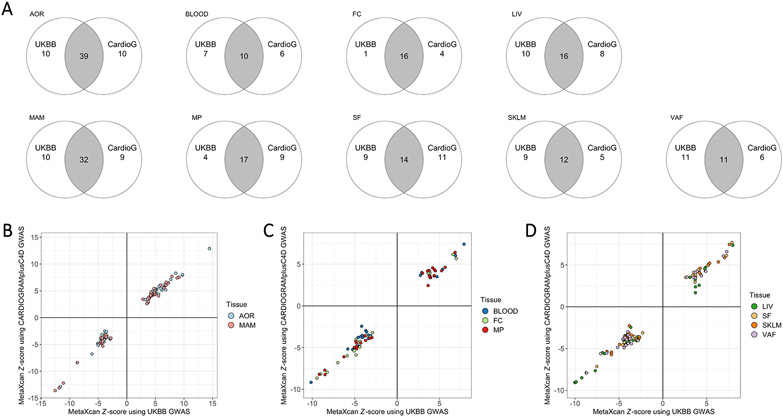
Methods: We aimed to develop a comprehensive integrative genomics analyses pipeline for CAD and to provide a prioritized list of causal CAD genes. To this end, we leveraged several complimentary informatics approaches to integrate summary statistics from CAD genome-wide association studies (from UK Biobank and CARDIoGRAMplusC4D) with transcriptomic and expression quantitative trait loci data from 9 cardiometabolic tissue/cell types in the STARNET study (Stockholm-Tartu Atherosclerosis Reverse Network Engineering Task).

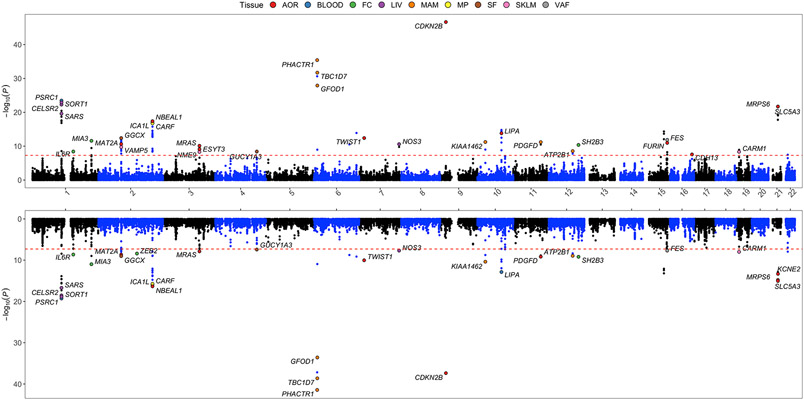
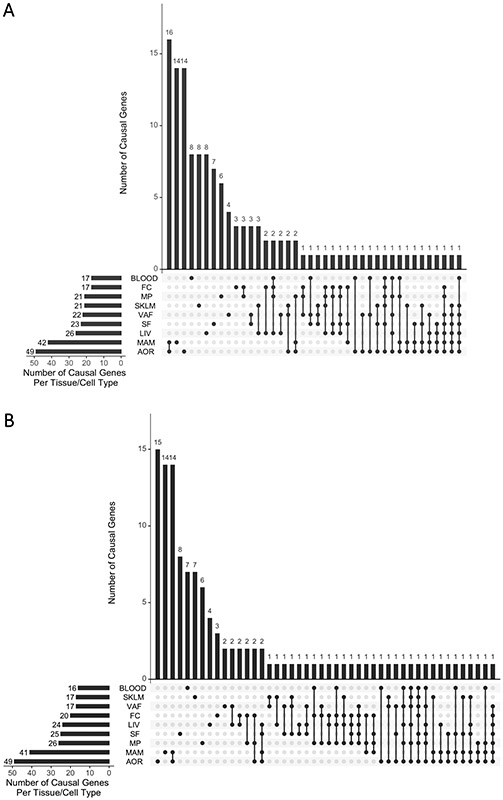
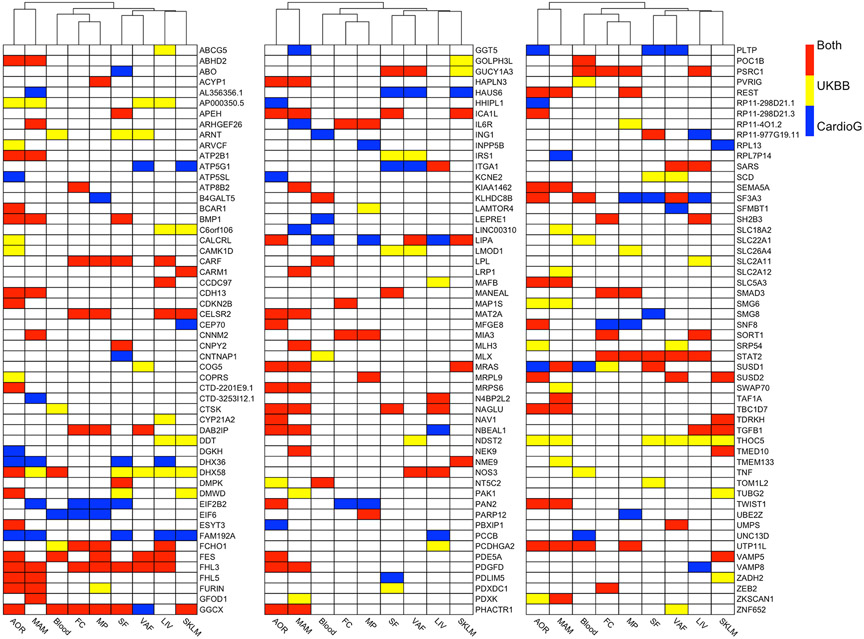
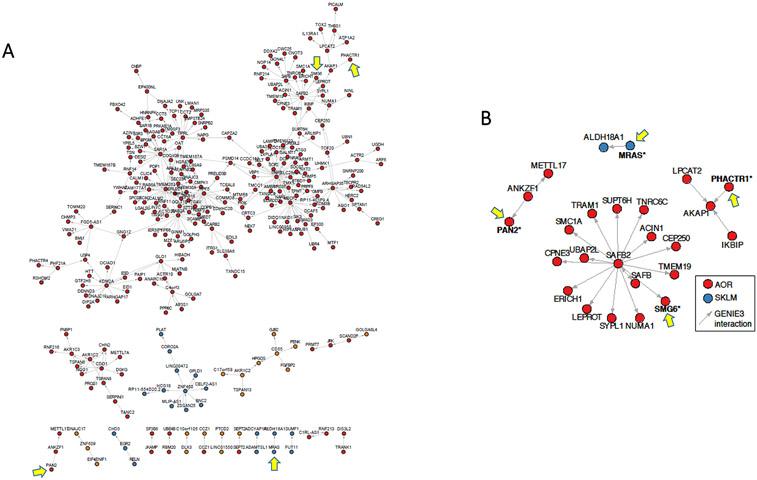
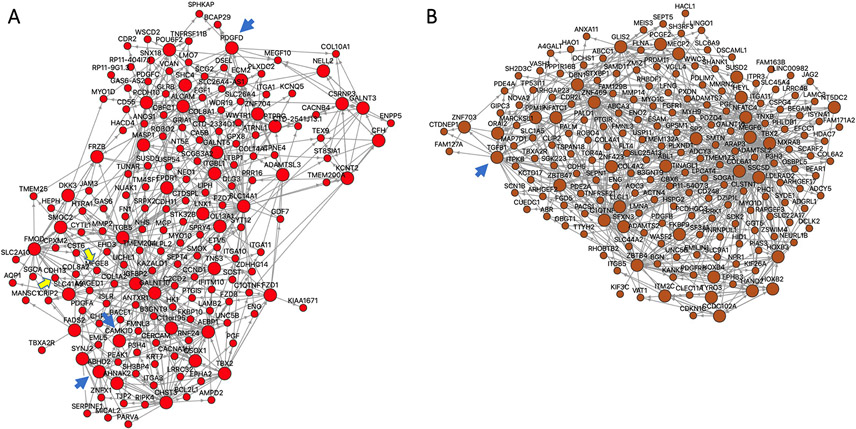
Results: We identified 162 unique candidate causal CAD genes, which exerted their effect from between one and up to 7 disease-relevant tissues/cell types, including the arterial wall, blood, liver, skeletal muscle, adipose, foam cells, and macrophages. When their causal effect was ranked, the top candidate causal CAD genes were CDKN2B (associated with the 9p21.3 risk locus) and PHACTR1; both exerting their causal effect in the arterial wall. A majority of candidate causal genes were represented in cross-tissue gene regulatory co-expression networks that are involved with CAD, with 22/162 being key drivers in those networks.

Conclusions: We identified and prioritized candidate causal CAD genes, also localizing their tissue(s) of causal effect. These results should serve as a resource and facilitate targeted studies to identify the functional impact of top causal CAD genes.

Keywords: aorta; atherosclerosis; coronary artery disease; genomics; liver.


Figures

Figure 1.
Figure 1.. Flow diagram and study design.
Figure 2.
Figure 2.. Manhattan plot of IGA and MetaXcan results demonstrating tissue-specific gene expression associated with CAD genetic risk loci.
Upper panel, candidate CAD causal genes identified by integrating STARNET eQTLs (9 tissue/cell types) and UKBB GWAS data. Y axis denotes −log10(MetaXcan P value). Only genes with a MetaXcan P value < 5x10⁻⁸ (dashed red line) are shown. The tissue where the most significant MetaXcan P value was observed is color coded. Lower panel, candidate CAD causal genes identified using the same IGA pipeline by integrating STARNET eQTLs and CARDIoGRAMplusC4D CAD GWAS.
Figure 3.
Figure 3.. Summary of IGA and MetaXcan results.
(A) MetaXcan results based on UKBB GWAS data. The X axis shows different tissue/cell types, and combinations of these different tissue/cell types, from among the 9 tissue/cell types sampled in STARNET. The Y axis shows the number of genes identified by MetaXcan for that combination of tissue/cell types. (B) As per (A), showing MetaXcan results based on CARDIoGRAMplusC4D GWAS data.
Figure 4.
Figure 4.. Concordance of IGA using STARNET with alternate GWAS datasets.
(A) Venn diagrams showing the number of candidate causal CAD genes, for each tissue/cell type in STARNET, identified in an IGA using STARNET with either UKBB or CARDIoGRAMplusC4D (CardioG). (B) x-y plots of Z-score results generated using MetaXcan alone for UKBB versus CARDIoGRAMplusC4D GWAS data when integrated with STARNET eQTL data for AOR and MAM. (C) x-y plot as per (B) but using STARNET eQTL data for BLOOD, FC and MP. (D) x-y plot as per (B) but using STARNET eQTL data for LIV, SF, SKLM and VAF.
Figure 5.
Figure 5.. Heatmap showing 162 candidate causal CAD genes and the tissue(s) in which they exert their causal effect.
Candidate causal genes are shown for the IGA performed using STARNET with UKBB or CARDIoGRAMplusC4D GWASs. Genes are listed alphabetically, and tissue/cell types have been clustered. This is a visual summary of the genes listed in Supplemental Table VII, but also indicates all tissues in which these genes exert their causal effect (Supplemental Tables V and VI).
Figure 6.
Figure 6.. Key GRNs and inferred regulatory interactions of candidate causal CAD genes.
(A) In STARNET, GRN 154 is a cross-tissue module with 940 genes of which 61.3% are co-expressed in AOR, 31.3% in MAM, 5.6% in SKLM, and <1% each in VAF, SF, BLOOD and LIV. This IGA identified multiple candidate causal CAD genes in this GRN: PAN2, PHACTR1, SMG6, THOC5 (all in AOR), and MRAS in SKLM (Supplemental Table XII). The visualized network shows inferred gene regulatory interactions among key drivers and their related genes of GRN 154, comprising 372 inferred interactions between 281 genes (out of 940). In this GRN, the candidate causal CAD genes (yellow arrows) were found in non-key driver roles. (B) Close-up view of the second-order network neighborhood of PAN2, PHACTR1, SMG6 and MRAS in GRN 154.
Figure 7.
Figure 7.. Certain candidate causal CAD genes function as key drivers in GRNs.
(A) STARNET GRN 39, which is exclusively in AOR and contains 182 genes. GRN 39 includes 3 candidate causal CAD genes with a key driver role: ABHD2, CAMK1D, PDGFD, which are each highlighted by a blue arrow (Table 2). In addition, in non-key driver roles GRN 39 includes CDH13 and MFGE8 (Supplemental Table XII), which are highlighted by yellow arrows. (B) STARNET GRN 171, which is exclusively in LIV and contains 200 genes. GRN 171 includes only 1 causal CAD gene with a key driver role, being TGFβ1 (blue arrow) (Table 2). There are no other candidate causal CAD genes in this GRN.

References

    1. Nelson CP, Goel A, Butterworth AS, Kanoni S, Webb TR, Marouli E, Zeng L, Ntalla I, Lai FY, Hopewell JC, et al. Association analyses based on false discovery rate implicate new loci for coronary artery disease. Nat Genet. 2017;49:1385–1391. - PubMed
    1. Nikpay M, Goel A, Won HH, Hall LM, Willenborg C, Kanoni S, Saleheen D, Kyriakou T, Nelson CP, Hopewell JC, et al. A comprehensive 1,000 Genomes-based genome-wide association meta-analysis of coronary artery disease. Nat Genet. 2015;47:1121–30. - PMC - PubMed
    1. Bjorkegren JL, Kovacic JC, Dudley JT and Schadt EE. Genome-wide significant loci: how important are they? Systems genetics to understand heritability of coronary artery disease and other common complex disorders. J Am Coll Cardiol. 2015;65:830–45. - PMC - PubMed
    1. Erdmann J, Kessler T, Munoz Venegas L and Schunkert H. A decade of genome-wide association studies for coronary artery disease: the challenges ahead. Cardiovasc Res. 2018;114:1241–1257. - PubMed
    1. Ma L, Chandel N, Ermel R, Sukhavasi K, Hao K, Ruusalepp A, Bjorkegren JLM and Kovacic JC. Multiple independent mechanisms link gene polymorphisms in the region of ZEB2 with risk of coronary artery disease. Atherosclerosis. 2020;311:20–29. - PMC - PubMed

Publication types

MeSH terms