. 2021 Dec 27;21(1):1282.
doi: 10.1186/s12879-021-07002-w.

Prolonged viral shedding of SARS-CoV-2 and related factors in symptomatic COVID-19 patients: a prospective study

Affiliations

Prolonged viral shedding of SARS-CoV-2 and related factors in symptomatic COVID-19 patients: a prospective study

Hui Long et al. BMC Infect Dis. .

Abstract

Background: The temporal relationship between SARS-CoV-2 and antibody production and clinical progression remained obscure. The aim of this study was to describe the viral kinetics of symptomatic patients with SARS-CoV-2 infection and identify factors that might contribute to prolonged viral shedding.

Methods: Symptomatic COVID-19 patients were enrolled in two hospitals in Wuhan, China, from whom the respiratory samples were collected and measured for viral loads consecutively by reverse transcriptase quantitative PCR (RT-qPCR) assay. The viral shedding pattern was delineated in relate to the epidemiologic and clinical information.

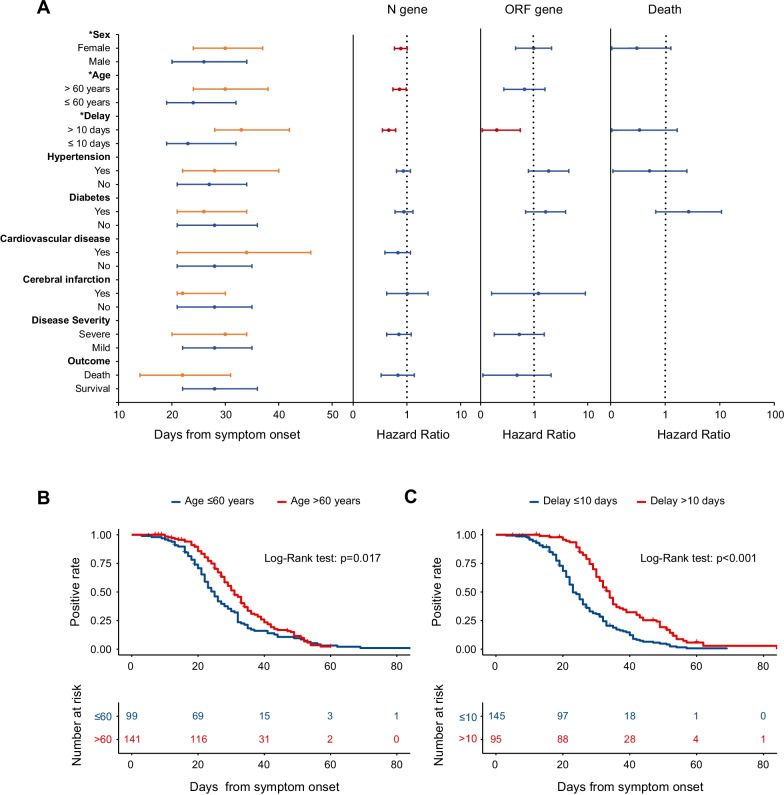
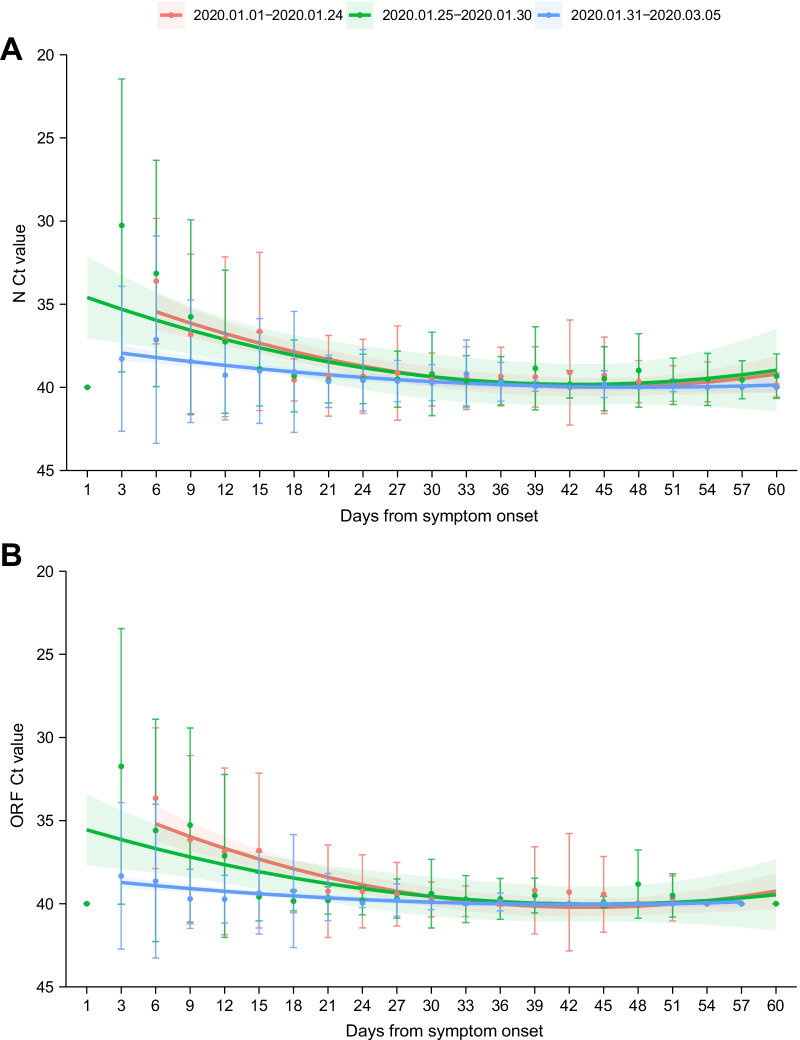
Results: Totally 2726 respiratory samples collected from 703 patients were quantified. The SARS-CoV-2 viral loads were at the highest level during the initial stage after symptom onset, which subsequently declined with time. The median time to SARS-CoV-2 negativity of nasopharyngeal test was 28 days, significantly longer in patients with older age (> 60 years old), female gender and those having longer interval from symptom onset to hospital admission (> 10 days). The multivariate Cox regression model revealed significant effect from older age (HR 0.73, 95% CI 0.55-0.96), female gender (HR 0.72, 95% CI 0.55-0.96) and longer interval from symptom onset to admission (HR 0.44, 95% CI 0.33-0.59) on longer time to SARS-CoV-2 negativity. The IgM antibody titer was significantly higher in the low viral loads group at 41-60 days after symptom onset. At the population level, the average viral loads were higher in early than in late outbreak periods.

Conclusions: The prolonged viral shedding of SARS-CoV-2 was observed in COVID-19 patients, particularly in older, female and those with longer interval from symptom onset to admission.

Keywords: Antibody; COVID-19; Risk factor; SARS-CoV-2; Viral shedding.


Conflict of interest statement

The authors declare that they have no competing interests.

Figures

Fig. 1
Fig. 1
Dynamic profile of viral loads and positive rates of SARS-CoV-2 based on N and ORF genes amplification among COVID-19 patients during the whole process of hospitalization. A The dynamic profile of viral loads [cycle threshold (Ct) value] measured by RT-qPCR assay using N and ORF specific primers in COVID-19 patients; B the dynamic profile of positive rates measured by N and ORF specific primers in COVID-19 patients. The positive for SARS-CoV-2 was defined by either positive for N or ORF of SARS-CoV-2. When applicable, mean ± standard deviation (SD) of Ct value is shown. Dots and error bars denote means and SDs, respectively
Fig. 2
Fig. 2
The time of SARS-CoV-2 RNA negativity in relation with demographic information among hospitalized COVID-19 patients. A The length of time to RT-PCR negativity compared between groups of patients based on Wilcoxon ranks sum test, asterisks represent significant differences between groups (P < 0.05). Dots and error bars denote medians and interquartile ranges, respectively (Left column). The hazard ratio (HR) and 95% confidence interval (CI) were displayed for the Cox regression model based on N, ORF gene and death outcome, the dots are the HRs and the error bars are the 95%CIs. The red color represents P < 0.05 and the blue color represents P ≥ 0.05. The dotted line indicates an OR of 1 (Middle and right column); B Kaplan–Meier curves compared by log-rank test on probability of RT-qPCR negativity according to age; C Kaplan–Meier curves compared by log-rank test on probability of RT-qPCR negativity according to the delay from symptom onset to hospital admission
Fig. 3
Fig. 3
Dynamic profile on viral loads detected by N gene (A) and ORF gene (B) among COVID-19 patients across the outbreak periods. Three periods (early, middle and late) were approximate equally classified based on the date of symptom onset of the included patients: 1st–24th January 2020 (red line, 229 patients), 25th–30th January 2020 (green line, 245 patients), and 31st January–5th March 2020 (blue line, 228 patients). Dots and error bars denote means and SDs, respectively

References

    1. World Health Organization. Coronavirus disease (COVID-19) technical guidance: laboratory testing for 2019-nCoV in humans. Available from: https://www.who.int/emergencies/diseases/novel-coronavirus-2019.
    1. Zou L, Ruan F, Huang M, Liang L, Huang H, Hong Z, et al. SARS-CoV-2 viral load in upper respiratory specimens of infected patients. N Engl J Med. 2020;382:1177–1179. doi: 10.1056/NEJMc2001737. - DOI - PMC - PubMed
    1. Holshue ML, DeBolt C, Lindquist S, Lofy KH, Wiesman J, Bruce H, et al. First case of 2019 novel coronavirus in the United States. N Engl J Med. 2020;382:929–936. doi: 10.1056/NEJMoa2001191. - DOI - PMC - PubMed
    1. Wu Y, Guo C, Tang L, Hong Z, Zhou J, Dong X, et al. Prolonged presence of SARS-CoV-2 viral RNA in faecal samples. Lancet Gastroenterol Hepatol. 2020;5:434–435. doi: 10.1016/S2468-1253(20)30083-2. - DOI - PMC - PubMed
    1. Lan L, Xu D, Ye G, Xia C, Wang S, Li Y, et al. Positive RT-PCR test results in patients recovered from COVID-19. JAMA. 2020;323:502–1503. doi: 10.1001/jama.2020.2783. - DOI - PMC - PubMed