. 2022 Apr;23(4):543-560.
doi: 10.1111/mpp.13177. Epub 2021 Dec 28.

Photosynthesis-related genes induce resistance against soybean mosaic virus: Evidence for involvement of the RNA silencing pathway

Affiliations

Photosynthesis-related genes induce resistance against soybean mosaic virus: Evidence for involvement of the RNA silencing pathway

John Bwalya et al. Mol Plant Pathol. 2022 Apr.

Abstract

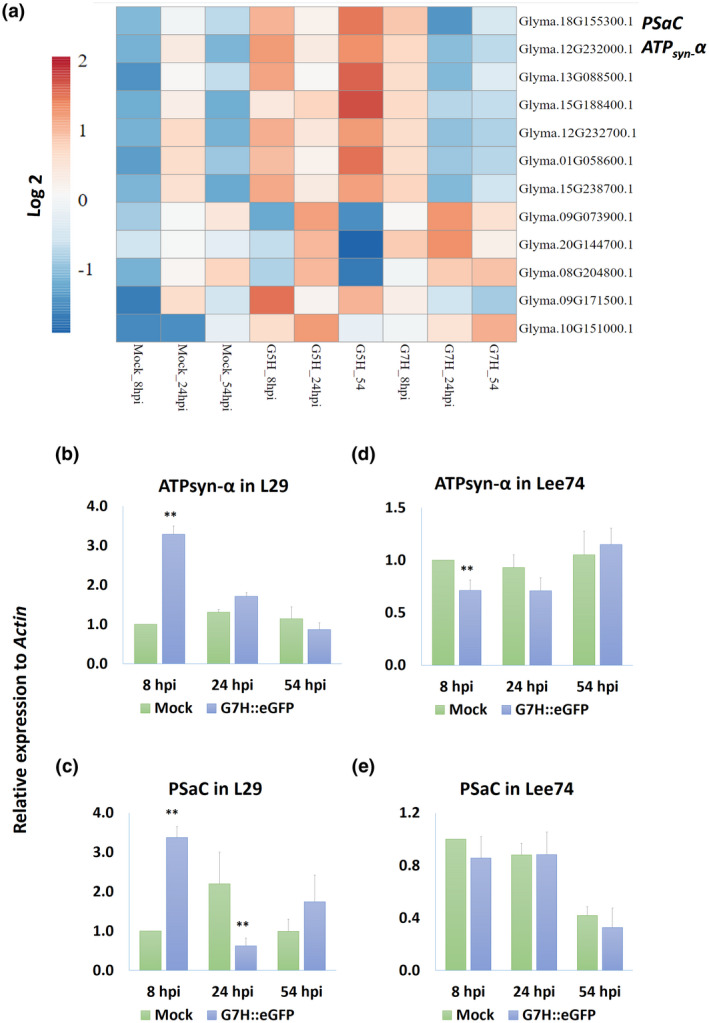
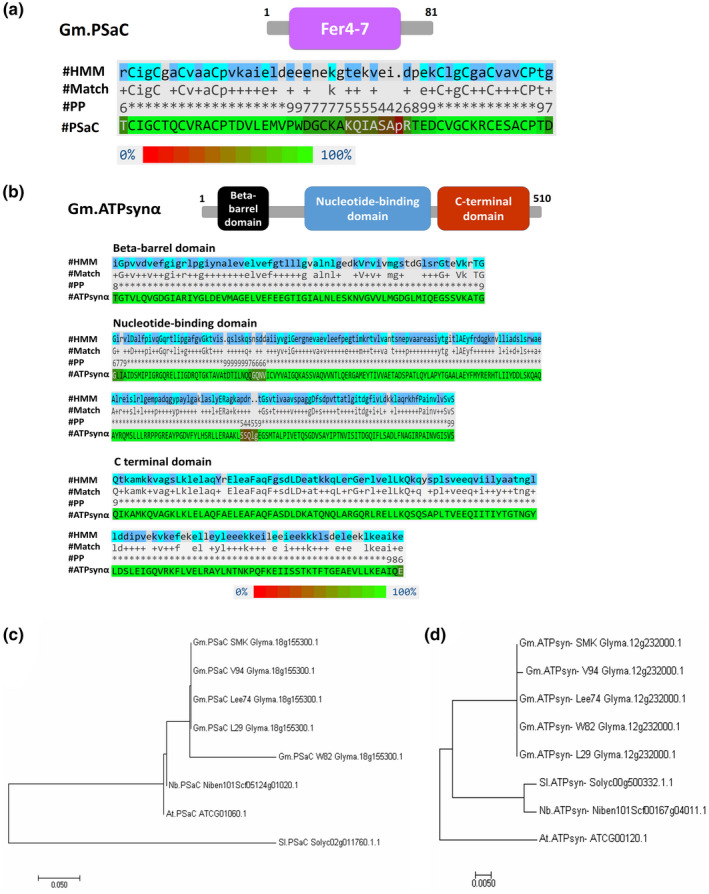
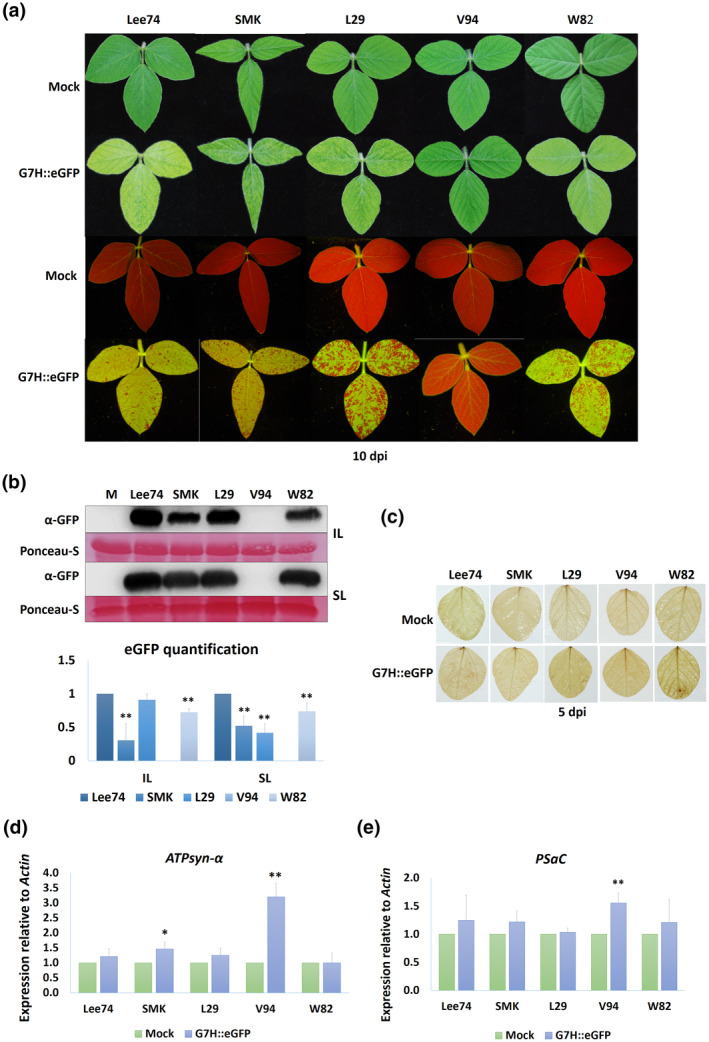
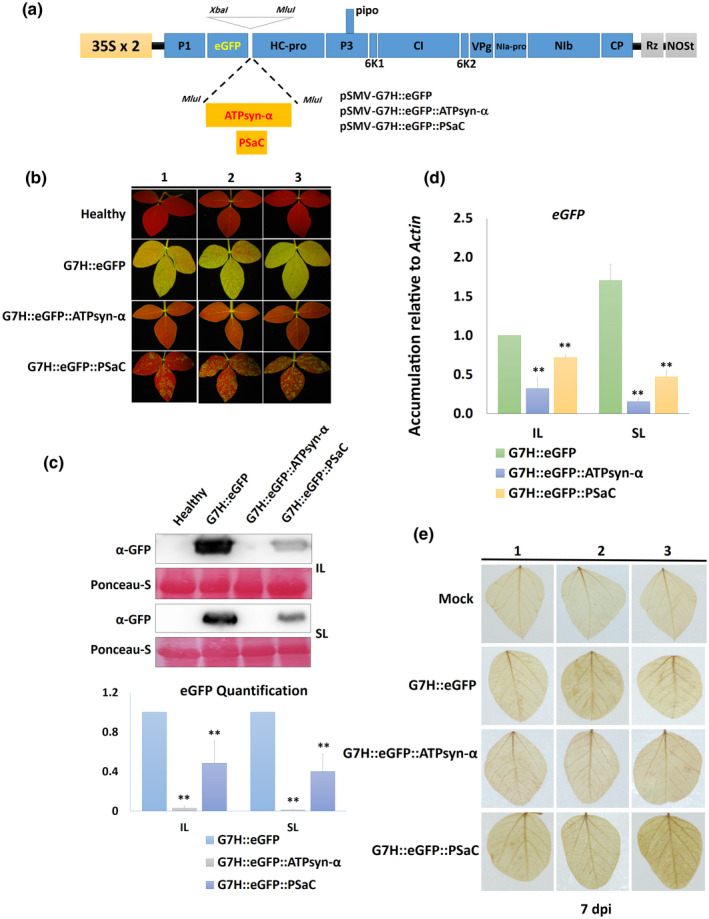
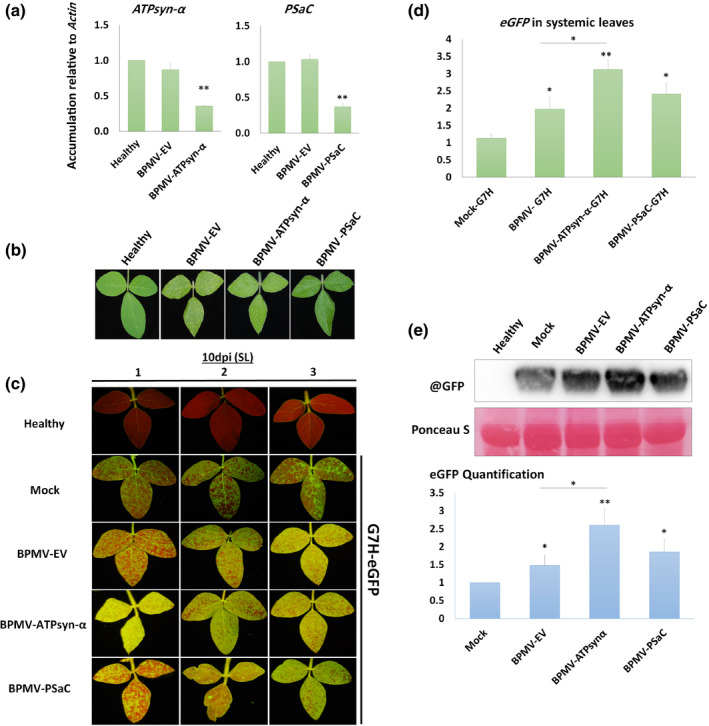
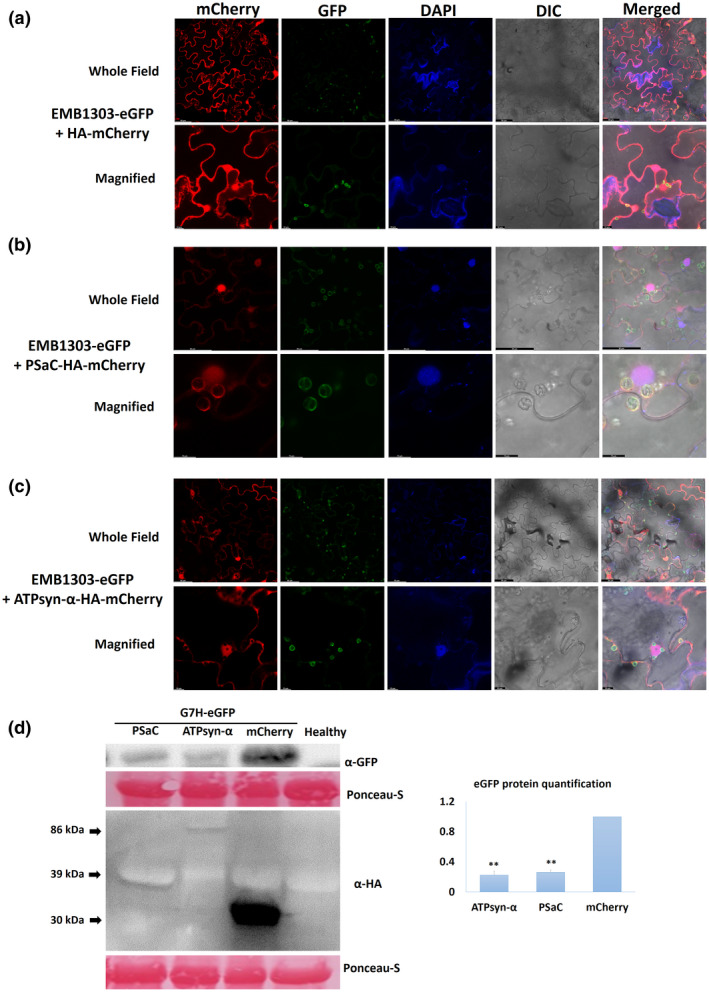
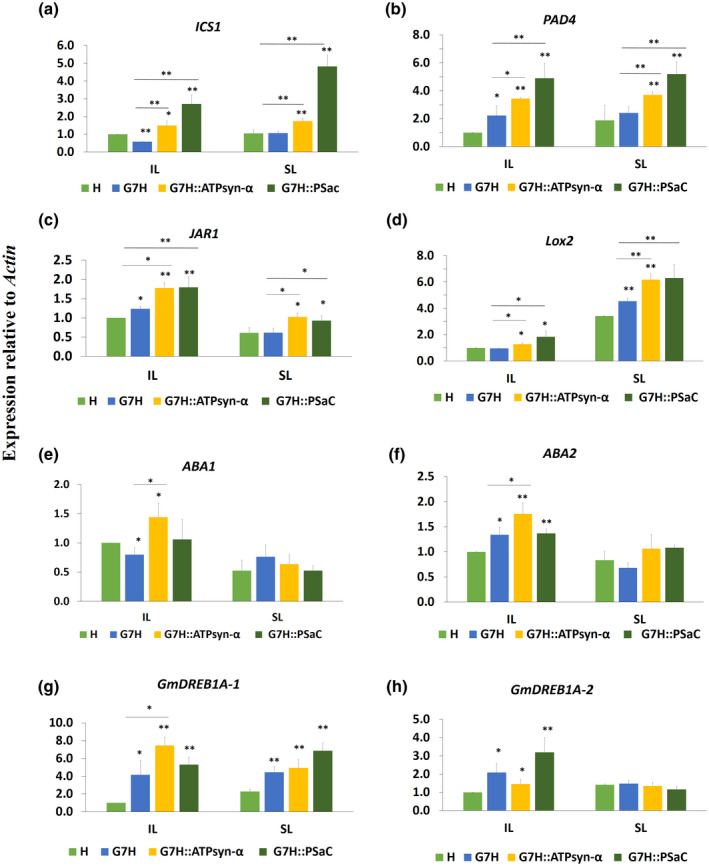
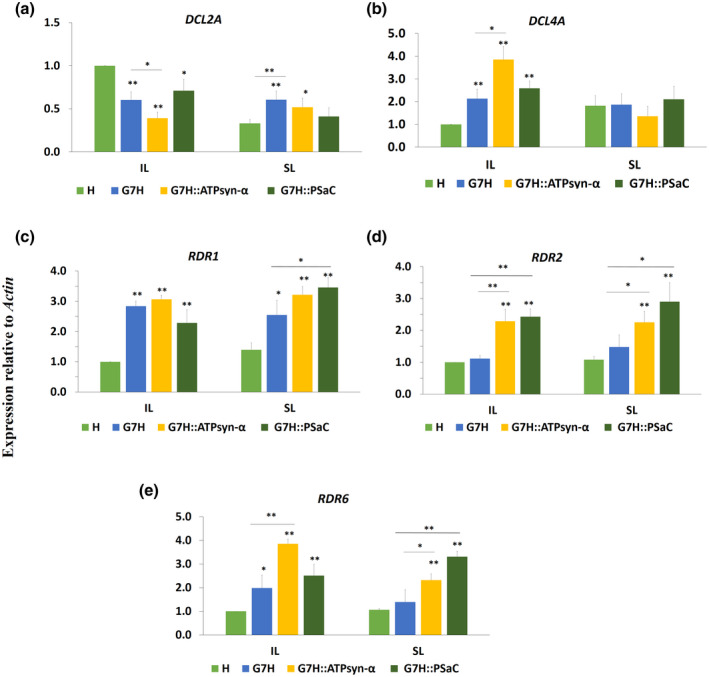
Increasing lines of evidence indicate that chloroplast-related genes are involved in plant-virus interactions. However, the involvement of photosynthesis-related genes in plant immunity is largely unexplored. Analysis of RNA-Seq data from the soybean cultivar L29, which carries the Rsv3 resistance gene, showed that several chloroplast-related genes were strongly induced in response to infection with an avirulent strain of soybean mosaic virus (SMV), G5H, but were weakly induced in response to a virulent strain, G7H. For further analysis, we selected the PSaC gene from the photosystem I and the ATP-synthase α-subunit (ATPsyn-α) gene whose encoded protein is part of the ATP-synthase complex. Overexpression of either gene within the G7H genome reduced virus levels in the susceptible cultivar Lee74 (rsv3-null). This result was confirmed by transiently expressing both genes in Nicotiana benthamiana followed by G7H infection. Both proteins localized in the chloroplast envelope as well as in the nucleus and cytoplasm. Because the chloroplast is the initial biosynthesis site of defence-related hormones, we determined whether hormone-related genes are involved in the ATPsyn-α- and PSaC-mediated defence. Interestingly, genes involved in the biosynthesis of several hormones were up-regulated in plants infected with SMV-G7H expressing ATPsyn-α. However, only jasmonic and salicylic acid biosynthesis genes were up-regulated following infection with the SMV-G7H expressing PSaC. Both chimeras induced the expression of several antiviral RNA silencing genes, which indicate that such resistance may be partially achieved through the RNA silencing pathway. These findings highlight the role of photosynthesis-related genes in regulating resistance to viruses.

Keywords: ATPsyn-α; PSaC; RNA silencing; photosynthesis; plant hormones; plant-virus interactions; soybean; soybean mosaic virus.


Conflict of interest statement

The authors declare no conflict of interest.

Figures

FIGURE 1
FIGURE 1
Expression of photosynthesis‐related genes in response to soybean mosaic virus (SMV) infection. (a) Heat‐map of photosynthesis‐related genes regulated by infection with the avirulent strain G5H or the virulent strain G7H of SMV. Expression of ATPsyn‐α (b) and PSaC (c) in L29 plants (which carry the Rsv3 resistance gene) at 8, 24, and 54 h postinfection (hpi) by G7H::eGFP. Expression of ATPsyn‐α (d) and PSaC (e) in Lee74 plants (rsv‐null) at 8, 24, and 54 hpi by G7H::eGFP. Actin11 was used as the internal control. In (b–e), values are means + SD of three biological replicates. Values were compared to that of the corresponding mock‐treated plants (the bar on the left) with one‐sided Student's t tests; * and ** indicate a significant difference at p < 0.05 and p < 0.01, respectively
FIGURE 2
FIGURE 2
Domains and phylogenetic analyses of GmPSaC and GmATPsyn‐α. (a) Conserved domain in GmPSaC. Protein sequence of GmPSaC BLASTed against the Pfam database showed that GmPSaC belongs to the Fer4‐7 superfamily. Alignment result between the hidden Markov model (HMM) and GmPSaC (positions 10–61, E‐value 1.55e−07). (b) Conserved domains in GmATPsyn‐α. Protein sequence of GmATPsyn‐α BLASTed against the Pfam database showed that GmATPsyn‐α belongs to the ATP synthase α/β family and has three domains. Alignment between HMM and GmATPsyn‐α showed that the protein has three domains: the 1‐β‐barrel domain (positions 29–93, E‐value 3.66e−16), the 2‐nucleotide‐binding domain (positions 150–365, E‐value 5.21e−114), and the 3‐C terminal domain (positions 372–496, E‐value 3.34e−59). #HMM is the hidden Markov model, and #Match indicates the match between the query sequence and the HMM. #PP indicates the posterior probability (or degree of confidence) in each individual aligned residue. The coloured PSaC or ATPsyn‐α sequences indicate the posterior probability according to the scale from 0% to 100% at the bottom. Analysis was carried out in the Pfam database v. 33.1. (c, d) Phylogenetic analysis (nucleic acid sequences) of GmPSaC (c) and GmATPsyn‐α (d) with homologs from five soybean cultivars: William 82 (W82), Lee74, Somyoungkong (SMK), V94, and L29, as well as orthologs from Arabidopsis thaliana, Nicotiana benthamiana, and Solanum lycopersicum. The phylogeny was generated using the neighbour‐joining method with MEGA 7 software. Numbers represent relative phylogenetic distance
FIGURE 3
FIGURE 3
Soybean susceptibility to infection by SMV‐G7H. (a) Visual symptoms on the following five soybean cultivars infected with pSMV‐G7H::eGFP: Lee74, Somyoungking (SMK), L29, V94, and William 82 (W82). (b) Western protein blot for green fluorescent protein (GFP) levels (upper panel) in soybean cultivars infected with pSMV‐G7H::eGFP and their quantified levels (lower panel). Inoculated leaves (IL) were assayed at 5 days postinoculation (dpi) and systemically infected leaves (SL) were assayed at 10 dpi. M is mock from uninfected Lee74 plants, which were used as a negative control. Ponceau S staining of RuBisCO was used on the loading control. The blot is a representative of three biological replicates with similar results. (c) Accumulation of reactive oxygen species (ROS) in soybean cultivars as indicated by 3,3′‐diaminobenzidine staining at 5 dpi of pSMV‐G7H::eGFP. (d, e) Relative expression levels of ATPsyn‐α (d) and PSaC (e) in the five soybean cultivars infected with pSMV‐G7H::eGFP at 5 dpi. Values are means + SD of three biological replicates. Statistical analysis was carried out as described in the legend of Figure 1; * and ** indicate a significant difference at p < 0.05 and p < 0.01, respectively
FIGURE 4
FIGURE 4
Effect of overexpressing ATPsyn‐α and PSaC on resistance against G7H in the susceptible cultivar Lee74. (a) Schematic drawing of pSMV‐G7H::eGFP construct with the insertion site for ATPsyn‐α and PSaC downstream of the GFP coding sequence; the expression of the construct is driven by two copies of the CaMV 35S promoter (35S × 2) and is terminated by an NOS terminator (NOSt). Rz is a cis‐cleaving ribozyme sequence. (b) Green fluorescent protein (GFP) visual levels in the systemically infected leaves (SL) of Lee74 plants. The first unifoliate leaves of 12‐day‐old seedlings were infected with pSMV‐G7H::eGFP, pSMV‐G7H::eGFP::ATPsyn‐α, or pSMV‐G7H::eGFP::PSaC. Fourteen days later, the SL from three plants (1, 2, and 3) were photographed under UV light. (c) Western protein blot for GFP levels (upper panel) in the inoculated leaves (IL) and the SL, and their quantified levels (lower panel). Ponceau S staining of RuBisCO was used on the loading control. (d) Relative expression levels of GFP RNA in IL and SL of Lee74 infected with pSMV‐G7H::eGFP constructs. Actin11 was used as the internal control. Values are means + SD of three biological replicates. Statistical analysis was carried out as described in the legend of Figure 1; ** indicates a significant difference at p < 0.01. (e) Detection of reactive oxygen species in Lee74 as indicated by 3,3′‐dimainobenzidine staining at 7 days postinoculation (dpi)
FIGURE 5
FIGURE 5
Effect of silencing GmATPsyn‐α and GmPSaC on soybean susceptibility to SMV‐G7H infection. Lee74 plants were silenced in GmATPsyn‐α and GmPSaC using BPMV silencing vector. (a) Relative expression levels of ATPsyn‐α (left) and PSaC (right) in the upper systemic leaves of Lee74 plants 14 days after BPMV infection in the empty vector (BPMV‐EV), ATPsyn‐α‐silenced (BPMV‐ATPsyn‐α), and PSaC‐silenced plants (BPMV‐PSaC). Healthy plants were used as negative control. Actin was used as internal control. Values are means + SD of three biological replicates. Statistical analysis was carried out as described in the legend of Figure 1; ** indicates a significant difference at p < 0.01. (b) Mottling symptoms developed in silenced Lee74 plants compared to BPMV‐EV control or healthy plants. (c) Green fluorescent protein (GFP) fluorescence from the upper systemic leaves of silenced plants infected with pSMV‐G7H::eGFP at 10 days postinoculation (dpi). Mock plants were treated with phosphate buffer as a control for BPMV infection. (d) Relative expression levels of eGFP in the Lee74 systemically infected leaves with pSMV‐G7H::eGFP at 10 dpi. Healthy plants were used as negative control. Actin was used as internal control. Values are means + SD of three biological replicates. Statistical analysis was carried out as described in the legend of Figure 1; significant difference at *p < 0.05, **p < 0.01. (e) Protein blot of GFP levels (upper panel) in the Lee74 systemically infected leaves with pSMV‐G7H::e GFP at 10 dpi, and their quantified levels (lower panel). Ponceau S staining of RuBisCO was used on the loading control. The blot is a representative of three biological replicates with similar results
FIGURE 6
FIGURE 6
Localization and effects of GmATPsyn‐α and GmPSaC on resistance to SMV‐G7H in Nicotiana benthamiana leaves. (a) Localization of the chloroplast‐marker protein AtEMB1303‐eGFP with pBin‐3HA‐mCherry as a control. (b) Co‐localization of EMB1303‐eGFP and PSaC‐HA‐mCherry. (c) Co‐localization of EMB1303‐eGFP and ATPsyn‐α‐3HA‐mCherry. N. benthamiana plants were agroinfiltrated with pBin‐eGFP‐AtEMB1303 (chloroplast‐marker protein) with pBin‐3HA‐mCherry constructs carrying GmATPsyn‐α or GmP S aC, and pPZP‐2b, which carries the CMV suppressor of RNA‐silencing protein gene (2b) to enhance the transient expression. DAPI was used to stain nuclei. Leaves were photographed 3 days after agroinfiltration. Scale bars measure 50 µm for the whole field and 10 µm for the magnified field. (d) Effect of transient overexpression of PSaC and ATPsyn‐α on resistance to SMV‐G7H in N. benthamiana plants. The same agrobacterial cultures used for the localization test were used without pPZP2b for the SMV‐G7H::eGFP infection. One day after agroinfiltration, N. benthamiana leaves were sap‐infected with SMV‐G7H::eGFP prepared from infected soybean plants. Samples were collected at 5 days postinoculation, and western protein blots were hybridized with anti‐GFP to detect eGFP from SMV‐G7H, and anti‐HA to detect GmPSaC (39 kDa), GmATPsyn‐α (80 kDa), and the empty vector 3HA‐mCherry (30 kDa). eGFP levels were quantified using ImageJ (right panel). Ponceau S staining of RuBisCO was used as the internal control, and the blots are representatives of three biological replicates. ** indicates a significant difference at p < 0.01
FIGURE 7
FIGURE 7
Expression levels of key genes of defence‐related hormones in Lee74 plants in response to SMV‐G7H expressing ATPsyn‐α and PSaC genes. Relative expression levels in Lee74 plants of salicylic acid‐related genes ICS1 (a) and PAD4 (b); jasmonic acid‐related genes JAR1 (c) and Lox2 (d), abscisic acid biosynthesis genes ABA1 (e) and ABA2 (f), and ethylene‐related genes Gm DREB1A‐1 (g) and Gm DREB1A‐2 (h). The unifoliate leaves of Lee74 plants were inoculated with pSMV‐G7H::eGFP expressing ATPsyn‐α or PSaC genes (pSMV‐G7H::eGFP::ATPsyn‐α or pSMV‐G7H::eGFP::PSaC, respectively); the inoculated leaves (IL) and systemically infected leaves (SL) were collected at 7 and 14 days postinoculation, respectively. Actin11 was used as the internal control. Values are means + SD of three biological replicates. Statistical analysis was carried out as described in Figure 1; * and ** indicate a significant difference at p < 0.05 and p < 0.01, respectively. An additional t test was carried out to compare expressions in the pSMV‐G7H::eGFP::ATPsyn‐α and pSMV‐G7H::eGFP::PSaC treatments to that in pSMV‐G7H::eGFP
FIGURE 8
FIGURE 8
Expression levels of RNA silencing genes in Lee74 plants in response to SMV‐G7H expressing ATPsyn‐α and PSaC genes. Relative expression of Dicer‐like (DCL) 2a (a) and DCL4a (b), and of RNA‐dependent RNA polymerase (RDR) 1a (c), RDR2a (d), and RDR6a (e) in Lee74 plants. Actin11 was used as the internal control. Values are means + SD of three biological replicates. Statistical analysis was carried out as described in Figure 1; * and ** indicate a significant difference at p < 0.05 and p < 0.01, respectively. An additional t test was carried out to compare expression in the pSMV‐G7H::eGFP::ATPsyn‐α and pSMV‐G7H::eGFP::PSaC treatment with that in the pSMV‐G7H::e GFP treatment

Similar articles

Cited by

References

    1. Alazem, M. , He, M.H. , Chang, C.H. , Cheng, N. & Lin, N.S. (2020) Disrupting the homeostasis of high mobility group protein promotes the systemic movement of Bamboo mosaic virus. Frontiers in Plant Science, 11, 597665. - PMC - PubMed
    1. Alazem, M. , He, M.H. , Moffett, P. & Lin, N.S. (2017) Abscisic acid induces resistance against Bamboo mosaic virus through argonaute2 and 3. Plant Physiology, 174, 339–355. - PMC - PubMed
    1. Alazem, M. , Kim, K.H. & Lin, N.S. (2019) Effects of abscisic acid and salicylic acid on gene expression in the antiviral RNA silencing pathway in Arabidopsis. International Journal of Molecular Sciences, 20, 2538. - PMC - PubMed
    1. Alazem, M. & Lin, N.S. (2015) Roles of plant hormones in the regulation of host–virus interactions. Molecular Plant Pathology, 16, 529–540. - PMC - PubMed
    1. Alazem, M. & Lin, N.S. (2020) Interplay between ABA signaling and RNA silencing in plant viral resistance. Current Opinion in Virology, 42, 1–7. - PubMed

Publication types

Supplementary concepts

LinkOut - more resources