. 2022 May;16(3):501-510.
doi: 10.1111/irv.12948. Epub 2021 Dec 27.

Spatial-temporal distribution and sequence diversity of group a human respiratory syncytial viruses in Kenya preceding the emergence of ON1 genotype

Affiliations

Spatial-temporal distribution and sequence diversity of group a human respiratory syncytial viruses in Kenya preceding the emergence of ON1 genotype

Julia Wangui et al. Influenza Other Respir Viruses. 2022 May.

Abstract

Background: Human respiratory syncytial virus (HRSV) is a major cause of severe viral acute respiratory illness and contributes significantly to severe pneumonia cases in Africa. Little is known about its spatial-temporal distribution as defined by its genetic diversity.

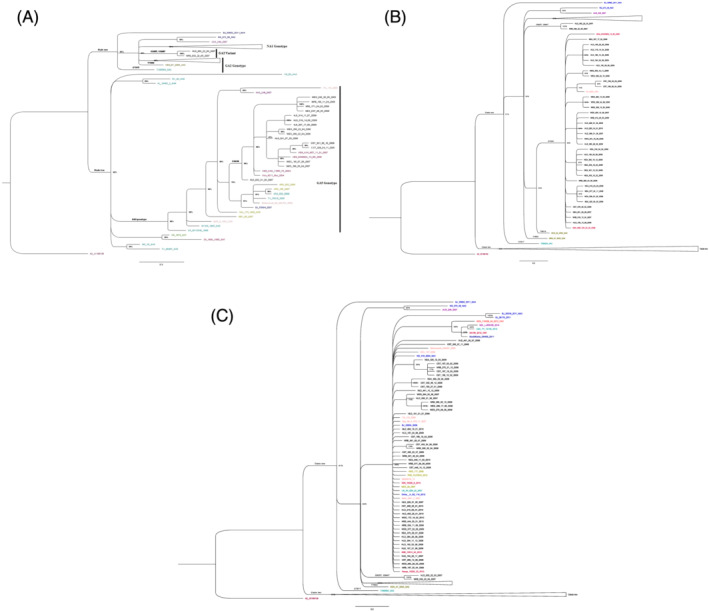
Methods: A retrospective study conducted utilizing archived nasopharyngeal specimens from patients attending outpatient clinics in hospitals located in five demographically and climatically distinct regions of Kenya; Coast, Western, Highlands, Eastern and Nairobi. The viral total RNA was extracted and tested using multiplex real time RT-PCR (reverse transcriptase polymerase chain reaction). A segment of the G-gene was amplified using one-step RT-PCR and sequenced by Sanger di-deoxy method. Bayesian analysis of phylogeny was utilized and subsequently median joining methods for haplotype network reconstruction.

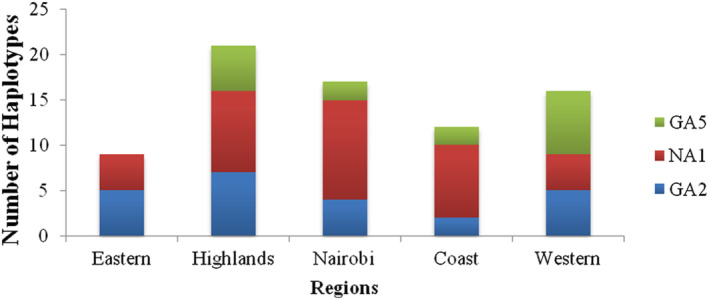
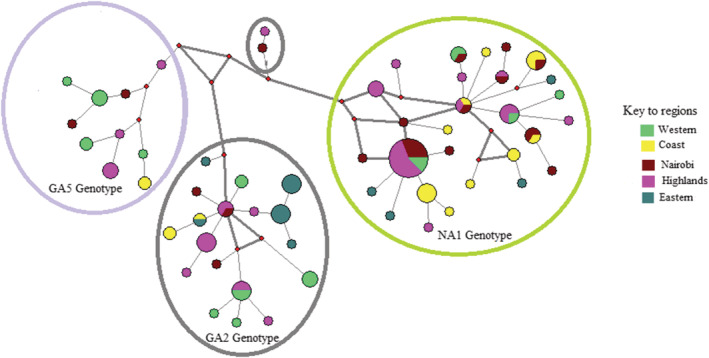
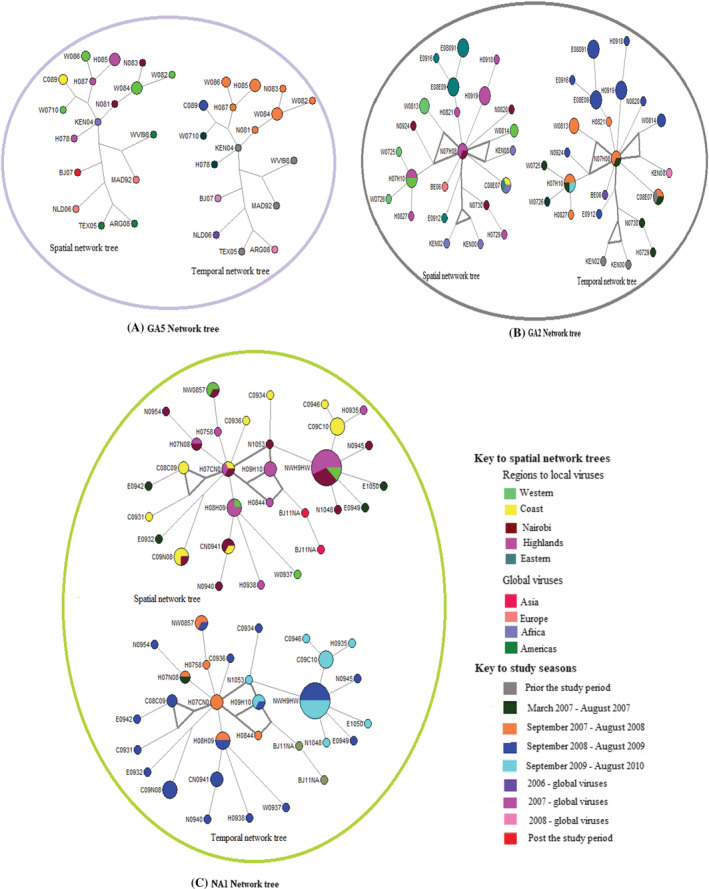
Results: Three genotypes of HRSVA were detected; GA5 (14.0%), GA2 (33.1%), and NA1 (52.9%). HRSVA prevalence varied by location from 33% to 13.2% in the Highlands and the Eastern regions respectively. The mean nucleotide diversity (Pi[π]) varied by genotype: highest of 0.018 for GA5 and lowest of 0.005 for NA1. A total of 58 haplotypes were identified (GA5 10; GA2 20; NA1 28). These haplotypes were introduced into the population locally by single haplotypes and additional subsidiary seeds amongst the GA2 and the NA1 haplotypes.

Conclusions: HRSVA was found across all the regions throughout the study period and comprised three genotypes; GA5, GA2, and NA1 genotypes. The genotypes were disproportionately distributed across the regions with GA5 gradually increasing toward the Western zones and decreasing toward the Eastern zones of the country.

Keywords: HRSVA; genotypes; haplotypes; regions.


Conflict of interest statement

The authors declare that they have no competing interests.

Figures

FIGURE 1
FIGURE 1
(A) Phylogenetic tree based on the 2nd hypervariable region of the G‐gene from samples collected from ILI presentations to eight health facilities across Kenya 2007–2010. This tree was constructed using the Bayesian method with a scale of 0.3 and the clade credibility of above 60%. Due to the large data size (178 sequences), we clustered our local sequences into their haplotypes (refer to methods) and obtained a representation of 97 of 121 local sequences for clear visibility on the phylogenetic tree. The tree was rooted on the prototype A2, accession number JX198138. Colored tips represent the global sequences accessed from Genbank. Clade two sequences belonging to genotypes GA3‐7 represented in detail while the branches in clade one has been collapsed (NA1‐4), GA2 and ON1 genotypes (see Figure 1B,C). (B) Clade one of the phylogenetic tree showing the GA2 genotype sequences. Colored tips belong to the global sequences. Among the GA2 sequences, there is an additional cluster (clade credibility of 100%) comprising of two sequences that were not previously identified. We categorized these sequences as variants of the GA2 genotype. (C) Clade one of the phylogenetic tree showing sequences in the NA1‐4 and ON1 genotypes. Colored tips comprise of the global sequences. All our local sequences were within the NA1 genotype
FIGURE 2
FIGURE 2
Spatial distribution of the local haplotypes: The graph represents the distribution of haplotypes in each region per genotype
FIGURE 3
FIGURE 3
Spatial interaction of the Kenyan haplotypes identified through sentinel hospital outpatient surveillance from 2007–2010: Median‐joining network tree displaying the interrelationship of haplotypes per genotype across five regions. Each tree node (circle) represents a haplotype, color coded as per the region where it was detected. A multi‐colored node represents a haplotype found in multiple regions. Node size is directly proportional to the number of viruses in each haplotype. The tree displays haplotype interlinkage within and across regional boundaries. The branch length between haplotypes is not proportional to the number of mutations detected between the haplotypes. The four‐color coded circles represent the genotypes. The two haplotypes in the smaller circle belong to the GA2 variant viruses
FIGURE 4
FIGURE 4
Seeding of haplotypes. These median joining networks illustrate the introduction patterns amongst 130 haplotypes. The color coding in the spatial network trees represent the regions for the haplotypes. The global haplotypes are as follows: Americas (ARGE08, TEXAS0, and WESTVI), Europe (NETHER, MAD92, and BE06), Asia (BJ07 and BJ11NA) and Africa (KEN04, KEN02, KEN08, and KEN00). The color‐coding in the temporal network trees represent the period prior, during and post the study. There are different color codes for the local and global haplotypes representing the four seasons of the study and the year of collection for the global haplotypes

Similar articles

Cited by

References

    1. Nair H, Nokes DJ, Gessner BD, et al. Global Burden of Acute Lower Respiratory Infections Due to Respiratory Syncytial Virus in Young Children: A Systematic Review and Meta‐Analysis. Lancet. 2010;375(9725):1545‐1555. - PMC - PubMed
    1. Cane PA. Molecular Epidemiology of Respiratory Syncytial Virus. Rev Med Virol. 2001;11(2):103‐116. - PubMed
    1. Nokes DJ, Ngama M, Bett A, et al. Incidence and severity of respiratory syncytial virus pneumonia in rural kenyan children identified through hospital surveillance. Clin Infect Dis. 2009;49(9):1341‐1349. - PMC - PubMed
    1. Peret TC, Hall CB, Schnabel KC, Golub JA, Anderson LJ. Circulation patterns of genetically distinct group a and b strains of human respiratory syncytial virus in a community. J Gen Virol. 1998;79(Pt 9):2221‐2229. - PubMed
    1. Trento A, Abrego L, Rodriguez‐Fernandez R, et al. Conservation of G‐Protein Epitopes in Respiratory Syncytial Virus (Group a) Despite Broad Genetic Diversity: Is Antibody Selection Involved in Virus Evolution? J Virol. 2015;89(15):7776‐7785. - PMC - PubMed

Publication types