. 2022 Jan 17;23(1):bbab507.
doi: 10.1093/bib/bbab507.

Computationally prioritized drugs inhibit SARS-CoV-2 infection and syncytia formation

Affiliations

Computationally prioritized drugs inhibit SARS-CoV-2 infection and syncytia formation

Angela Serra et al. Brief Bioinform. .

Abstract

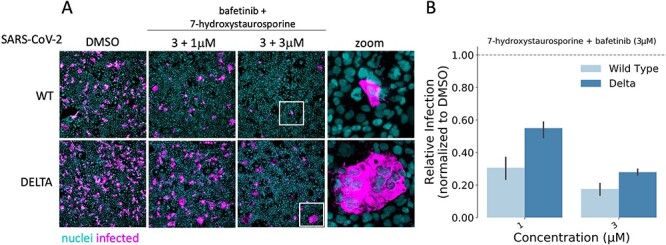
The pharmacological arsenal against the COVID-19 pandemic is largely based on generic anti-inflammatory strategies or poorly scalable solutions. Moreover, as the ongoing vaccination campaign is rolling slower than wished, affordable and effective therapeutics are needed. To this end, there is increasing attention toward computational methods for drug repositioning and de novo drug design. Here, multiple data-driven computational approaches are systematically integrated to perform a virtual screening and prioritize candidate drugs for the treatment of COVID-19. From the list of prioritized drugs, a subset of representative candidates to test in human cells is selected. Two compounds, 7-hydroxystaurosporine and bafetinib, show synergistic antiviral effects in vitro and strongly inhibit viral-induced syncytia formation. Moreover, since existing drug repositioning methods provide limited usable information for de novo drug design, the relevant chemical substructures of the identified drugs are extracted to provide a chemical vocabulary that may help to design new effective drugs.

Keywords: 7-hydroxystaurosporine; COVID-19; SARS-CoV-2; bafetinib; delta variant; drug design; drug repositioning; kinase inhibitors; syncytia; virtual screening.


Figures

Figure 1
Figure 1
Proposed methodology. We integrated multiple bioinformatics and cheminformatics methods to prioritize drugs for the treatment of COVID-19 (AE). Our framework consists of four complementary bioinformatics approaches, including differential expression analysis (A), dynamic dose-dependent MOA (B), connectivity mapping (C) and network-based drug targeting (D) as well as a QSAR-based cheminformatics method (E). We further complemented our set of candidate chemical substructures with those extracted from active drugs as experimentally tested in multiple studies (F). The four bioinformatics approaches are merged to find a robust rank of the drugs (G). From the rank produced by the bioinformatic approaches, the QSAR method and from the list of screened drugs, three lists of chemical substructures are identified (H1H3) with the aim of increasing the robustness of the predictions as well as to generate knowledge readily usable in the context of de novo drug development. Eventually, we exploited the set of candidate chemical substructures by performing a virtual screening analysis of the DrugBank database (I).
Figure 2
Figure 2
(A) Consensus strategy to identify relevant chemical substructure, using bioinformatics and cheminformatics methods as well as experimental results from published literature. (B) The suggested approach allows reducing the number of experimental tests: the whole DrugBank database was filtered to less than 800 relevant drugs and in vitro testing was performed on 23 candidates. (C) Graphical representation of the prioritized drugs. The shade blue represents the number of chemical substructures identified in (A), present in the drugs. The 23 selected compounds are shown in red. They were selected among the drugs sharing the most relevant substructure as well as satisfying practical logistic criteria. Of the 23 drugs, the two highlighted in green have been experimentally identified as active. (D) Pharmacological characterization and description of known association with COVID-19 of the 23 tested drugs. In silico refers to drugs derived from in silico studies, whereas proposed refers to drugs suggested for their potential therapeutic role in literature.
Figure 3
Figure 3
(A) Percentage of infected cells after drug treatments normalized by the median of the DMSO control. Each drug was added 45 min before infection and infected cells fixed 16 h later; red asterisks show significant P-values (<0.05) for the one-tailed t-test between each treatment and the DMSO. (B) Combined effect of 7-hydroxystaurosporine and bafetinib added 2 hbi at indicated concentrations. Cells fixed 16 hpi. (C) Combined effect of bafetinib and 7-hydroxystaurosporine added 2 hbi at indicated concentrations. Cells fixed 16 hpi.
Figure 4
Figure 4
(A) Representative fluorescence images of Caco2-ACE2 cells treated with bafetinib, 7-hydroxystaurosporine and their combinations 2 hbi. Cells fixed 16 hpi; cyan = nuclei, magenta = infected cells. (B) Relative infection quantification of experiment in (A); values normalized to the median of DMSO controls. All values represent the averages of three experiments. Error bars indicate the SD. (C) Representative fluorescence images of Caco2-ACE2 cells treated with camostat. (D) Relative infection quantification of experiment in (C).
Figure 5
Figure 5
Concentration–response curve analysis. The BMD values, their lower (BMDL) and upper (BMDU) bounds and the IC50 values were computed for bafetinib (A), 7-hydroxystaurosporine (B) and their combinations (CD). The y-axes show the infection rate normalized by the one measured in DMSO. Bafetinib and 7-hydroxystaurosporine were tested at 0.09, 0.9, 3 and 9 μM, whereas in combination they were tested at 0.9, 3 and 9 μM. The BMD, BMDL, BMDU and IC50 in (C) refer to the experiments performed where 7-hydroxystaurosporine was combined with a fixed concentration (3 μM), whereas bafetinib concentration varied.
Figure 6
Figure 6
Relative cell viability in HEK-293 T-AT (A) and Caco2-ACE2 (B) cells normalized by the median of the DMSO. Cells were treated with different concentrations of 7-hydroxystaurosporine and its combination with bafetinib. Lysis buffer was also included as positive controls. All values represent the averages of four replicates. Error bars indicate the SD. Lower values of relative cell viability indicate cytotoxicity.
Figure 7
Figure 7
7-Hydroxystaurosporine and bafetinib inhibit virus-induced syncytia. (A) Representative fluorescence images of HEK-293 T-AT cells treated with indicated drugs 1 h before infection. Cells fixed 16 hpi; cyan = nuclei, magenta = infected cells. Zoomed areas from each image are indicated by white boxes. (B) Quantification of cell size and nuclear content from the experiment in (A); values normalized to the median of DMSO controls. All values represent the averages of three experiments. Error bars indicate the SD. Red asterisks show significant P-values (<0.05) for the one-tailed t-test between each treatment and the DMSO.
Figure 8
Figure 8
7-Hydroxystaurosporine and bafetinib inhibit delta variant infection. (A) Representative fluorescence images of Caco2-ACE2 cells treated with the combination of bafetinib and 7-hydroxystaurosporine 30 min before infection with WT and the delta variant. Bafetinib concentration was fixed to 3 μM, whereas 7-hydroxystaurosporine varied as 1 μM and 3 μM; cyan = nuclei, magenta = infected cells. Zoomed areas from each image are indicated by white boxes. (B) Quantification of relative infection from the experiment in (A); values normalized to the median of DMSO controls. All values represent the averages of three replicates. Error bars indicate the SD.
Figure 9
Figure 9
Structural comparison between 7-hydroxystaurosporine and bafetinib. (A) 2D structures of 7-hydroxystaurosporine (left) and bafetinib (right); the conjugated π-bond system is highlighted in red. (B) 3D structures of 7-hydroxystaurosporine (left) and bafetinib (right). (C) Front view and (D) side view of 7-hydroxystaurosporine and bafetinib 3D structural overlay with (right) and without (left) solvent accessible surface. Color code for (B), (C) and (D): carbon atoms and solvent-accessible surfaces are shown in lilac and orange for 7-hydroxystaurosporine and bafetinib, respectively; oxygen atoms in red; nitrogen atoms in blue; fluorine atoms in cyan and hydrogen atoms in white.

References

    1. Thanh Le T, Andreadakis Z, Kumar A, et al. The COVID-19 vaccine development landscape. Nat Rev Drug Discov 2020;19:305–6. - PubMed
    1. Deb P, Molla MMA, Rahman KMS-U. An update to monoclonal antibody as therapeutic option against COVID-19. Biosaf Health 2021;3:87–91. - PMC - PubMed
    1. Jaworski JP. Neutralizing monoclonal antibodies for COVID-19 treatment and prevention. Biomed J 2020;44(1):7–17. - PMC - PubMed
    1. Matricardi PM, Dal Negro RW, Nisini R. The first, holistic immunological model of COVID-19: implications for prevention, diagnosis, and public health measures. Pediatr Allergy Immunol 2020;31:454–70. - PMC - PubMed
    1. Zhao M-M, Yang W-L, Yang F-Y, et al. Cathepsin L plays a key role in SARS-CoV-2 infection in humans and humanized mice and is a promising target for new drug development. Signal Transduct Target Ther 2021;6:134. - PMC - PubMed

Publication types