. 2022 Jun;74(6):927-933.
doi: 10.1002/art.42058. Epub 2022 Mar 29.

Rituximab Impairs B Cell Response But Not T Cell Response to COVID-19 Vaccine in Autoimmune Diseases

Affiliations

Rituximab Impairs B Cell Response But Not T Cell Response to COVID-19 Vaccine in Autoimmune Diseases

Samuel Bitoun et al. Arthritis Rheumatol. 2022 Jun.

Abstract

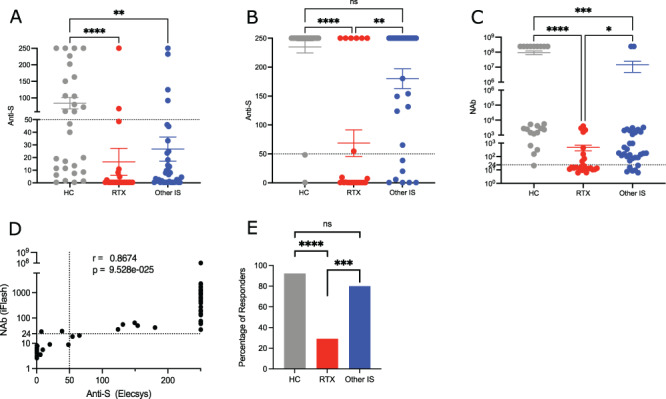
Objective: Antibody response to the messenger RNA (mRNA) COVID-19 vaccine has been shown to be diminished in rituximab (RTX)-treated patients. We undertook this study to compare humoral and T cell responses between healthy controls, patients with autoimmune diseases treated with RTX, and those treated with other immunosuppressants, all of whom had been vaccinated with 2 doses of the mRNA COVID-19 vaccine.

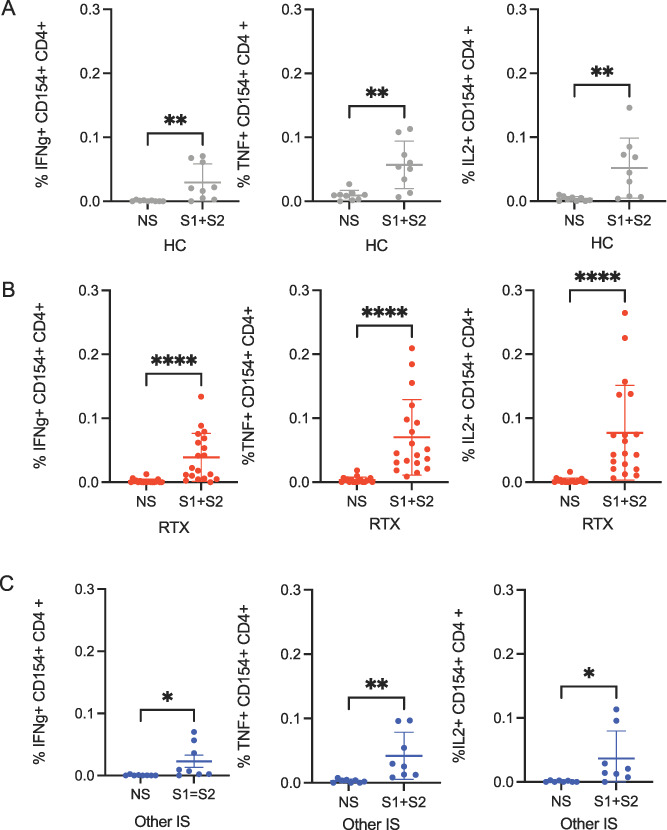
Methods: We performed anti-spike IgG and neutralization assays just before and 28 days after the second BNT162b2 (Pfizer-BioNTech) vaccine dose. The specific T cell response was assessed in activated CD4 and CD8 T cells using intracellular flow cytometry staining of cytokines (interferon-γ, tumor necrosis factor, and interleukin-2) after stimulation with SARS-CoV-2 spike peptide pools.

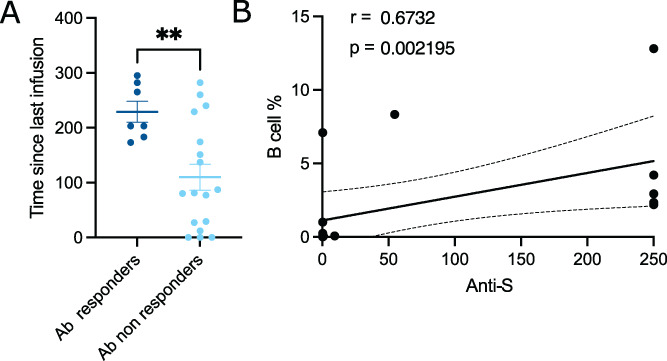
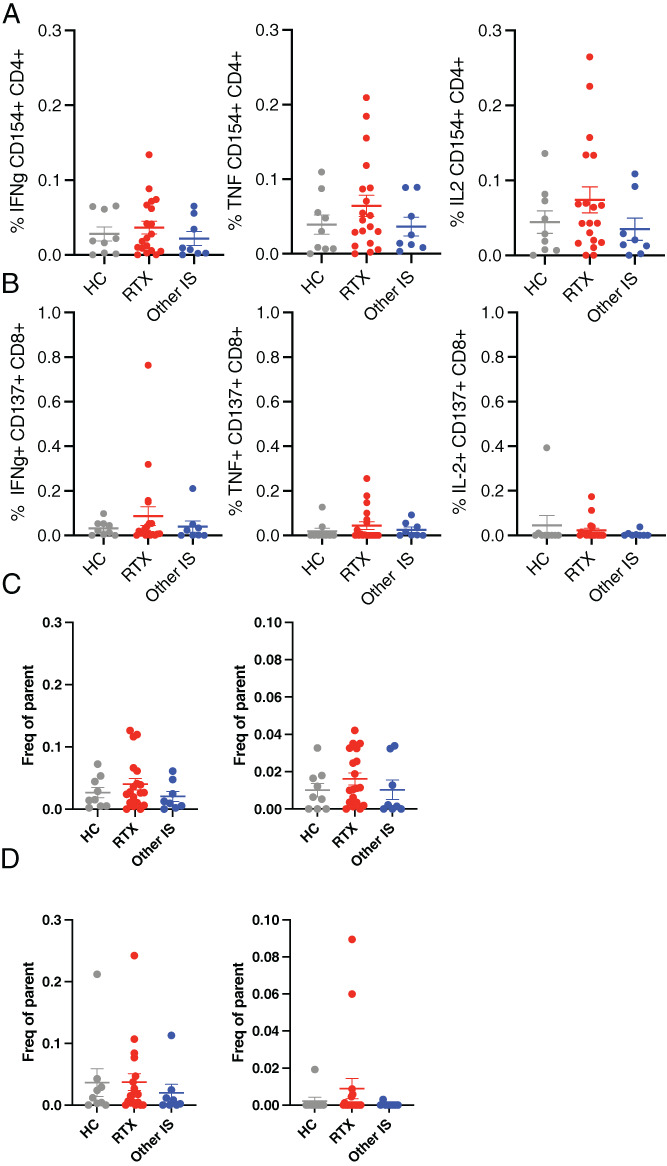
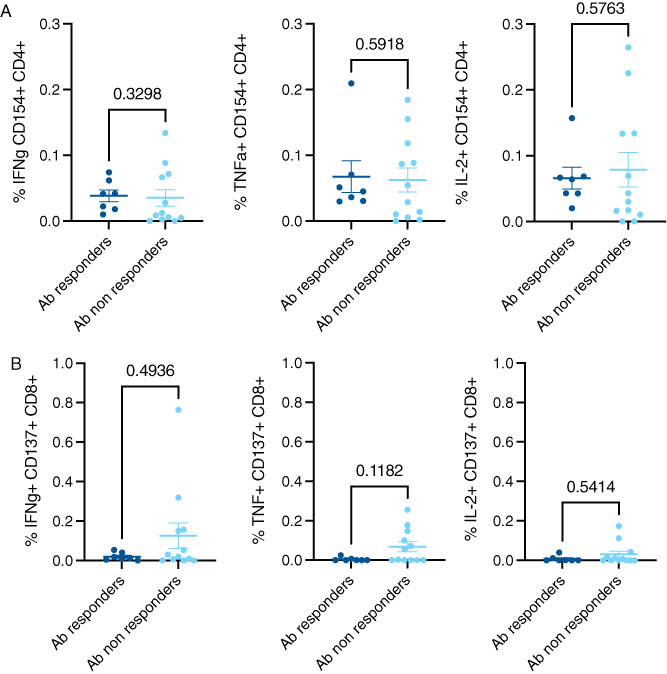
Results: A lower proportion of responders with neutralizing antibodies to the vaccine was observed in the RTX group (29%; n = 24) compared to the other immunosuppressants group (80%; n = 35) (P = 0.0001) and the healthy control group (92%; n = 26) (P < 0.0001). No patients treated with RTX in the last 6 months showed a response. Time since last infusion was the main factor influencing humoral response in RTX-treated patients. The functional CD4 and CD8 cellular responses to SARS-CoV-2 peptides for each single cytokine or polyfunctionality were not different in the RTX group compared to the other immunosuppressants group or the control group. In RTX-treated patients, the T cell response was not different between patients with and those without a humoral response.

Conclusion: RTX induced a diminished antibody response to the mRNA COVID-19 vaccine, but the functional T cell response was not altered compared to healthy controls and autoimmune disease patients treated with other immunosuppressants. Further work is needed to assess the clinical protection granted by a functionally active T cell response in the absence of an anti-spike antibody response.


Figures

Figure 1
Figure 1
Humoral response after mRNA vaccination against COVID‐19. A and B, Anti‐spike (anti‐S) antibody response on day 28 (n = 90) (A) and day 56 (n = 87) (B) after the first injection with the BNT162b2 (Pfizer‐BioNTech) vaccine, in healthy controls (HC), rituximab (RTX)–treated patients, and patients treated with other immunosuppressants (IS). C, Neutralizing antibody (Nab) response on day 56 after the first injection with the BNT162b2 vaccine (n = 80). D, Correlation between anti‐spike antibody and neutralizing antibody titers that were used to set the threshold of response. E, Percentages of responders, defined as subjects with an anti‐spike antibody level of ≥50 units/ml (n = 78). In A–C, symbols represent individual subjects; bars show the mean ± SD. In A–D, the dotted line indicates the cutoff value. * = P < 0.05; ** = P < 0.01; *** = P < 0.001; **** = P < 0.0001. NS = not significant. Color figure can be viewed in the online issue, which is available at http://onlinelibrary.wiley.com/doi/10.1002/art.42058/abstract.
Figure 2
Figure 2
Factors influencing the humoral response in the RTX‐treated group. A, Time between the last infusion of RTX and the first vaccination in responders and nonresponders. Symbols represent individual subjects; bars show the mean ± SD. B, Correlation between percentage of B cells and anti‐spike antibody (Ab) response (n = 24). ** = P < 0.01. See Figure 1 for other definitions. Color figure can be viewed in the online issue, which is available at http://onlinelibrary.wiley.com/doi/10.1002/art.42058/abstract.
Figure 3
Figure 3
Comparison of unstimulated (NS) and spike peptide–stimulated cytokine secretion in CD4 T cells. In peripheral blood mononuclear cells from healthy controls (HC) (n = 9) (A), rituximab (RTX)–treated patients (n = 19) (B), and patients treated with other immunosuppressants (IS) (n = 8) (C), the T cell response was measured as the percentage of activated CD154+ T cells secreting cytokines (interferon‐γ [IFNγ], tumor necrosis factor [TNF], and interleukin‐2 [IL‐2]) following stimulation with spike peptides (S1 + S2) or in unstimulated conditions. Values in the stimulated samples are the sum of the percentages of cells stimulated by the S1 and S2 pools. Symbols represent individual subjects; bars show the mean ± SD. * = P < 0.05; ** = P < 0.01; **** = P < 0.0001.
Figure 4
Figure 4
Comparison of specific CD4 and CD8 T cell responses between groups. A, Percentage of activated CD154+ cytokine‐secreting cells among CD4 T cells. B, Percentage of activated CD137+ cytokine‐secreting cells among CD8 T cells, minus the percentage among CD8 T cells in the unstimulated condition. Percentages in the stimulated samples are the sum of the percentages of cells stimulated by the S1 and S2 pools. C and D, Percentages of activated CD154+ cells among CD4 T cells (C) and activated CD137+ cells among CD8 T cells (D) that secreted 2 cytokines (left) or 3 cytokines (right) at the same time (polyfunctionality). Symbols represent individual subjects; bars show the mean ± SD. No P values obtained by Kruskal‐Wallis test were significant. See Figure 3 for definitions.
Figure 5
Figure 5
Relationship between cellular and humoral response in RTX‐treated patients. Comparisons of percentages of activated CD154+ cytokine‐secreting CD4 T cells (A) and activated CD137+ cytokine‐secreting CD8 T cells (B) between antibody (Ab) responders and nonresponders in the RTX‐treated group (n = 19) are shown. Symbols represent individual subjects; bars show the mean ± SD. P values show comparisons between indicated groups. See Figure 3 for other definitions. Color figure can be viewed in the online issue, which is available at http://onlinelibrary.wiley.com/doi/10.1002/art.42058/abstract.

Comment in

Similar articles

Cited by

References

    1. Strangfeld A, Schäfer M, Gianfrancesco MA, Lawson‐Tovey S, Liew JW, Ljung L, et al. Factors associated with COVID‐19‐related death in people with rheumatic diseases: results from the COVID‐19 Global Rheumatology Alliance physician‐reported registry. Ann Rheum Dis 2021;80:930–42. - PMC - PubMed
    1. Furer V, Eviatar T, Zisman D, Peleg H, Paran D, Levartovsky D, et al. Immunogenicity and safety of the BNT162b2 mRNA COVID‐19 vaccine in adult patients with autoimmune inflammatory rheumatic diseases and in the general population: a multicentre study. Ann Rheum Dis 2021;80:1330–8. - PubMed
    1. Spiera R, Jinich S, Jannat‐Khah D. Rituximab, but not other antirheumatic therapies, is associated with impaired serological response to SARS‐CoV‐2 vaccination in patients with rheumatic diseases. Ann Rheum Dis 2021;80:1357–9. - PubMed
    1. Mrak D, Tobudic S, Koblischke M, Graninger M, Radner H, Sieghart D, et al. SARS‐CoV‐2 vaccination in rituximab‐treated patients: B cells promote humoral immune responses in the presence of T‐cell‐mediated immunity. Ann Rheum Dis 2021;80:1345–50. - PubMed
    1. Izmirly PM, Kim MY, Samanovic M, Fernandez‐Ruiz R, Ohana S, Deonaraine KK, et al. Evaluation of immune response and disease status in systemic lupus erythematosus patients following SARS–CoV‐2 vaccination. Arthritis Rheumatol 2022;74:284–94. - PMC - PubMed

Publication types

MeSH terms