. 2022 Jun;74(6):934-947.
doi: 10.1002/art.42060. Epub 2022 Apr 17.

B Cell Numbers Predict Humoral and Cellular Response Upon SARS-CoV-2 Vaccination Among Patients Treated With Rituximab

Affiliations

B Cell Numbers Predict Humoral and Cellular Response Upon SARS-CoV-2 Vaccination Among Patients Treated With Rituximab

Ana-Luisa Stefanski et al. Arthritis Rheumatol. 2022 Jun.

Abstract

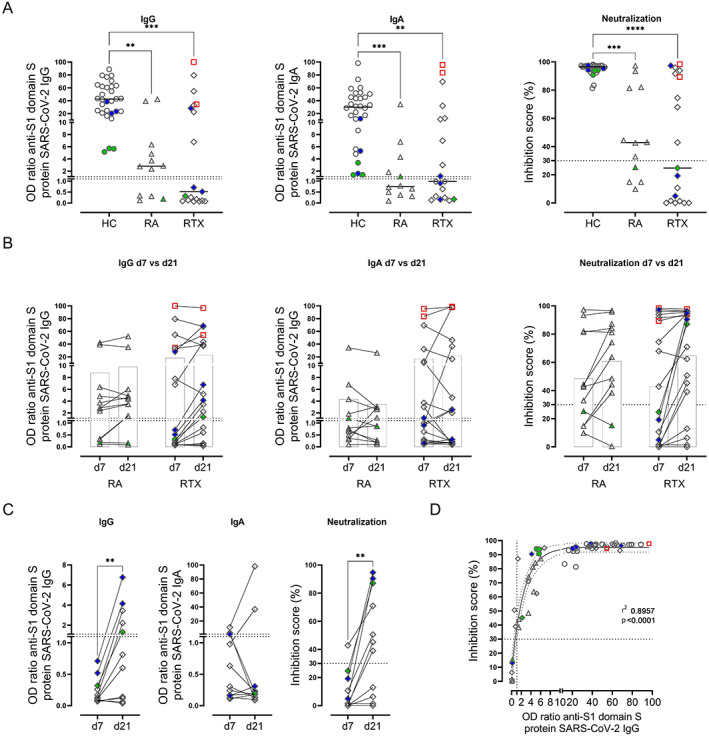
Objective: Patients with autoimmune inflammatory rheumatic diseases receiving rituximab (RTX) therapy are at higher risk of poor COVID-19 outcomes and show substantially impaired humoral immune response to anti-SARS-CoV-2 vaccine. However, the complex relationship between antigen-specific B cells and T cells and the level of B cell repopulation necessary to achieve anti-vaccine responses remain largely unknown.

Methods: Antibody responses to SARS-CoV-2 vaccines and induction of antigen-specific B and CD4/CD8 T cell subsets were studied in 19 patients with rheumatoid arthritis (RA) or antineutrophil cytoplasmic antibody-associated vasculitis receiving RTX, 12 patients with RA receiving other therapies, and 30 healthy controls after SARS-CoV-2 vaccination with either messenger RNA or vector-based vaccines.

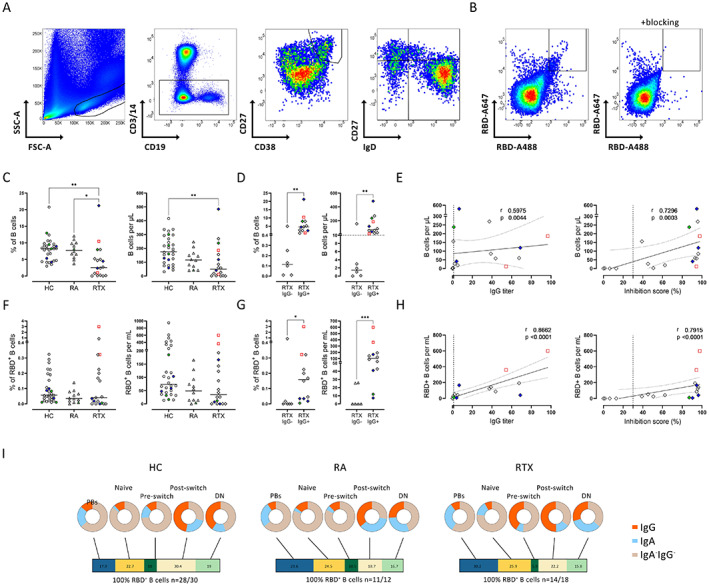
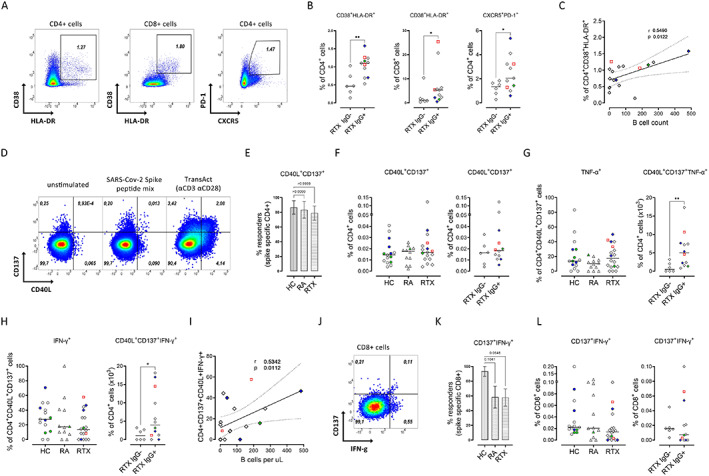
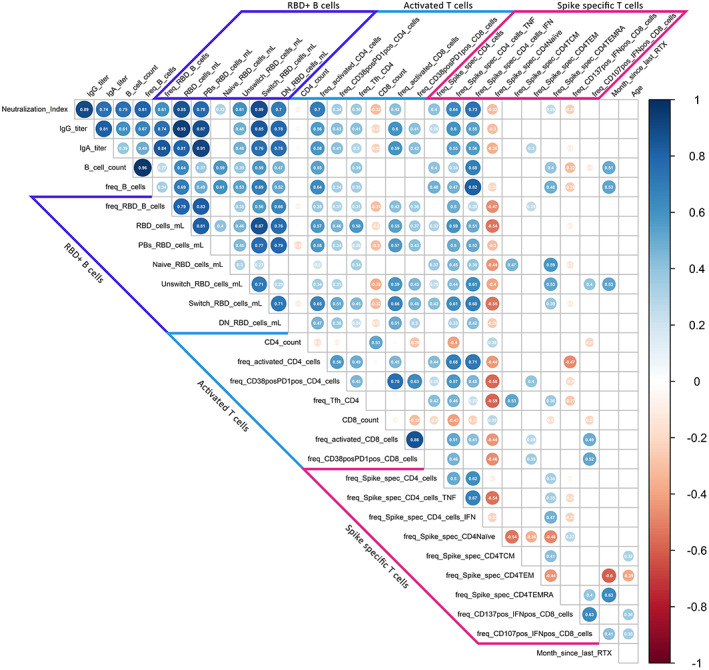
Results: A minimum of 10 B cells per microliter (0.4% of lymphocytes) in the peripheral circulation appeared to be required for RTX-treated patients to mount seroconversion to anti-S1 IgG upon SARS-CoV-2 vaccination. RTX-treated patients who lacked IgG seroconversion showed reduced receptor-binding domain-positive B cells (P = 0.0005), a lower frequency of Tfh-like cells (P = 0.0481), as well as fewer activated CD4 (P = 0.0036) and CD8 T cells (P = 0.0308) compared to RTX-treated patients who achieved IgG seroconversion. Functionally relevant B cell depletion resulted in impaired interferon-γ secretion by spike-specific CD4 T cells (P = 0.0112, r = 0.5342). In contrast, antigen-specific CD8 T cells were reduced in both RA patients and RTX-treated patients, independently of IgG formation.

Conclusion: In RTX-treated patients, a minimum of 10 B cells per microliter in the peripheral circulation is a candidate biomarker for a high likelihood of an appropriate cellular and humoral response after SARS-CoV-2 vaccination. Mechanistically, the data emphasize the crucial role of costimulatory B cell functions for the proper induction of CD4 responses propagating vaccine-specific B cell and plasma cell differentiation.


Figures

Figure 1
Figure 1
Reduced and delayed humoral immune response to SARS–CoV‐2 vaccination in patients with rheumatoid arthritis (RA) and patients treated with rituximab (RTX). A, Anti‐S1 IgG antibody titer, anti‐S1 IgA antibody titer, and inhibition score indicating antibody neutralization, determined by enzyme‐linked immunosorbent assay (ELISA) for spike protein S1 IgG, ELISA for spike protein S1 IgA, and blocking ELISA for virus neutralization, respectively, in peripheral blood samples obtained from healthy controls (HCs; n = 30), RA controls (n = 12), and RTX‐treated patients (n = 19) on day 7 after the second SARS–CoV‐2 vaccination. Symbols represent individual subjects; horizontal lines show the mean. B, Anti‐S1 IgG antibody titer, anti‐S1 IgA antibody titer, and antibody neutralization in serum samples obtained from 12 RA patients and 19 RTX‐treated patients on day 7 after (d7) and 3–4 weeks after (d21) the second vaccination. Linked symbols represent individual subjects; open bars show the mean. Two‐way analysis of variance with Šidák's post test was used for comparisons. The interaction effect was not significant. C, Delayed IgG response on day 21 in 5 of the 11 RTX‐treated patients who did not initially show seroconversion (on day 7 after the second vaccination). Linked symbols represent individual subjects. D, Significant correlation, determined by Spearman's correlation test, between IgG titers and inhibition score of antibody neutralization among RTX‐treated patients. Solid and dotted curved lines show the sigmoidal model with 95% confidence bands. Red indicates previously infected subjects; green indicates subjects who were vaccinated twice with ChAdOx1; blue indicates subjects who received 1 dose of ChAdOx1 followed by a heterologous vaccination with 1 dose of BNT162b2. Dotted lines indicate the upper limit of normal. ** = P < 0.01; *** = P < 0.001; **** = P < 0.0001, by Kruskal‐Wallis with Dunn's post test in A, by Mann‐Whitney test in C.
Figure 2
Figure 2
Reduction in the frequencies and numbers of total B cells and antigen‐specific B cells in RTX‐treated patients, and correlation of B cell numbers with humoral immune response. A, Representative flow cytometry plots of receptor‐binding domain (RBD)–positive B cells, plasmablasts (PBs), and non‐plasmablast B cell subsets based on IgD/CD27 classification. B, Representative flow cytometry plots of RBD+ B cells before and after blocking with unlabeled RBD. C and D, Frequency and absolute number of CD19+ B cells in healthy controls, RA controls, and RTX‐treated patients (C) and in IgG+ RTX‐treated patients compared to IgG− RTX‐treated patients (D) on day 7 after the second SARS–CoV‐2 vaccination. Dotted line in D indicates the minimum number of B cells needed to mount seroconversion to anti‐S1 IgG. E, Correlations between the number of CD19+ B cells and humoral immune response, as indicated by IgG formation and neutralizing capacity, in RTX‐treated patients. F and G, Frequency and absolute number of RBD+ cells among total CD19+ B cells in healthy controls, RA controls, and RTX‐treated patients (F) and in IgG+ RTX‐treated patients compared to IgG− RTX‐treated patients (G) on day 7 after the second vaccination. H, Correlations between the number of RBD+ B cells and humoral immune response, as indicated by IgG formation and neutralizing capacity, in RTX‐treated patients. I, Frequencies of RBD+ B cell subsets (bars) and Ig isotype distribution (pie charts) in healthy controls, RA controls, and RTX‐treated patients on day 7 after the second vaccination. DN = double negative. In C, D, F, and G, symbols represent individual subjects; horizontal lines show the mean. In E and H, vertical lines indicate the upper limit of normal; dotted lines show the 95% confidence interval. Red indicates previously infected subjects; green indicates subjects who were vaccinated twice with ChAdOx1; blue indicates subjects who received 1 dose of ChAdOx1 followed by a heterologous vaccination with 1 dose of BNT162b2. * = P < 0.05; ** = P < 0.01; *** = P < 0.001. See Figure 1 for other definitions.
Figure 3
Figure 3
Correlation of the frequencies of activated CD4 T cells and interferon‐γ (IFNγ)–positive antigen‐specific CD4+ T cells with absolute B cell counts. A, Representative flow cytometry plots of activated CD4 and CD8 T cells and Tfh‐like CD4 T cells. Values are the percent of cells. B, Significant decrease in the frequencies of the indicated cell types in RTX‐treated patients who did not respond to SARS–CoV‐2 vaccination (RTX IgG−). C, Correlation of the frequency of activated CD4 T cells with B cell count in RTX‐treated patients. D, Representative flow cytometry plots of antigen‐specific CD4 T cells (CD137+CD40L+) in peripheral blood mononuclear cells from a healthy control, left unstimulated, stimulated with SARS–Cov‐2 spike peptide mix, or stimulated with TransAct. Values are the percent of cells. EG, Responder rate (E) and frequency of antigen‐specific CD4 T cells (F) after stimulation with B.1.1.7 SARS–CoV‐2 spike peptide mix, and production of tumor necrosis factor (TNF)–positive (G) and IFNγ+ (H) spike‐specific CD4+ T cells in healthy controls (n = 15), RA controls (n = 12), and RTX‐treated patients (n = 18), and in IgG+ RTX‐treated patients (n = 12) and IgG− RTX‐treated patients (n = 6). I, Correlation of the frequency of IFNγ+ antigen‐specific CD4 T cells with B cell count in RTX‐treated patients. J, Representative flow cytometry plot of antigen‐specific CD8 T cells (CD137+IFNγ+). K and L, Responder rate (K) and frequency of antigen‐specific CD8+ T cells (L) after stimulation with B.1.1.7 SARS–CoV‐2 spike peptide mix. In B, FH, and L, symbols represent individual subjects; horizontal lines show the mean. In C and I, dotted lines show the 95% confidence interval. In E and K, bars show the mean ± SD. Red indicates previously infected subjects; green indicates subjects who were vaccinated twice with ChAdOx1; blue indicates subjects who received 1 dose of ChAdOx1 followed by a heterologous vaccination with 1 dose of BNT162b2. * = P < 0.05, ** = P < 0.01. See Figure 1 for other definitions.
Figure 4
Figure 4
Correlation of humoral and cellular vaccine responses in rituximab (RTX)–treated patients. The Spearman's correlation matrix shows the relationships between humoral responses, receptor‐binding domain (RBD)–positive B cell subsets, activated CD4 and CD8 T cells, antigen‐specific CD4 and CD8 T cell response, month since last RTX dose, and demographic characteristics of the patients. A total of 17 RTX‐treated patients were included in the analysis (due to partial missing data for 2 patients). Red circles indicate negative correlations; blue circles indicate positive correlations. Size and color intensity indicate the strength of correlation. Values inside the circles are the correlation coefficient. Only correlations with P ≤ 0.05 are shown. PBs = plasmablasts; DN = double negative; TNF = tumor necrosis factor; IFN = interferon; TCM = central memory T cells; TEM = effector memory T cells; TEMRA = terminally differentiated effector memory T cells.
Figure 5
Figure 5
Diminished frequencies of follicular T and B cells in RTX‐treated patients, determined by single‐cell transcriptome and Cellular Indexing of Transcriptomes and Epitopes by Sequencing (CITE‐seq) analyses. A, Uniform Manifold Approximation and Projection (UMAP) clustering of peripheral blood CD27++CD38++ plasmablasts, CD27+ memory B cells, and T cells. Samples from 2 healthy controls (healthy donors [HDs]), 4 RA controls, and 5 RTX‐treated patients (3 responders [R] and 2 nonresponders [NR] to SARS–Cov‐2 vaccine) were isolated and sorted by fluorescence‐activated cell sorting for single‐cell sequencing. B, Relative expression levels of selected signature genes in the 15 identified clusters (total number of cells sequenced 38,038). Larger circles indicate higher expression. C, UMAP clustering of cells in samples from 2 healthy controls, 4 RA controls, 2 IgG− RTX‐treated patients (RTX nonresponders), and 3 IgG+ RTX‐treated patients (RTX responders) (top) and cluster frequency comparison for clusters 3 and 5 (bottom). Symbols represent individual subjects; bars show the mean. D, UMAP representation of the expression levels of CCR6, CXCR5, CD40LG, and PDCD1 in healthy controls, RA controls, and RTX‐treated nonresponders and responders. See Figure 1 for other definitions. Color figure can be viewed in the online issue, which is available at http://onlinelibrary.wiley.com/doi/10.1002/art.42060/abstract.

Comment in

References

    1. Hsu CY, Ko CH, Wang JL, Hsu TC, Lin CY. Comparing the burdens of opportunistic infections among patients with systemic rheumatic diseases: a nationally representative cohort study. Arthritis Res Ther 2019;21:211. - PMC - PubMed
    1. Furer V, Rondaan C, Heijstek M, van Assen S, Bijl M, Agmon‐Levin N, et al. Incidence and prevalence of vaccine preventable infections in adult patients with autoimmune inflammatory rheumatic diseases (AIIRD): a systemic literature review informing the 2019 update of the EULAR recommendations for vaccination in adult patients with AIIRD. RMD Open 2019;5:e001041. - PMC - PubMed
    1. Strangfeld A, Schäfer M, Gianfrancesco MA, Lawson‐Tovey S, Liew JW, Ljung L, et al. Factors associated with COVID‐19‐related death in people with rheumatic diseases: results from the COVID‐19 Global Rheumatology Alliance physician‐reported registry. Ann Rheum Dis 2021;80:930–42. - PMC - PubMed
    1. Jones JM, Faruqi AJ, Sullivan JK, Calabrese C, Calabrese LH. COVID‐19 outcomes in patients undergoing B cell depletion therapy and those with humoral immunodeficiency states: a scoping review. Pathog Immun 2021;6:76–103. - PMC - PubMed
    1. Polack FP, Thomas SJ, Kitchin N, Absalon J, Gurtman A, Lockhart S, et al. Safety and efficacy of the BNT162b2 mRNA Covid‐19 vaccine. N Engl J Med 2020;383:2603–15. - PMC - PubMed

Publication types