. 2022 Apr 26;106(4):710-729.
doi: 10.1093/biolre/ioab243.

Developing a reproducible protocol for culturing functional confluent monolayers of differentiated equine oviduct epithelial cells†

Affiliations

Developing a reproducible protocol for culturing functional confluent monolayers of differentiated equine oviduct epithelial cells†

Bart Leemans et al. Biol Reprod. .

Abstract

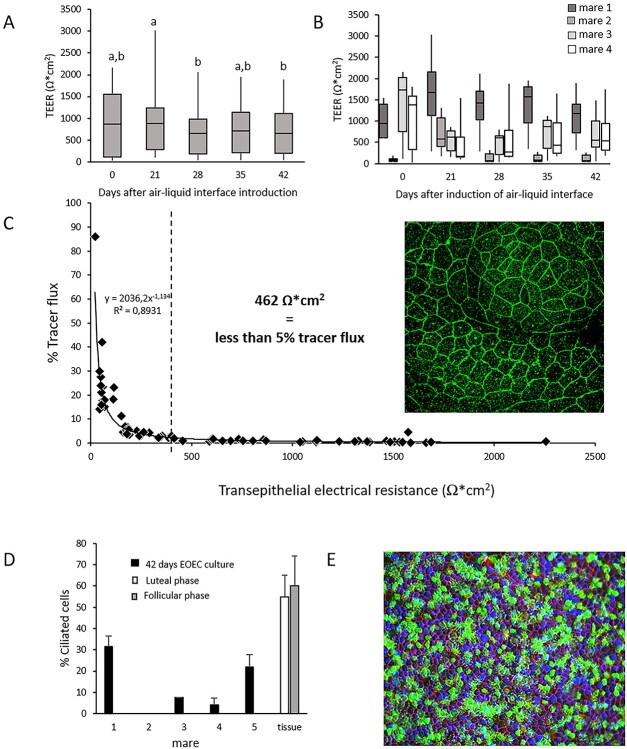
We describe the development of two methods for obtaining confluent monolayers of polarized, differentiated equine oviduct epithelial cells (EOEC) in Transwell inserts and microfluidic chips. EOECs from the ampulla were isolated post-mortem and seeded either (1) directly onto a microporous membrane as differentiated EOECs (direct seeding protocol) or (2) first cultured to a confluent de-differentiated monolayer in conventional wells, then trypsinized and seeded onto a microporous membrane (re-differentiation protocol). Maintenance or induction of EOEC differentiation in these systems was achieved by air-liquid interface introduction. Monolayers cultured via both protocols were characterized by columnar, cytokeratin 19-positive EOECs in Transwell inserts. However, only the re-differentiation protocol could be transferred successfully to the microfluidic chips. Integrity of the monolayers was confirmed by transepithelial resistance measurements, tracer flux, and the demonstration of an intimate network of tight junctions. Using the direct protocol, 28% of EOECs showed secondary cilia at the apical surface in a diffuse pattern. In contrast, re-differentiated polarized EOECs rarely showed secondary cilia in either culture system (>90% of the monolayers showed <1% ciliated EOECs). Occasionally (5-10%), re-differentiated monolayers with 11-27% EOECs with secondary cilia in a diffuse pattern were obtained. Additionally, nuclear progesterone receptor expression was found to be inhibited by simulated luteal phase hormone concentrations, and sperm binding to cilia was higher for re-differentiated EOEC monolayers exposed to estrogen-progesterone concentrations mimicking the follicular rather than luteal phase. Overall, a functional equine oviduct model was established with close morphological resemblance to in vivo oviduct epithelium.

Keywords: Transwell culture; cilia; equine; microfluidic chip; oviduct; primary cell culture.


Figures

Figure 1
Figure 1
Experimental set-up to establish confluent monolayers of differentiated EOECs on a microporous membrane in Transwell inserts. The re-differentiation of the cultured EOECs was stimulated by the introduction of an air–liquid interface at the apical surface of the monolayers. Two protocols were developed: (A) a direct seeding and (B) a re-differentiation protocol. Re-differentiation experiments were divided in the manuscript into a (a) proof-of-principle experiment and (b) systematic experiments for evaluation of critical factors (FBS: fetal bovine serum; TEER: transepithelial electrical resistance; TF: tracer flux assay; IF: immunofluorescent staining).
Figure 2
Figure 2
(A) Morphology of EOECs at the level of the ampulla, stained with HE (1000x). Black arrows indicate secondary ciliated EOECs and white stars demonstrate non-ciliated EOECs. The black arrow head shows an apical protrusion, while the white arrow head shows an apical protrusion with a nucleus. Sections of the equine oviduct ampulla after immunohistochemical staining for (B) acetylated alpha tubulin (400x) and (C) nuclear progesterone receptors (200x). Secondary cilia and nuclei positively stained for progesterone receptors show a distinct brown staining pattern. Inlays are negative control images.
Figure 3
Figure 3
Confirmation that isolated and cultured EOECs of ampullary origin express epithelial cell markers. Indirect immunofluorescent staining for cytokeratin 19 (1:50) was performed. Monolayers obtained after (A) 10 day culture in 6-well plates on glass cover slips, 21 days after air–liquid interface introduction after seeding of (B) differentiated and (C) de-differentiated EOECs, all stained positive for cytokeratin 19 (green, original magnification: 200–400x). (D) As a positive control, histological sections of the oviductal lumen at the level of the ampulla demonstrated that it is lined with cytokeratin 19 positive EOECs. Inlay images (A-D) are negative control samples. EOECs were also stained for DNA (blue) and the cytoskeleton (red: F-actin).
Figure 4
Figure 4
Monolayers of EOECs 21 days after air–liquid interface introduction to cells seeded directly into Transwell inserts (direct seeding protocol). (A) Representative overview image of a cultured monolayer of EOECs 21 days after air–liquid interface introduction (200x). EOECs were stained for markers of cilia (green: acetylated alpha tubulin), DNA (blue) and the cytoskeleton (red: F-actin). (B) A z-projection of a typical monolayer demonstrated clear presence of secondary cilia (green: acetylated α-tubulin) and a columnar epithelial cell phenotype (red: F-actin; blue: DNA; original magnification, 945x). (C) TEER measurements (mean ± s.d.) were performed on monolayers of differentiated EOECs cultured in Transwell inserts 21, 28, 35, and 42 days after air–liquid interface introduction (five mares: five inserts per mare). Small letters (a, b) indicate significant differences between days (P < 0.05; Student t-test for paired samples). (D) The individual effect of these five different mares on TEER values was also verified. (E) The relationship between TEER and flux of Na-fluorescein (0.4 kDa size) across the cultured monolayers was assessed (n = 47 assessments pooled from Days 21 to 42). Percentage (mean ± s.d.) of EOECs with (F) primary and (G) secondary cilia in the monolayers. (H) The cell height (mean ± s.d.) of cultured EOECs from individual mares. Reference values (tissue) for the percentage of ciliated EOECs and cell height in the ampulla segment were obtained from three mares (n = 3) in each of the follicular and luteal phases. For a schematic overview of the experimental timeline, see Figure 1A.
Figure 5
Figure 5
Proof-of-principle experiment for spontaneous re-differentiation of EOECs and quality assessment of EOEC monolayers. Monolayer confluency was assessed by TEER and paracellular tracer flux measurements. (A) TEER measurements (mean ± s.d.) of monolayers of re-differentiated EOECs cultured in Transwell inserts were performed 0, 21, 28, 35, and 42 days after air–liquid interface introduction for four mares (eight inserts per mare). Small letters (a, b) indicate significant differences between days (P < 0.05; Student t-test for paired samples). (B) The individual effect of these four different mares on TEER values was also verified. (C) A clear relationship between the overall TEER and paracellular tracer flux results was evident. TEER values of 462 Ω/cm2 corresponded with less than 5% tracer flux (n = 72 assessments pooled from Days 0 to 42). Presence of tight junction complexes was demonstrated by a dense band of occludin (green, original magnification: 945x). (D) Expression of secondary cilia (mean ± s.d.) of EOECs 6 weeks (42 days) after introduction of an air–liquid interface differed between samples. (E) Overview of a monolayer with 26% EOECs with secondary cilia (green: cilia, red: F-actin, blue: DNA; original magnification: 200x). For a schematic of the experimental timeline, see Figure 1Ba.
Figure 6
Figure 6
(A) Illustration of the re-differentiation protocol: Representative phase contrast images of (a) oviduct epithelial vesicles at day 1 of culture (200x), (b) attached vesicles with outgrowth of EOECs at Day 3 of culture (150x) and (c) confluent oviduct monolayer of de-differentiated EOECs on Day 10 of culture in 6-well plates (200x). Fluoresence microscopic images represent (d) a re-established monolayer of flat de-differentiated EOECs in Transwell inserts before air–liquid interface introduction, which did not show primary and secondary cilia, (e) a monolayer of columnar-polarized EOECs showing primary cilia and a few secondary cilia after introducing an air–liquid interface and (f) an exceptional (<2%) monolayer of columnar-polarized EOECs showing primary and secondary cilia (13.8%) [green (anti-acetylated α-tubulin antibodies-AlexaFluor 488 secondary antibody): primary (single green dots at each EOEC) and secondary cilia (many green dots on some EOECs), red (phalloidin conjugated to Alexa Fluor 568): cytoskeleton, blue (Hoechst 33342): nuclei] (original magnification, 400x). (B) The percentage of EOECs (mean ± s.d.) with primary and secondary cilia from monolayers with a low or high rate of spontaneously differentiated EOECs 1 and 2 months after air–liquid interface introduction. Significant differences in the percentage of EOECs with secondary cilia are indicated by different small letters (P < 0.05). (C) The cell height (mean ± s.d.) from low and high spontaneously differentiated monolayer EOECs was measured from five different mares for both monolayer types. For a schematic overview of the experimental timeline, see Figure 1Bb.
Figure 7
Figure 7
(A) Illustration of an EOEC cultured monolayer exposed to follicular phase mimicking hormone concentrations stained for nuclear progesterone receptors (1000x). (B) Percentage of monolayer EOECs (mean ± s.d.) demonstrating a nucleus positively stained for progesterone receptors after culture under air–liquid interface conditions and exposure for 16 days to luteal phase oviduct (10 ng/mL E2 and 1000 ng/mL P4) and blood (20 pg/mL E2 and 10 ng/mL P4) hormone concentrations; and five consecutive days to follicular phase oviduct (80 ng/mL E2 and 40 ng/mL P4) and blood (40 pg/mL E2) hormone concentrations. Significant differences in the percentage of EOECs showing nuclear progesterone receptors are indicated by different capital letters (n = 4, P < 0.05).
Figure 8
Figure 8
(A) Density of sperm cell binding to re-differentiated EOEC monolayers exposed to cycle stage-dependent hormonal conditions. Different capital letters indicate significant differences in sperm-binding density between luteal and follicular phase stimulated EOEC monolayers (n = 3, P < 0.05). (B) Representative fluorescent overlay images of bound spermatozoa to EOEC monolayers exposed to (a) luteal and (b) follicular phase hormone conditions. Laser scanning confocal microscopy (630x magnification) was performed to design orthogonal section views from the apical side of the EOECs and the bound spermatozoa. Spermatozoa (DNA in blue: Hoechst 33342), indicated by white arrows, were bound to cilia (purple: acetylated α-tubulin (1:150) detected with goat-anti-rabbit Alexa Fluor 647 (1:100) on the surface of EOEC monolayers.
Figure 9
Figure 9
(A) Representative fluorescent images for EOEC monolayers cultured by the direct seeding and re-differentiation protocols in microfluidic chips. (a) Seeding oviduct epithelial vesicles (direct seeding protocol) was not effective for establishing EOEC monolayers. EOECs were not able to attach to the microporous membrane. By contrast, seeding de-differentiated EOECs and subsequently inducing re-differentiation by air–liquid interface introduction supported the formation of confluent monolayers in microfluidic chips (re-differentiation protocol). Similar to culture in Transwell inserts, (b) a monolayer of columnar-polarized EOECs showing primary cilia, but few secondary cilia after introducing an air–liquid interface and (c) exceptional monolayer (only two monolayers in this study) of columnar-polarized EOECs showing primary and secondary cilia (>20%) [green (anti-acetylated α-tubulin antibodies-Alexa Fluor 488 secondary antibody): primary (single green dots at each EOEC) and secondary cilia (many green dots on some EOECs), red (phalloidin conjugated to Alexa Fluor 568): cytoskeleton, blue (Hoechst 33342): nuclei] (original magnification, 400x). (B) The percentage of primary and secondary ciliated EOECs (mean ± s.d.) from low and high spontaneously differentiated oviduct monolayers cultured in microfluidic chips established by the re-differentiation protocol, 1 and 2 months after air liquid interface introduction. Significant differences in the percentage of secondary ciliated EOECs between low and high secondary ciliated monolayers are indicated by different small letters (P < 0.05). (C) The cell height (mean ± s.d.) from low and high spontaneously differentiated monolayer EOECs was measured from five different mares for the low spontaneously differentiated monolayers and from two different mares for the high spontaneously differentiated monolayers.

Similar articles

Cited by

References

    1. Palmer E, Bezard J, Magistrini M, Duchamp G. In vitro fertilization in the horse. A retrospective study. J Reprod Fertil Supp 1991; 44:375–384. - PubMed
    1. Bézard J, Magistrini M, Battut I, Duchamp G, Palmer E. In vitro fertilization in the mare. Recueil De Medecine Veterinaire 1992; 168:993–1003.
    1. Hinrichs K, Love CC, Brinsko SP, Choi YH, Varner DD. In vitro fertilization of in vitro-matured equine oocytes: effect of maturation medium, duration of maturation, and sperm calcium ionophore treatment, and comparison with rates of fertilization in vivo after oviductal transfer. Biol Reprod 2002; 67:256–262. - PubMed
    1. Choi YH, Okada Y, Hochi S, Braun J, Sato K, Oguri N. In-vitro fertilization rate of horse oocytes with partially removed zonae. Theriogenology 1994; 42:795–802. - PubMed
    1. McPartlin LA, Suarez SS, Czaya CA, Hinrichs K, Bedford-Guaus SJ. Hyperactivation of stallion sperm is required for successful in vitro fertilization of equine oocytes. Biol Reprod 2009; 81:199–206. - PubMed

Publication types