. 2021 Dec 28;79(1):34.
doi: 10.1007/s00284-021-02748-7.

Correlations Between Root Metabolomics and Bacterial Community Structures in the Phragmites australis Under Acid Mine Drainage-Polluted Wetland Ecosystem

Affiliations

Correlations Between Root Metabolomics and Bacterial Community Structures in the Phragmites australis Under Acid Mine Drainage-Polluted Wetland Ecosystem

Chimdi M Kalu et al. Curr Microbiol. .

Abstract

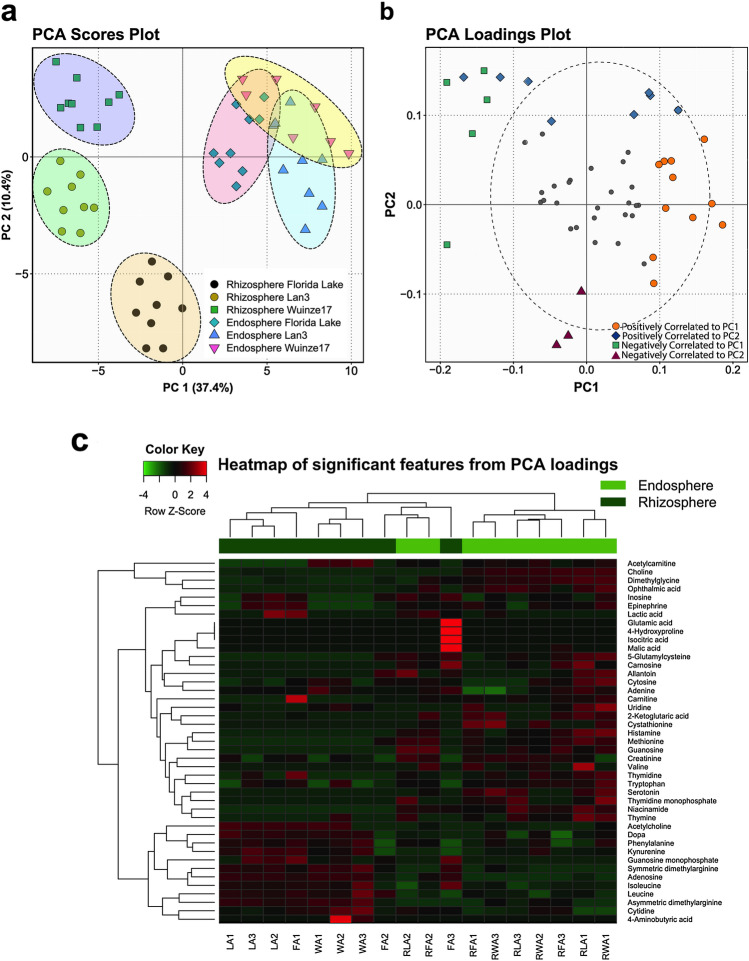
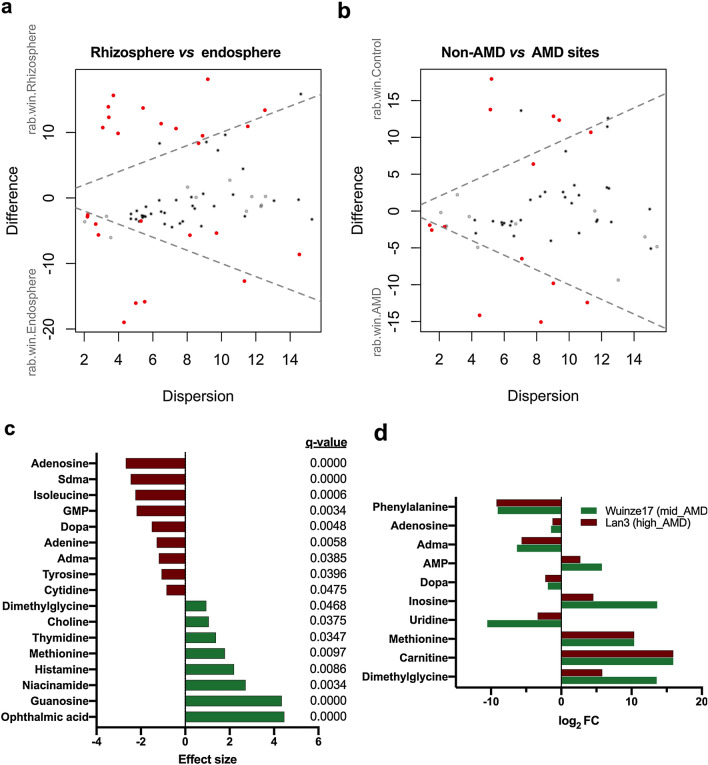
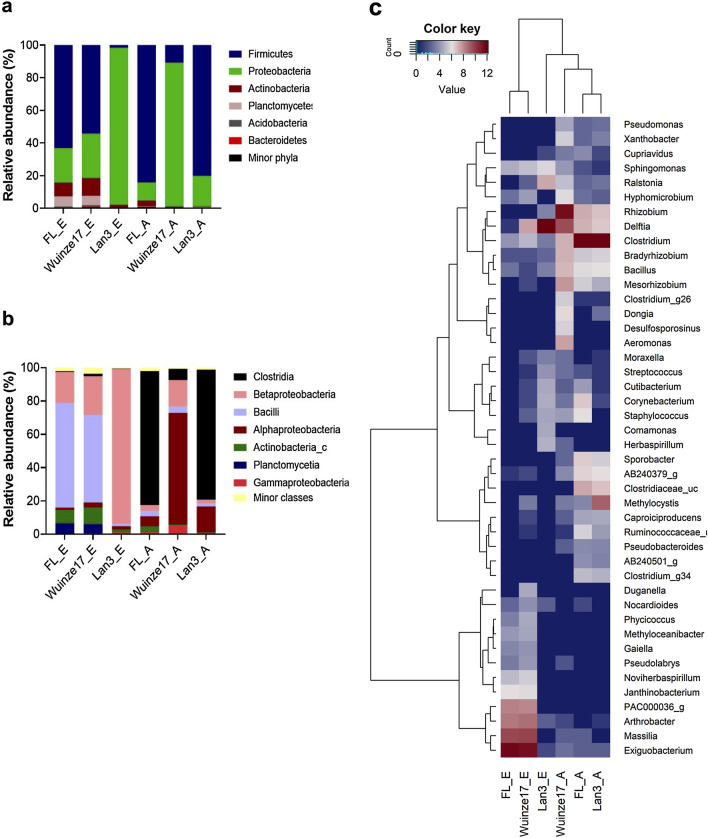
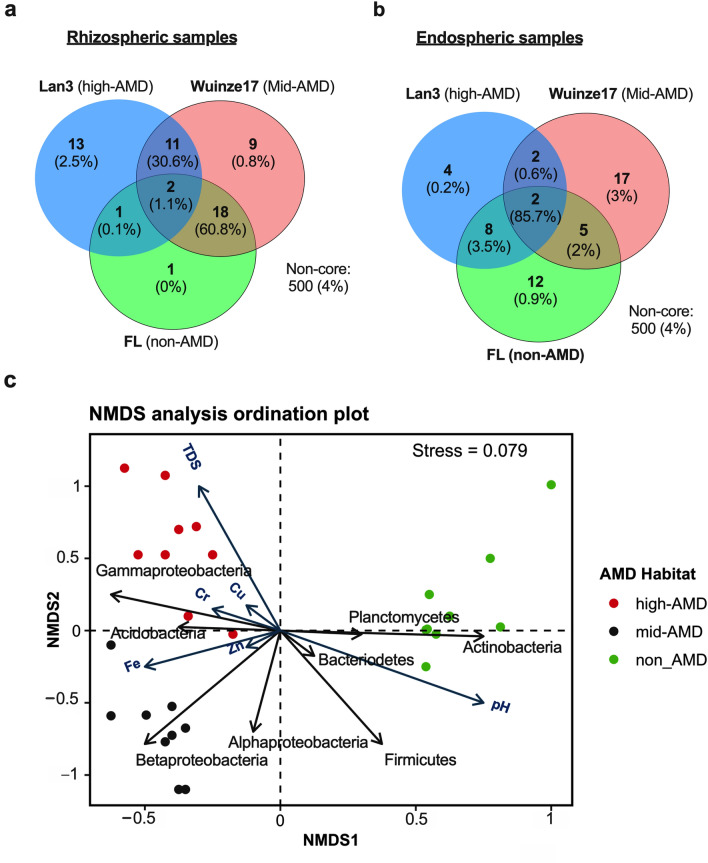
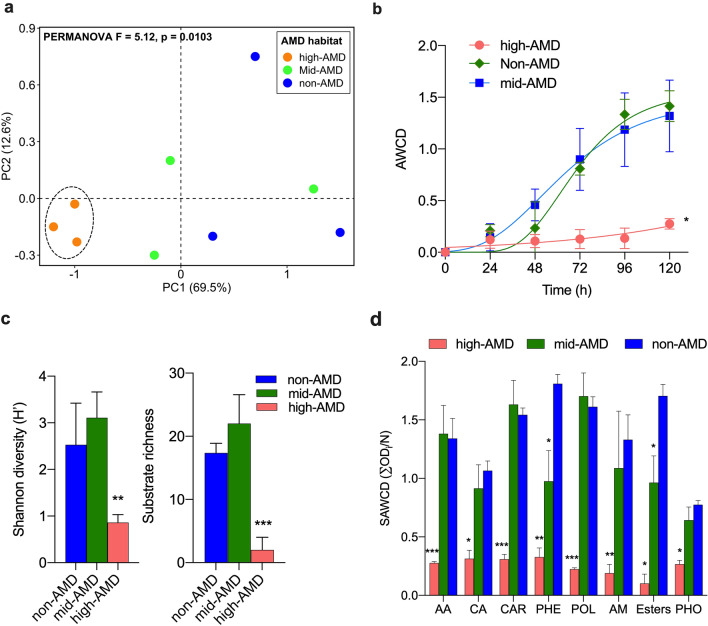
Despite root microecology playing critical role in plant growth and fidelity, relatively few studies have focused on the link between the microbial communities and root metabolome in the aquatic macrophytes under heavy metal (HM) pollution. Using high-throughput metagenomic sequencing, targeted metabolomics and community-level physiological profile analyses, we investigated the symbiotic associations between Phragmites australis with rhizospheric bacterial communities under differing acid mine drainage (AMD) pollution. Results indicated that AMD pollution and root localization significantly affected root metabolome profiles. Higher accumulation of adenosine monophosphate, inosine, methionine, carnitine and dimethylglycine were observed in the rhizosphere under AMD than non-AMD habitat. Overall, the bacterial diversity and richness, and functional (metabolic) diversity were lower under high-AMD pollution. While non-AMD site was enriched with members of phylum Firmicutes, Proteobacteria were the most abundant taxa in the rhizosphere and endosphere under AMD-polluted sites. Further, plant growth promoting rhizobacteria (Rhizobium, Delftia, Bradyrhizobium, and Mesorhizobium) and metal-tolerant bacteria (Bacillus, Arthrobacter, Massilia and Methylocystis) were most abundant in AMD-polluted than non-AMD habitat. Finally, pH, TDS (total dissolved solids), Cu, Cr, Fe, and Zn content were the key environmental factors that strongly contributed to the spatial perturbation of rhizospheric metabolites, proteobacterial and acidobacterial taxa. Overall, the study linked the differential endospheric and rhizospheric bacterial community and metabolite profiles in P. australis under AMD environment and provided insights into HM adaptability and phytoremediation potential.


Conflict of interest statement

Chimdi Mang Kalu, Henry Joseph Oduor Ogola, Ramganesh Selvarajan, Memory Tekere and Khayalethu Ntushelo declare no conflict of interest.

Figures

Fig. 1
Fig. 1
Principal component analysis of metabolic profiles in P. australis endosphere and rhizosphere under different AMD pollution gradient. a Score plot of PC2 versus PC1. Black ellipses represent the 90% confidence intervals for each group. b Loading plot of PC2 versus PC1 showing metabolites with significant loadings at P < 0.1. c Supervised hierarchical clustering heatmap of significant metabolites identified by PC loadings. The color scheme red and green indicate high and low concentrations of metabolites, respectively (Color figure online)
Fig. 2
Fig. 2
Relationship between metabolite abundance and observed differences in the primary metabolome of the P. australis rhizosphere and endosphere under AMD conditions (a, b). In both plots red represents differentially abundant features called with q < 0.05; grey are abundant, but not non-differentially abundant; black are rare, but not differentially abundant. c Plot showing the effect size and BH-adjusted P values (q-values) of the significant metabolites between rhizosphere (green) and endosphere samples (red). d Log2 Fold Change analysis of differentially abundant rhizospheric metabolites related to AMD pollution gradient using non-AMD site as reference. Sdma, symmetric dimethylglycine; GMP, Guanosine monophosphate; Adma, symmetric dimethylglycine; and AMP, Adenosine 3′,5′-cyclic monophosphate (Color figure online)
Fig. 3
Fig. 3
Stacked and heatmap plots of the relative abundances of major bacterial taxa. Stacked plots of major phyla (a) and classes (b) associated rhizosphere and the root endosphere of Phragmites australis growing in different AMD polluted environments. FL_E, Wuinze17_E and Lan3_E denotes the rhizospheric samples, while FL_A, Wuinze17_A, and Lan_A are endosphere samples of non-AMD, mid-AMD and high-AMD sites, respectively, and. c Heatmap of log2 normalized counts of the 40 most abundant genera. The heatmap color (blue to brown) represent the row z-score of the mean relative abundance from low to high (Color figure online)
Fig. 4
Fig. 4
Venn diagrams of core microbiome and nonmetric multidimensional scaling (NMDS) analysis plot. Venn diagram showing number of unique and shared OTUs associated with rhizosphere a and root endosphere b of Phragmites australis under different AMD environments. c NMD plot derived from the Weighted Unifrac showing the association of bacterial communities and metabolites with the environmental variables: pH, TDS, Fe, Cr, Cu and Zn in the rhizosphere of P. australis under differing AMD pollution
Fig. 5
Fig. 5
Community-level patterns of rhizosphere microbial carbon metabolism in P. australis under different AMD pollution. a PCA plot showing patterns of carbon utilization. The dashed line indicates significant cluster based on PERMANOVA (P < 0.05). b Average well color development (AWCD) at 96 h of incubation. c Shannon diversity index and substrate richness based on CLPP profile at 96 h of incubation. d Substrate average well color development (SAWDC) index at 96 h of incubation for different carbon substrate guilds. AA amino acids, CA carboxylic acids, CAR carbohydrates, PHE phenolic compounds, POL polymers, AM amines, esters; and PHO phosphorylated chemicals. ***, **, and *Indicate significant differences based on Tukey’s test at P < 0.001, P < 0.01, and P < 0.05

Similar articles

Cited by

References

    1. Guo L, Cutright TJ. Remediation of AMD contaminated soil by two types of reeds. Int J Phytoremediation. 2015;17:391–403. doi: 10.1080/15226514.2014.910170. - DOI - PubMed
    1. He R, Zeng J, Zhao D, et al. Contrasting patterns in diversity and community assembly of Phragmites australis root-associated bacterial communities from different seasons. Appl Environ Microbiol. 2020;86:e00379–e420. doi: 10.1128/AEM.00379-20. - DOI - PMC - PubMed
    1. Kalu CM, Ogola HJO, Selvarajan R, et al. Fungal and metabolome diversity of the rhizosphere and endosphere of Phragmites australis in an AMD-polluted environment. Heliyon. 2021;7:e06399. doi: 10.1016/j.heliyon.2021.e06399. - DOI - PMC - PubMed
    1. Bowen JL, Kearns PJ, Byrnes JEK, et al. Lineage overwhelms environmental conditions in determining rhizosphere bacterial community structure in a cosmopolitan invasive plant. Nat Commun. 2017;8:433. doi: 10.1038/s41467-017-00626-0. - DOI - PMC - PubMed
    1. Li Y, Yuan L, Xue S, et al. The recruitment of bacterial communities by the plant root system changed by acid mine drainage pollution in soils. FEMS Microbiol Lett. 2020 doi: 10.1093/femsle/fnaa117. - DOI - PubMed

LinkOut - more resources